M
ASTER OF
S
CIENCE IN
FINANCE
M
ASTERS
F
INAL
W
ORK
PROJECT
EQUITY RESEARCH
:
P
IRELLI
D
ANIEL DOS
S
ANTOS
N
UNES
S
UPERVISOR
:
P
ROF
.
D
OUTORA
C
LARA
R
APOSO
i
Abstract
Pirelli is one of the best known tyre manufacturers in the world that stands out with high quality
products, and a consistent and dominant presence on motorized sports. The company acts
solely on the consumer tyres market, with a particular focus on high value tyres. Pirelli’s
position comes from large investments in R&D over the years and retaining talent, allowing the
company to have some of the best tyres on the market in terms of safety and performance.
This project is a complete valuation of the company with the objective of analyzing the possible
outcome of an investment on its stocks, with the disclaimer that unpredictable effects may
affect the company’s performance.
For the valuation, the Discounted Cash Flows method (DCF) was used, complemented with a
Relative Valuation in order to support the overall conclusion.
The DCF model was built based on a complete analysis of the company and tyre industry, and
it’s supported by a number of additional analysis, such as sensitivity analysis and risk analysis.
This thesis will be done and presented following the CFA model.
ii
Resumo
A Pirelli é um dos fabricantes de pneus mais conhecidos do mundo, que se destaca pelos
produtos de alta qualidade e uma presença consistente e dominante nos desportos
motorizados. A empresa atua exclusivamente no mercado de pneus para consumidores, com
foco especial em pneus premium. A posição da Pirelli surge de grandes investimentos em
pesquisa e desenvolvimento ao longo dos anos e retenção de talentos, permitindo que a
empresa tenha alguns dos melhores pneus do mercado em termos de segurança e
desempenho.
Este projeto é uma avaliação completa da empresa com o objetivo de analisar o possível
resultado de um investimento nas suas ações, com a ressalva de que efeitos imprevisíveis
podem afetar o desempenho da empresa.
Para a avaliação, foi utilizado o método dos Fluxos de Caixa Descontados (DCF),
complementado com uma Avaliação por Múltiplos, no sentido de suportar a conclusão final.
O modelo DCF foi construído com base numa análise completa da empresa e da indústria de
pneus, e é suportado por várias análises adicionais, nomeadamente análise de sensibilidade
e análise de risco.
iii
Acknowledgements
This project has revealed to be very satisfying and rewarding, and it would never be possible
to accomplish without the help of my friends and family.
My dad and mother had a major role on my academic live and have always supported me and
encouraged in many ways. During this project it was no different, and I feel fortunate to have
had their trust and support throughout all the process.
My sister’s friendship was very important during the making of this project, motivating and
helping me in every way possible, and always pushing and incentivizing me go further.
I also want to thank all my friends for all the encouragement, in particular Daniel Frade who
was very supportive and helpful throughout all the project.
My girlfriend was also very motivational and understanding all the time, and for that I thank
her.
My final thank you goes for Professor Clara, that demonstrated patience and support during
all the process.
This marks the ending of an academic phase, that was both amazing and a major part of my
personal and professional development. I want to thank all the professors and people that work
at ISEG, and say that it was an honor to be part of this institution. I hope that someday I will
be back when I decide to enroll on any other academic projects.
iv
Index
Abstract
i
Resumo
ii
Acknowledgements
iii
Index
iv
Tables Index
v
Figures Index
vi
1. Research Snapshot
7
2. Business Description
7
3. Management and Corporate Governance
12
4. Industry Overview and Competitive Positioning
13
5. Investment Summary
16
6. Valuation
17
7. Financial Analysis
20
8. Investment Risks
21
v
Tables Index
Table 1 - Investment Risk
7
Table 2 - Key Information
7
Table 3 - Share information
8
Table 4 - Dividend history
11
Table 5 - Directors list
12
Table 6 - Remuneration committee
12
Table 7 - Social Key Performance Indicators
12
Table 8 - Tyre market overview
14
Table 9 - Tyre market competitive overview
14
Table 10 - SWOT analysis of Pirelli
15
Table 11 - Investment summary
16
Table 12 - Investment classification matrix
16
Table 13 - Price Target calculation
17
Table 14 - Enterprise value calculation in Thousands of euros
18
Table 15 - Free cash Flow Projections
19
Table 16 - WACC calculation
19
Table 17 - Relative valuation Output
20
vi
Figures Index
Figure 1 - Stock Price
7
Figure 2 - Total Revenues (Thousands €)
7
Figure 3 - Factories location
8
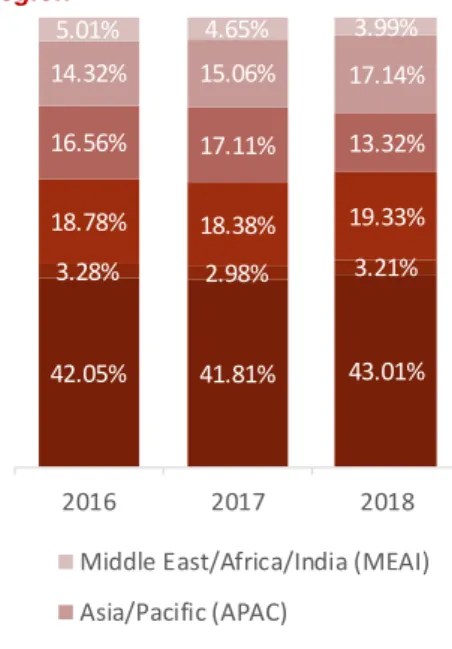
Figure 4 - Weight of total revenue by Region in 2018
8
Figure 5 - Pirelli’s Revenue evolution by region
9
Figure 6 - Research and Development costs
9
Figure 7 - Revenues by type of tyre in 2018
9
Figure 8 - Passenger cars (stock per 1,000 pop)
10
Figure 9 - Number of car models by company
10
Figure 10 - SUV penetration
10
Figure 11 - Share Capital Structure
11
Figure 12 - Institutional Investors by region
11
Figure 13 - GDP and Inflation rates
13
Figure 14 - Raw materials Price (€)
13
Figure 15 - Global tyre market value
13
Figure 16 - Global tyre market value forecast
14
Figure 17 - Global tyre market share
14
Figure 18 - Five Forces Analysis on Pirelli Business
15
Figure 19 - Pirelli and STOXX Europe 600 Stock price evolution in %
16
Figure 20 - Pirelli’s Revenues in Billion euros
17
Figure 21 - Pirelli and tyre market revenue evolution in %
17
Figure 22 - Cost of materials used in Billion euros
18
Figure 23 - Pirelli’s debt in Billions €
18
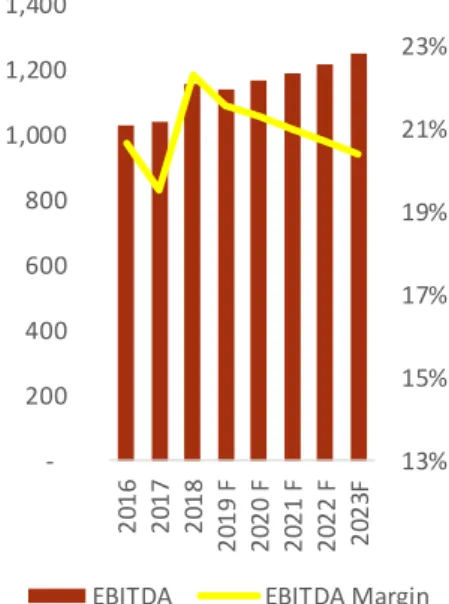
Figure 24 - Pirelli’s EBITDA in Million euros
21
Figure 25 - Pirelli’s Equity Ratio
21
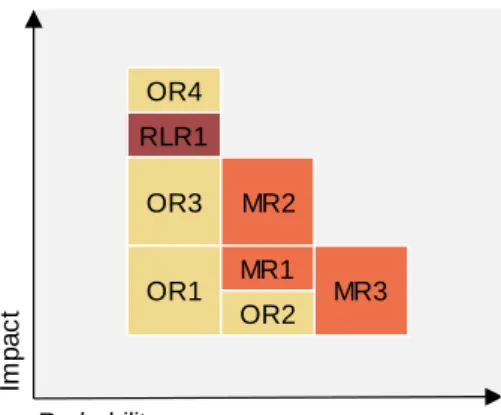
Figure 26 - Risk Matrix
22
7
4,480 4,785 4,976 5,352 5,194 2014 2015 2016 2017 20181. Research Snapshot
Price Target of € 6,80, with an upside potential of 25% and medium risk. Our final
recommendation is BUY. 4.00 4.50 5.00 5.50 6.00 6.50 7.00 7.50 8.00 8.50
Stock Price Price Target Current Price
Our recommendation is BUY, with a Price Target of € 6,80 for the year end of 2019 with medium risk. The analysis performed on Pirelli made us conclude that the company is undervalued with and upside potential of 25%, when compared to the price at September 30th, 2019.
The price target was reached through the Discounted Cash Flows method, complemented with Relative valuation.
The tyre industry is currently mature and very competitive, in which product quality is a key factor for success. Technology is evolving fast, and it has been impacting the automotive industry, affecting the tyre industry. Cars are continuously improving and demand better tyres in terms of performance and safety, supporting Pirelli’ strength in the market. The company’ strategy to focus on consumer premium tyres has been proving successful, with innumerous opportunities for the company to continue its success in the future, namely the appearance of electric and autonomous cars. Through the recent investment in these opportunities, Pirelli is one of the most well prepared tyre producers for the imminent changes on the tyre market.
Pirelli has registered positive results over the last years, with a continuous growth of revenues and striking EBITDA margins when compared to its peers. Our analysis concludes that this growth trend will continue for the tyre industry, including Pirelli. The company’s large investment in R&D and retaining talents allow it to maintain a relevant position in the market, supported by a strong connection with automotive sports, promoting the prestige image of its tyres in terms of quality and branding. Being a multinational company, it remains sensitive to changes in Exchange rates and Macroeconomic factors. Nevertheless, forecasts point for a consistent future GDP growth worldwide.
Figure 3 - Total Revenues (Thousands €)
Figure 4 - Total Revenues (Thousands €)
Source: Company data
Table 5 - Share informationSource: Company data 25% Upside Potential
Table 2 -
Key
Informati
on
25% Upside PotentialFigure 1 - Stock Price
Figure 2 - Stock Price
Source: Company Information
Source: Company Information
Low Medium High
Source: Analyst
Source: Analyst
Source: Analyst
Table 3 - Key Information
Table 4 - Key Information
Company Pirelli & C. S.p.A.
Activity Tyre Producer
Headquarters Italy
Date 30-09-2019
Volume 3,175,679
52-week price range €4,43 - €7,33
Closing Price €5.43
Price Target DCF €6.8
Price target Multiples €6.01
Recommendation Buy
8
ISIN Code IT0005278236 Bloomberg Ticker
Symbol PIRC:IM
ISIN Code IT0005278236
Currency Euro (€)
Primary Exchange Milan Stock Exchange Share Capital € 1,904,374,935.66 Number of Shares
Oustanding 1,000,000,000 Type of Shares No par value shares
IPO Date October 4th, 2017
2. Business Description
Company description
Pirelli & C. S.p.A. is an Italian multinational company that stands next to the main tyre
producers. It was founded in 1872 by Giovanni Battista Pirelli, producing only rubber band products. Following the second industrial revolution, and the exponential increase in car usage, Pirelli starts in the rubber band production line for carriages in 1885, and the first tyre for velocipedes is manufactured in 1894. In the early years of 1900, Pirelli’s geographic expansion took off.
In 2017 Pirelli started focusing on its main profitable sector, shifting to produce only consumer tyres, commonly used for luxury cars and automobile sports. The objective is to consolidate its position on high quality consumer tyres, both on matters of performance and safety, while adding a factor of customization and personality to them. The remaining areas of business, such as industrial tyres, have been split out of the company.
It has around 31,500 employees, 19 factories in 12 countries (Figure 3 - Factories
location
Figure 3), 15,900 points of sales in 160 countries and had about 5.2 Billion sales in 2018. Pirelli is a major player in the tyre industry, being the only global one focused on consumer tyres – including cars, motorcycles, and bicycles. The remaining main players also produce Industrial tyres and other rubber products. Pirelli maintains a strong position in selling premium tyres, leader even. It has a big presence in sport competitions and has been sponsoring them since 1907. It is the sole tyre supplier for the Formula One World Championship and for the World Superbike Championship since 2011. This strong presence, especially in Formula 1, is the payoff of the companies’ major investment in research and development and market positioning. Pirelli’s headquarters stand in Milan, and the company had a worldwide production capacity of 75 million car tyres in 2018.
History
Giovanni Battista Pirelli founded a limited partnership in 1872 to produce elastic rubber items – "G.B. Pirelli & C.". The first factory to produce rubber items was stablished in Milan in 1873 and was built for the production of rubber bands for carriages.
The limited partnership was dissolved, and a Limited Shares Partnership was born under the name of Pirelli & C.
In 1894, Pirelli produced its first tyres for velocipedes.
The production of car tyres started in 1901, driven by a strong technological development happening and by an ongoing interest and connection with the racing world.
During the first years of 1900, Pirelli’s went through a strong geographical expansion, creating its first factories outside Italy - namely to Barcelona (Spain, 1902), Southampton (England, 1903), Buenos Aires (Argentina, 1917), Manresa (Spain, 1924), Burton on Trent (England, 1928) and Brazil (1929).
The Grand Prix of the automobile club of France was for the first time won by a car using Pirelli tyres, in 1907.
In 1922, the Limited Shares Partnership Pirelli & C. was listed at the Milan Stock Exchange. Soon after, there was a reorganization of the Company and it was listed on the New York Stock Exchange, becoming the first Italian group trading on the American market.
After the Second World War, following the rest of the world, Pirelli’s development was strengthened, and two new factories were stablished in Latin America, namely in Brazil (1940) and Argentina (1955).
Source: Company information
Figure 8 - Weight of total revenue by Region in 2018Source: Company information
Figure 6 - Factories location
Figure 7 - Factories location
Source: Company data
Figure 5 - Factories locationSource: Company data 43% 13% 19% 4% 17% 3%
Source: Company data
Source: Company data
Figure 9 - Weight of total revenue by Region in 2018
Figure 10 - Weight of total revenue by Region in 2018
Table 6 - Share information
9
42.05% 41.81% 43.01% 3.28% 2.98% 3.21% 18.78% 18.38% 19.33% 16.56% 17.11% 13.32% 14.32% 15.06% 17.14% 5.01% 4.65% 3.99% 2016 2017 2018Middle East/Africa/India (MEAI) Asia/Pacific (APAC)
Latin America NAFTA Russia and CIS Europe In 1949, Pirelli created the Tyres Cinturato, a type of high quality tyres that were more
advanced that the remaining competitors in both matters of performance and safety. The Cinturato tyres have evolved since then, but still stand today as one of the best tyres to use, and a Pirelli’s reference product.
During the sixties, seventies and eighties Pirelli continued with its geographical expansion throughout the world and technological development, even acquiring its first company in 1986 - Metzeler Kaotscuck AG, a German company specialized in producing moto tyres. In 1988 Pirelli acquires Armstrong Tyre Company, an US based company with a relevant position in the North American market, and Pirelli’s entry vehicle to that market. During the following years, Pirelli continued acquiring relevant companies, mainly in the rubber industry.
In the early nineties Pirelli failed an attempted acquisition of Continental AG, resulting in the slowing of its expansion progress until 1994, due to all the resources that were already spent on Continental’s acquisition attempt. Eventually a joint venture was celebrated between the two companies in 2004, to produce steel cords.
By 2000, Pirelli was involved in the production of many rubber products, resulting in part from regular purchases and sells of companies in the industry. A relevant deal for Pirelli was the selling of its cable and telecommunications systems business to Goldman Sachs in 2005, with an Enterprise Value of 1.3 billion euros1.
By 2008 a new project took off, the “Settimo Torinese”, resulting on the establishment of a new factory meant to be the most technological advanced of the entire group, and where the new Cinturato P7 was created, a new type of high performance tyre created under a friendly environment philosophy.
In 2010 Pirelli turned into a pure tyre company after selling its broadband solutions business and Real Estate investments2. It kept producing both industrial and consumer
tyres.
A Long-term industrial investment partnership agreement was celebrated in March
2015 between Pirelli and three entities – Camfin, LTI, and CNRC (China National Tire
& Rubber Corporation, Ltd.). CNRC is a Chinese company controlled by ChemChina. The deal resulted on the delisting of Pirelli from the Milan Stock Exchange, only to return on 2017.
Re-listing of Pirelli – IPO in 2017
Pirelli was delisted in 2015, returning to the markets in 2017 through an IPO3.
In 2015, ChemChina took 65% of Pirelli’s stakes and delisted the company from the Milan Stock Exchange. For the past years, Chinese companies have been taking over innumerous European companies, making it up for a discussion on whether these interventions give too much power to China’s enterprises and government.
ChemChina (China National Chemical Corp) is a Chinese state Company that has been around for only 14 years and stands as one of the biggest chemical companies of the world, standing as 167th on the Fortune Global 5004. ChemChina is also known
for its many billionaire acquisitions. Pirelli’s acquisition in 2015 was made through a subsidiary focused on rubber products - China National Tyre & Rubber Co. (CNRC)5.
According to Pirelli, the Chinese company always gave autonomy to the Italian tyre manufacturer’s management.
In 2017 ChemChina decided to give up control of Pirelli, launching an IPO of up to 40% of its capital, leaving the Chinese company with 45% of the company’s stakes. This move intended to give more power and independence to Pirelli pursuing its goals and ideals, and to raise some money to face some debt that Pirelli was piling up. According to Reuters, ChemChina’s decision was also taken as a way of showing that Beijing has a friendly market approach on European investments.
The first IPO shares were issued on October 4th, 2017, with prices ranging from 6.3 to 6.5 euros per share6. By the end of 2017 there were 853,232 shares on the market,
and by the end of 2018 there were 1,000,000 ordinary shares, number that stands
Figure 11 - Pirelli’s Revenue evolution by region
Figure 12 - Pirelli’s Revenue evolution by region 3.8% 3.8% 3.9% 3.9% 4.0% 4.0% 4.1% 4.1% 4.2% 4.2% 4.3% 50 100 150 200 250 2014 2015 2016 2017 2018 M il li on s
Research & Development costs R&D costs/Revenues (%)
Source: Company data
Source: Company data
Figure 13 - Research and Development costs
Figure 14 - Research and Development costs
60% 33%
93%
6% 1%
Cars Motos Bicycles Standard Tyres
Premium Tyres % of Total Revenues
Figure 15 - Revenues by type of tyre in 2018
Figure 16 - Revenues by type of tyre in 2018
Source: Company data
Source: Company data
Source: Company Information
Figure 17 - Passenger cars (stock per 1,000 pop)Source: Company Information
10
Figure 20 - Number of car models by company
Figure 21 - Number of car models by company
Figure 22 - SUV penetration
Figure 23 - SUV penetration
133 141 156 167 173 12 14 17 5 15 24 25 5 21 27 31 6 2010 2015 2018 5 10 25 30 33 10% 14% 30% 35% 38% 0% 5% 10% 15% 20% 25% 30% 35% 40% 0 5 10 15 20 25 30 35 2000 2010 2016 2018 2020E SUV Sales (million vehicles) Weight on total sales unchanged until today. The IPO comes as a part of a reorganization process in Pirelli
that includes the transfer of the industrial business to the shareholder Marco Polo, and redirects Pirelli to a solo focus on the Consumer business.
Strategic direction
As stated before, the current strategy to Pirelli is to focus on the consumer tyres production. The company is constantly investing in Research and development (Figure 6 - Research and Development costs
Figure 6), expense that totaled €219 million (4.2% of sales)7 in 2018, aiming to
continually create superior products and maintain its leadership position. Another relevant factor for Pirelli is marketing, aimed for car enthusiasts and luxury car owners, the company has been linked with many sports over the years (namely football and baseball), but its shining position comes from the sponsorship on Formula One Championships, where Pirelli has contracted to be the exclusive tyre supplier until 20238.
This implies that Pirelli will focus mainly on High Value Tyres, aiming to be the leader in quality and branding, but also more expensive when compared to the remaining Tyre producing company’s.
Segment analysis
Pirelli operates under a single segment worldwide – consumer tyres for cars, motorcycles and bicycles. It sells both standard and high value tyres, although the company main focus is the latter.
We can see the company’s revenue by type of product on Figure 7 - Revenues by
type of tyre in 2018 Figure 7.
We will explore the industry overview later on this project.
Goals for the future
According to the Annual Report of 2018, Pirelli’s main objectives for 2019 were to increase in revenues between 4 to 6%, mainly supported by the increased focus on high value segments and increase of price/mix by around 5%. Another relevant factor is the plan to increase investment on the company’s digital transformation, through the development of cyber solutions and the start-up of a joint venture in China.
The expectations on increasing sales were however adjusted to 3 to 4% by Pirelli to meet the first quarter data on tyre demand, since there was a general decrease around the globe, except North America where an increase of 2% was registered. Even considering the decrease in demand, Pirelli expects to increase profits from the increase of sales of high value tyres and increases in price, supported a continuous increase on the quality of tyres.
Key drivers of global high value tyre market growth
Based on the fact that the company is focused on producing high value tyres, the key drivers for this market growth are presented below9:
1. Penetration of Premium and prestige cars:
The number of cars in circulation has been increasing considerably over the years (Figure 8 - Passenger cars (stock per 1,000 pop)
Figure 8), with forecasts supporting that this increase will continue in the future, in particular for prestige and premium cars. The same applies for the motorbike industry.
Considers only models with >5,000 units sold. Source: Company data
Considers only models with >5,000 units sold. Source: Company data
Figure 18 - Passenger cars (stock per 1,000 pop)
Figure 19 - Passenger cars (stock per 1,000 pop)
Source: The Economist IU
11
Figure 24 - Share Capital Structure
Figure 25 - Institutional Investors by regionFigure 26 - Share Capital Structure
Figure 27 - Institutional Investors by region
Figure 28 - Institutional Investors by region
45.52% 34.69%
10.05%
6.24% 3.50%
Marco Polo International Italy S.R.L Institutional investors
Camfin S.P.A.
Long term Investments Retail Investors 52% 27% 17% 4% Europe U.K. North America Rest of the World 2. Increase in number of homologations and growing demand for specialists:
Some of the premium car manufacturers are developing new models every year, which use different types of tyres (Figure 9 - Number of car models by company
Figure 9). This supports the development, specialization and homologation of new technologies to the different models on the market, reinforcing the value of high value products and their differentiation.
This evolution generates a demand for specialists that can answer the car manufacturers and meet consumer’s needs.
3. Rising penetration of SUV’s:
SUV’s are most commonly equipped with high value tyres, and this kind of vehicles has been successfully penetrating the market. It is expected that, by 2020, about one third of all vehicle sales will be SUV’s (Figure 10 - SUV penetration
Figure 10). 4. Car evolution:
As stated before, car manufacturers have been creating new models, and particularly for premium car brands, the development and commercialization of new models has been accompanied with several technological evolutions, namely on the tyres used. The usage of high quality and aesthetical attractive tyres has been increasing. A clear sign of that behavior is the continuous increase in Rim size of the used tyres (which are, generally speaking, the high value tyres).
5. New car technologies:
There are continuous technological developments on the car industry, such as the increasingly use of electric, autonomous, connected and shared cars. In this sense, Pirelli is already developing new tyres to adapt and take advantage of these new types of cars. For example, Pirelli has developed specific tyres with higher grip and lower noise for electric cars, while developing an Integrated real time analysis of tyres and car performance for autonomous vehicles.
Shareholder structure
The share capital of Pirelli & C. S.p.A. is 1,904,374,935.66 euros, divided into 1,000,000,000 ordinary shares, all of which with voting rights at Shareholders’ Meetings with no par value. The Company does not hold treasury shares10.
The company’s shareholders structure is presented on Figure 11 - Share Capital
Structure
Figure 12 - Institutional Investors by regionFigure 11.
The main participation is owned by Marco Polo International Italy S.R.L, a company owned by CNRC International Holding HK Ltd., which in turn is a subsidiary of ChemChina, a Chinese state company.
Camfin S.P.A. is an Italian Company that invests mostly in steel and metallurgical
sectors11.
Long-Term Investments Luxembourg S.A. (LTI), owns a percentage of stakes that
it transfers to third parties, under "Repurchase Agreements". The ownership of those Pirelli stocks will be transferred back to LTI when due. Those stocks have voting rights, according to the voting instructions given by LTI.
Source: Company data
Source: Company data Source: Company data
Table 8 - Dividend historySource: Company data
Source: Company data
Source: Company data
Table 9 - Dividend history
12
Name Office
Bai Xinping Non executive director Laura Cioli Non exec. Independent director Tao Haisu
(Chairman) Non exec. Independent director Giovanni Lo Storto Non exec. Independent director
Name Position
Ning Gaoning Non exec. chairman Marco Tronchetti
Provera
Executive Vice Chairman and Chief Executive Officer Yang Xingqiang Non executive director Bai Xinping Non executive director Giorgio Luca Bruno Non executive director
Laura Cioli Non exec. Independent director Domenico De Sole Non exec. Independent director
Zeev Goldberg Non executive director Tao Haisu Non exec. Independent director Marisa Pappalardo Non exec. Independent director Cristina Scocchia Non exec. Independent director Giovanni Tronchetti
Provera Non executive director Fan Xiaohua Non exec. Independent director
Wei Yintao Non exec. Independent director Giovanni Lo Storto Non exec. Independent director Institutional and retail investors represent the owners of stocks traded on the
market. See Figure 12 - Institutional Investors by region
Figure 12 for information by country regarding the institutional investors.
Dividends
On August 31st, 2017 Pirelli’s Board of Directors decided to assume a dividend policy,
aiming to distribute about 40% of the consolidated net income during the years of 2018 to 2020.
Following this decision, 177 million euros were paid in dividends at May 21st, 2018
resulting in a € 0.177 payment by share, as there were 1,000 Million shares on the market at that moment.
This was the first time Pirelli has distributed dividends since 2014, as there were no dividends paid in 2015, 2016, or 2017 following the company’s delisting in 2015. The dividend history of Pirelli is shown in Table 4 - Dividend history
Table 4.
3. Management and Corporate Governance
Governance Structure
Pirelli follows the traditional Governance system, putting the Administration on the center of the decisions. The 15 Members on the Board of Directors are responsible for the business management, having included 8 Independent Directors with the main goal of supervising the company’s activities. There is also a Board of Statutory Auditors, aimed to oversee the administration and compliance with laws and regulation.
The composition of the Board of Directors results from an agreement made between all shareholders, and stands as follows:
- Eight directors appointed by CNRC, including the chairman; - Four directors appointed by Marco Polo International Italy S.R.L;
- Two independent directors jointly nominated by CNCR and Marco Polo International; - One independent minority director.
The current Board was appointed at August 31st, 2017 and has a mandate of three
years.
All eight independent members are qualified under the Legislative Decree 58/1998 (“TUF”).
There are 5 committees responsible of making recommendations, advising and performing analytical functions for the board.
The traditional model of governance under which Pirelli operates is a traditional model that generally allows for the Board to have more power over the company when compared to other models like the Carver or Complementary one. An example of that is the ability to have a role on day-to-day operations or hiring and firing staff.
The Board manages and oversee the company through committees settled along the functional areas (for example, finance and human resources departments).
Executive compensation system
Fiscal year Dividend paid on Ordinary Shares (€/share)1 Dividend paid on Saving Shares (€/share)1,2 Payout Ratio 2011 0.27 0.34 41% 2012 0.32 0.39 40% 2013 0.32 0.39 43% 2014 0.367 0.431 41%
1 – Before Taxes; 2 – Saving shares were converted to ordinary shares in June 2017.
Source: Company data
Table 11 - Directors list1 – Before Taxes; 2 – Saving shares were converted to ordinary shares in June 2017.
Source: Company data
Table 15 - Remuneration committee
Table 16 - Remuneration committee
Source: Company data
Table 14 - Remuneration committeeSource: Company data
Table 12 - Directors list
13
2.9% 3.0% 3.1% 3.2% 3.3% 3.4% 3.5% 3.6% 3.7% 3.8% 3.9%Real GDP growth (Annual percent change)
Inflation rate, end of period consumer prices (Annual percent change)
Figure 29 - GDP and Inflation rates
Figure 30 - GDP and Inflation rates
0 10 20 30 40 50 60 70 Brent 2017 2018 0.0 0.2 0.4 0.6 0.8 1.0 1.2 1.4 1.6 N. R. Buta. 2017 2018
Figure 32 - Raw materials Price (€)
Figure 33 - Raw materials Price (€)
The Board of Directors appoints the remuneration committee that is responsible to annually develop the remunerations plan for the following year (Table 6 -
Remuneration committee Table 6).
There are three components to the company’s remuneration package: gross annual fixed component, variable annual component and variable component of medium/long-term12.
Social Responsibility
Pirelli demonstrates interest and active behavior on matters of social responsibility, especially on matters related to environmental issues. It has been investing in the production of tyres that are environmentally friendly and contributes indirectly by being so connected with the introduction of electric cars.
Pirelli has a contract with the Italian Football team “Inter” that goes behind the sponsorship, as it supports an initiative from the club established in 29 countries that offers an educational opportunity to young children with less money to play football. The company supports several programs in different countries that provide food and shelter for needy families. In several countries, Pirelli supports health services, by providing with medical supplies and making donations to research and voluntary programs. Pirelli also promotes and sponsors environmental initiatives linked to recycling and plantation of trees13.
The company has gained some awards related to social responsibility and environmental awareness, an example of that is the recent nomination by CDP (Carbon Disclosure Project) as a Global Leader in corporate climate action14.
4. Industry Overview and Competitive Positioning
Macroeconomic SummaryAccording to the latest forecasts from IMF published in July 2019, global growth is sluggish, with a forecast of 3.2 for 2019 and 3.5 in 202015. Global economy has been
affected negatively by the economic war between USA and China, with increasing tariffs on certain Chinese products and currency devaluation of the Chinese Yuan. Inflation worldwide has been rising over the past years, reaching 3.3 % in 2018, and is expected to reach 3.7% in 2019.
Europe is an important area for Pirelli, considering that it holds 43% of the 2018’s total revenues. GDP in Europe was 1.7% in 2018 and the projections for 2019 and 2020 are of the same percentage – 1.7% per year.
Raw materials
During 2018 there was an increase in energy price and a decrease in the price of natural rubber.
Production of Tyres requires 3 main Materials16:
- Brent: Sweet light crude oil used for manufacturing, has registered an average price of € 63 per barrel in 2018, an increase from 2017, when it registered an average of € 40 per barrel.
- Natural rubber: Elastic material obtained from trees to produce tyres. Pirelli has been increasing the use of green friendly materials on its products. There was a decrease in its average price between 2017 to 2018 from € 1.4 to € 1.2 per tonne.
- Butadiene: Main component for the production of synthetic rubber, has also decreased in price, standing at an average of € 0.98 per ton in 2018, coming from € 1.07 per tonne in 2017.
Social KPI's 2016* 2017 2018
Headcount at end of year 29,787 30,189 31,489
- % women in managerial positions 20.6% 21.6% 22% - temporary workers 4.8% 4.6% 2.6% Accident Frequency Index 0.33 0.27 0.29 Average number of training days per employee 9.8 8 8.2 Whistleblowing Reports 38 34 70 Number of independent audits on suppliers' sustainability 64 83 85
Table 17 - Social Key Performance Indicators
Table 18 - Social Key Performance Indicators
*Excluding industrial Business
Source: Company data
*Excluding industrial Business
Source: Company data Source: Company data
Source: Company data
Source: International Monetary Fund
Figure 31 - Raw materials Price (€)Source: International Monetary Fund
14
Market value CAGR 2014-18 7.10% Market volume CAGR 2014-18 5.30% Mark. Val. forecast CAGR 2018-23 5.30% Mark. Vol. forecast CAGR 2018-23 5.10%
0% 2% 4% 6% 8% 10% 12% 0 100 200 300 400 500 600 € Billion % Growth
Figure 34 - Global tyre market value
Figure 35 - Global tyre market value
0% 1% 2% 3% 4% 5% 6% 7% 0 100 200 300 400 500 600 700 € Billion % Growth
Figure 36 - Global tyre market value forecast
Figure 37 - Global tyre market shareFigure 38 - Global tyre market value forecast
Figure 39 - Global tyre market share
Figure 40 - Global tyre market share
Automotive Market
There were 78.7 million new cars sold in 2018, registering a minor decrease when compared to 201717, nevertheless, the number of cars in circulation has been
increasing as seen previously in Figure 8
- Passenger cars (stock per 1,000
pop)
Figure 8 - Passenger cars (stock per 1,000 pop)
. The car industry has been developing and continually growing over the years, even resisting recessions. In particular for premium or prestige cars, which are the main target of Pirelli, represented in 2018 12.6% of all cars sold, an increase of 0.8% when compared to 201718.The consistent positive evolution of the automotive industry allows for a safe market demand of tyres.
Tyre Market
According to a report from MarketLine19 that analyses the historical evolution of the tyre market and presents sustained forecasts for the future, the global tyres market had a consistent growth over the past, and is expected to continue this trend at a decelerated pace in the future.
The two regions that contribute to the growth of the market are America and Asia, mainly because those are the regions where the factories are established. Asia tyre companies are mostly mass market and low-cost companies, leading even to a petition launched in 2016 by American and European producers that called for heavier duties on imported Chinese tyres, claiming the Chinese were “dumping” tyres on the world market, affecting the American and European tyres companies. The U.S. International Trade Commission did not apply those increased duties, nevertheless with growing tensions between USA and China, it is possible that the Chinese tyre brands will eventually get barriers for selling on the western world, allowing for the remaining tyre producers to gain market.
According to MarketLine, the tyre market in 2018 had total revenues of € 545,556.61m and registered a CAGR of 7.2% between 2014 and 2018 (Table 8 - Tyre market overview
Table 8).
The performed study concluded that tyres’ sales are correlated with Gross Domestic Product.With inflation maintaining itself at moderate levels and GDP rising, the demand for cars increase, and therefore for tyres as well.
In relation to the volume of sold tyres, there was an increase with a CAGR of 5.3% from 2014 to 2018, reaching a total of 4,415.7 million tyres consumed in 2018. Considering the segment of car tyres, there are 2 main types of tyres: rim size equal or inferior to 17 inches (standard tyres), and rim size equal or superior to 18 inches (premium/high value tyres).
During 2018 there was a positive evolution of the premium tyres market, with an increase of 10% in use when compared to 2017, and a contraction of 1% on the segment of standard tyres.
The premium segment of tyres achieved 15% of the total tyres market in 2018, an evolution from the 14% in 2017.
The main threat for tyre producers is the possible increase in raw materials prices,
which will force the companies to seek out alternative products, such as Pirelli has been doing by gradually increasing the use of natural rubber.
Oil prices have been increasing over the last years, and this will eventually limit the tyre market growth. However, this will be culminated with the increase in GDP worldwide, which will drive the increase in car demand.
Source: Company data
Source: Company data
Table 19 - Tyre market overview
Table 20 - Tyre market overview
Source: MarketLine
Source: MarketLine
Source: MarketLine
15
Source: Company data
Figure 41 - Five Forces Analysis on Pirelli BusinessSource: Company data
15% 14% 10% 6% 4% 4% 3% 3% 41% Bridgestone Michelin Goodyear Continental Pirelli Sumitomo Hankook Yokohama Others 0 1 2 3 4 5 Threat of new entrants Rivalry Bargainin g power of suppliers Bargainin g power of buyers Threat of Substitute s
Figure 42 - Five Forces Analysis on Pirelli Business
Figure 43 - Five Forces Analysis on Pirelli Business
Threat to the business Legend:
1 - Insignificant 2 - Low 3 - Moderate 4 - Significant 5 - High
The overall tyre market is expected to grow at a decelerated rhythm, with forecasts pointing to a CAGR of 5.3% for the next five years (between 2019 to 2023).
Competition
The main competitor for Pirelli is Nokian, a Finnish company specialized in consumer tyres and premium winter tyres. Both Nokian and Pirelli have higher product prices when compared to the remaining players.
Next there are 4 main players on the market that also compete directly with Pirelli - Bridgestone, Michelin, Goodyear and Continental. These four company have no particular focus on a certain type of tyres and produce standard and high value tyres for both consumer and industrial markets.
We can see in Figure 17 - Global tyre market share
Figure 17 the Global market share distribution, where we can notice Pirelli has 4.1% market share.
We present below a table with the general information about all the players on the tyre market. Tier % of tyre sales N.º of players Average EBIT
Margin Focus Company
Low - cost players
Tier 3 28% >150 1-2%
4 11% Full - liners
49%
Tier 1
Global High Value Winter Tyres 18%
2
Tier 2 23% 14 10% Mainly mass - market
Porter’s Five Forces
Threat of new entrants (Low)
There are strong barriers for the entrance of new competitors, particularly in the segment that Pirelli is on. It requires high capital investments to establish factories that can produce in relevant volumes to have profit and generate economies of scale, which are required by the tyre industry. The production of tyres requires for advanced technologies and equipment’s that are expensive.
Another relevant factor is the R&D, especially for tier 1 companies that have already spent significant amounts on R&D, strengthening their products and position.
Pirelli stands as one of the strongest players in terms of tyre technology and development, offering high performance and safe tyres which a new company would not have the knowledge to develop.
Pirelli also stands as an icon in Formula 1 and other relevant automotive competitions, aiding in its brand recognition. Many other competitors have relevant brands that have been built over years of presence and investment.
Rivalry (Significant)
There are over 170 companies performing in the market, however tier 1 covers almost 50% of the market. These companies are leaders in terms of price, quality and offer a wider range of products.
Source: MarketLine
Table 21 - Tyre market competitive overviewSource: MarketLine
Table 22 - Tyre market competitive overview
Table 23 - Tyre market competitive overview
Source: Bridgestone
16
In particular for high value premium tyres, Pirelli stands out, although there is the possibility that other major player in the market start focusing on this segment at any time.
Bargaining power of suppliers (Medium)
Considering the three main products required to produce tyres (oil, synthetic rubber and natural rubber), there is a low number of suppliers in the market. However, the prices will always be volatile as they depend on many other factors.
Bargaining power of buyers (Medium)
For original equipment, the bargain power of buyers is significative, as there are low costs to switch from buyers - sales depend very much on the current automotive market trends and the automobile market is very concentrated on few automakers.
As for replacement products and services, such as technical assistance, garages or retail shops, the bargain power is much lower, as individually they are small size buyers that have no power to negotiate.
Threat of Substitutes (Low)
There is a very limited number of substitutes, as it is virtually impossible to substitute tyres for other similar product. The only relevant threat comes from an increase in the use of public transportation, thus reducing the use of cars.
Strengths
Weaknesses
• Focus on a profitable niche - premium consumer tyres • High debt
• Brand recognition reforced by motorsports presence
• Large market share gap from the main players
• R&D Investment and expertise
• Strong Financial Statements with sustainable growth
Opportunities
Threats
• Technological innovations and advances
• Competitors investing in the same segment
• Evolving costumer and car industry
• Environmental concerns
Source: Analyst
Table 24 - SWOT analysis of PirelliSource: Analyst
Source: Analyst
Table 27 - Investment summarySource: Analyst
Table 25 - SWOT analysis of Pirelli
17
Low Risk Medium
Risk High Risk
BUY >15% >20% >30% HOLD >5% and <15% >10% and <20% >15% and <30% REDUCE >-10% and <5% >-10% and <10% >-10% and <30% SELL <-10% <-10% <-10%
5. Investment Summary
ValuationThe final recommendation is BUY, with a price target of € 6,80 representing an upside potential of 25% for the year end of 2019. We assume that the current
undervaluation derives from performing below the overall goals for 2019, although with still positive results. Our valuation was achieved through the Discounted Cash flow method complemented with Relative Valuation. On both methods, our valuation considered the consolidated statements and the global position of the company.
Company overview
The company is now solely focused on consumer tyres, in particular for high value ones, with no plans for expansion on the near future. Pirelli has been around for 147 years proving its resilience and strategic competence on a very competitive market. The company success is driven by brand recognition and quality products achieved by considerable investments in R&D. We expect the company to perform well in the future as valuable opportunities may rise for high value tyres producers, such as electric and automotive cars that require specialized tyres.
Company’s market overview
The industry overview is positive, with consistent historical growth, and forecasts pointing for a continuous growth of the market for at least the next five years. On a competitive level Pirelli stands next to main peers on the tyres market, although with only a 4% market share, with the main player having around 15%.
Since the IPO in October 2017, Pirelli has shown positive performances, even above the STOXX Europe 600 automobile & Parts (constituted by companies from Europe that operate on the Automobile and Auto parts sector), as seen in Figure 19
- Pirelli
and STOXX Europe 600 Stock price evolution in %
Figure 19
. -30% -20% -10% 0% 10% 20% 30%Pirelli & C. S.p.A. (Borsa Italiana) STOXX Europe 600 Automobiles & Parts
Investment Risks
We consider this to be a medium risk investment considering that the company has registered some deceleration in 2018 when compared to the remaining years, it’s
Figure 45 - Pirelli and STOXX Europe 600 Stock price evolution in %
Figure 46 - Pirelli and STOXX Europe 600 Stock price evolution in %
Source: Company data
Table 33 - Price Target calculationSource: Company data
Table 28 - Investment summary
Table 29 - Investment summary
Source: Analyst
Table 30 - Investment classification matrixSource: Analyst
Source: BPI Risk Matrix
Figure 44 - Pirelli and STOXX Europe 600 Stock price evolution in %Source: BPI Risk Matrix
Table 31 - Investment classification matrix
Table 32 - Investment classification matrix
Date 30-09-2019
Equity value (thousands) 6,796,345 €
Outstanding Shares 1,000,000
Closing Price € 5.43
Price Target DCF € 6.80
Price target Multiples € 6.01
Recommendation Buy
18
vulnerable to the volatility of raw materials and it’s partially owned by a Chinese corporation to which we have no visibility about long term plans for Pirelli. The risk assessment is expanded on chapter 8. Investment Risks.
19
Figure 48 - Pirelli’s Revenues in Billion euros
Figure 49 - Pirelli’s Revenues in Billion euros
Figure 51 - Pirelli and tyre market revenue evolution in %
Figure 52 - Pirelli and tyre market revenue evolution in % 1 2 3 4 5 6 7 Total standard Total high value Revenues (Total) -4% -2% 0% 2% 4% 6% 8% 10%
Tyre market value growth 2016-18 Pirelli's revenue CAGR Pirelli's revenue growth rate Enterprise value (Thou.) € 10,269,213.71
Net debt (Thou.) € 3,472,868.23
Value of equity (Thou.) € 6,796,345.48 N.º shares outstanding 1,000,000
Equity value per share € 6.80
6. Valuation
We will be evaluating Pirelli’s through the Discounted Cash Flow to the Firm method, which will be complemented with a Relative Valuation.
A two-stage model was performed for a 5-year period of forecast, and a terminal value was also considered for the company.
DCF Valuation
Trough the DCF valuation we reached a price target of € 6.8 for the end of 2019, with an upside of 25% from a closing price of € 5.43 on September 30th, 2019.
The Discounted Cash Flow stands as a valuation method that estimates the value of a company or investment analyzing forecasted future cash flows. The objective is to calculate the present value of those future cash flows using a discount rate.
This valuation method allows for an investor to estimate how much money an investment will generate.
There are two main steps to perform a Discounted Cash Flow valuation, which are to forecast and calculate Free Cash Flows to the Firm (FCFF) and apply a discount rate, which will be the Weighted Average Cost of Capital (WACC).
For the DCF Valuation we considered a five-year period forecasted (between 2019 and 2023), complemented with the terminal value.
FCFF are calculated as follow:
FCFF = EBIT * (1 - Marginal Tax Rate) + D&A - Net increase in WC - CapEx
We will consider as relevant historical data the three latest years – 2018, 2017 and 2016 for two reasons:
- Due to the change in the company structure, any comparison between data from the years 2014-2016 would be inaccurate and not meaningful when compared to 2017 and 2018, as it includes the Industrial business numbers. This segment was sold during 2017, and 2016 statements were restated for comparability.
- The results of 2015 are impacted by the fact that the company was going though many changes and was different than what it is today, registering a negative net income of around € 380m, which opposes the growing positive results from previous years and from 2016 onwards.
Forecast Assumptions
The DCF model is most sensitive to the following variables:
Revenues: According to a Pirelli Presentation20, the company expects the total
revenues to increase fairly equally throughout the world, with an expectation to an increase on Premium tyres’ sales in developed countries and a decrease on standard ones. Pirelli’s sales are nowadays composed by 64% of High value tyres, and the forecasts indicate an increase to 67% by the end of 2019.
The car market is also favoring the growth of the high value tyres market, as stated before, and Pirelli plans to continue to focus on Premium tyres supported by investments on R&D and positioning/branding, allowing the company to also increase the prices of its products as planned.
For the revenue’s projections, we considered the company’s forecast for 201921,
consisting of an increase in 2% in revenues. A third party outside of Pirelli supports those forecasts and, analyzing the historical forecasts from the company, we conclude that they are regularly accurate22.
Between 2020 and 2023 we considered an average growth rate between the tyre market forecasts and Pirelli’s revenue CAGR from 2016 to 2018, which amounted to 2.17%. As analyzed before, the tyres market value is expected to increase in the following years. Nevertheless, we have to take in consideration Pirelli’s evolution and
Source: Company data; Analyst
Figure 50 - Pirelli and tyre market revenue evolution in %Source: Company data; Analyst
Source: Company data, MarketLine; Analyst
Figure 53 - Cost of materials used in Billion eurosSource: Company data, MarketLine; Analyst
Table 34 - Price Target calculation
Table 35 - Price Target calculation
Source: Analyst
Figure 47 - Pirelli’s Revenues in Billion eurosSource: Analyst
20
Figure 54 - Cost of materials used in Billion euros
Figure 55 - Cost of materials used in Billion euros 1 2 3 4 5 6 7 2 01 6 2 01 7 2 01 8 2 01 9 F 2 02 0 F 2 02 1 F 2 02 2 F 2 02 3F Revenue
Raw materials and consumables used 1 2 3 4 5 6 7 2 01 6 2 01 7 2 01 8 2 01 9 F 2 02 0 F 2 02 1 F 2 02 2 F 2 02 3F Current Borrowings Non current Borrowings
Figure 56 - Pirelli’s debt in Billions €
Figure 57 - Pirelli’s debt in Billions €
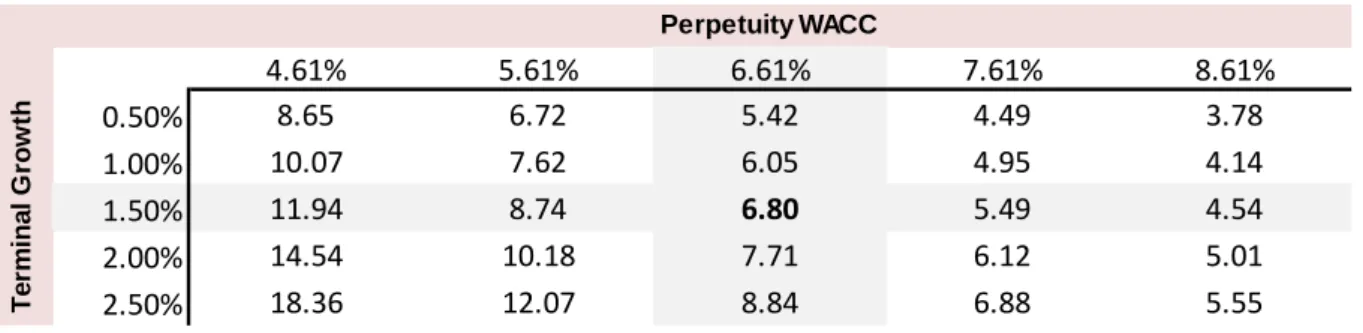
Terminal growth rate 1.50%
Perpetuity WACC 6.61%
Terminal value 11,010,351
PV of terminal value 8,017,025
NPV of FCFF 2,252,189
Enterprise value 10,269,214
position in particular. Looking at the historical data from the market evolution, we can see that the Pirelli’s revenue increased according to the market, except in 2018, when a decrease was noted. Also, Pirelli is mainly focused on consumer High value tyres, so we decided to take a more conservative approach and forecast the revenues evolution considering the market forecast, complemented by the historical evolution of Pirelli.
This approach resulted on revenues increasing between 3.4% to 3.8% from 2020 to
2023 as seen in Figure 21
- Pirelli and tyre market revenue evolution in
%
Figure 21
.Cost of Raw materials: As analyzed before, there has been a general decrease on the price of tyres components except for Brent. Nevertheless, the prices for the main raw materials used, rubber and oil components, are very volatile and not viable to predict. We decided to consider that Pirelli would maintain similar gross margins for the following years, based on the historical information. The gross margin has been very stable on the last 3 years, and based on that, we will consider 68.45% gross margin as our forecast for the future.
Impact from discontinuing operations: Until 2018, it is still visible some loss on net income from discontinued operations. Those are non-recurring events that have been impacting the company, related to the sale of the industrial business in 2016. In 2019 Pirelli is now completely focused on consumer Tyres and following the company’s deals and plans from the last years, there are no plans to expand or decrease the company’s operations.
Operating costs: For all operating costs related to the company’s business, such as utility or personnel expenses, a direct relation to the revenue’s evolution was considered. Each item was individually analyzed, and its forecasted values are calculated based on the weight on total revenues for each year based on historical information.
Debt: The D/E ratio in 2017 and 2018 was 1.07 and 1.04, respectively, which stands as a normal value for mature and well-established companies. Pirelli discloses information on its active debt structure, including its maturity date. Based on historical information, we assumed a minimal value that Pirelli will bear on borrowings, which comes from 2017 where Pirelli registered the lowest amount of borrowings of the last three years – € 4.5b. Considering this minimum amount, we estimated the debt of the company to decrease until 2020, following the available maturity dates, and to maintain stable for the remaining forecasted years. Pirelli has maintained a healthy amount of cash over the last years, consistent financial results and there are no plans for major investments such as expansions, which makes us believe that there will be no need to increase debt levels.
Capital Expenditures and Depreciation & Amortization: As stated before, R&D continues to be relevant for Pirelli’s strategy. It has allowed the company to develop superior tyres in terms of performance and safety, sustaining the company’s position. There are no plans for new factories, but looking at the company history, Pirelli continuously evolves and advances its facilities in order to produce better products and achieve greater margins. Considering the importance of the CAPEX factor for Pirelli, and historical information, we estimate that it will maintain high values, with a slight increase over the years, ranging from € 407m in 2018 to € 445m in 2023.
Depreciation and Amortization rates were calculated based on historical information, as they remain constant.
Net Working Capital: Net Working Capital was calculated summing current assets and liabilities, excluding cash and other financial or non-operational items. It includes other receivables and payables, taxes, inventories and trade receivables and payables. The forecasts for the considered items were made based on historical information and
Source: Company data; Analyst
Source: Company data; Analyst
Source: Company data; Analyst
Table 38 - Free cash Flow ProjectionsSource: Company data; Analyst
Table 36 - Enterprise value calculation in Thousands of euros
Table 37 - Enterprise value calculation in Thousands of euros
Source: Analyst
21
COST OF EQUITY
Risk Free Rate 0.2%
Country Risk Premium 3.1%
Equity risk Premium 5.96%
Beta Unlevered 0.63
Beta levered 1.50
Cost of equity 12.3%
COST OF DEBT
Cost of debt 4.2%
Marginal tax rate 25.0%
After-tax cost of debt 3.1% WACC
Weight of equity 38.1%
Weight of debt 61.9%
WACC 6.61%
individual relation with the forecasted sales. The changes in Net Working Capital were calculated through the forecasted years.
Terminal Value: For mature companies, such as Pirelli, it is expected that the perpetual growth will be below inflation and GDP levels, since there are no plans for expansion or significant changes in production capacity in the future.
Considering that Pirelli sells worldwide with more presence on western countries, it is not realistic to consider the raw global inflation forecasts. We have considered as inflation rate, the forecasted inflation for 202423 weighted by region, considering the
total weight of each region on total revenues, resulting on an Inflation rate of 2.53%. Nevertheless, as stated before, we believe that Pirelli will grow below global Inflation and GDP rates, therefore we will consider a terminal growth rate of 1.5%. This rate is also in accordance to a research from Morgan Stanley24, which indicates the same
terminal growth rate for Pirelli.
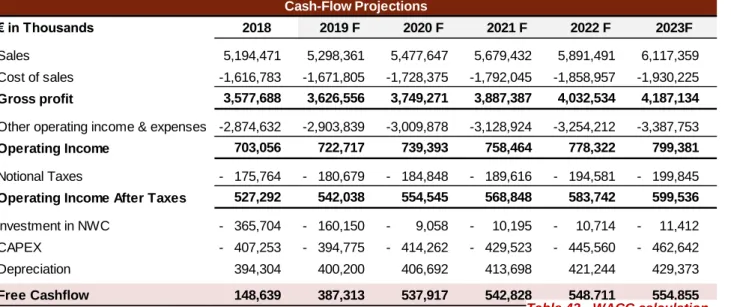
We calculated FCFF based on the forecasts previously stated in this paper, and the results are presented on the table below:
€ in Thousands 2018 2019 F 2020 F 2021 F 2022 F 2023F
Sales 5,194,471 5,298,361 5,477,647 5,679,432 5,891,491 6,117,359
Cost of sales - 1,616,783 - 1,671,805 - 1,728,375 - 1,792,045 - 1,858,957 - 1,930,225
Gross profit 3,577,688 3,626,556 3,749,271 3,887,387 4,032,534 4,187,134
Other operating income & expenses - 2,874,632 - 2,903,839 - 3,009,878 - 3,128,924 - 3,254,212 - 3,387,753
Operating Income 703,056 722,717 739,393 758,464 778,322 799,381
Notional Taxes - 175,764 - 180,679 - 184,848 - 189,616 - 194,581 - 199,845
Operating Income After Taxes 527,292 542,038 554,545 568,848 583,742 599,536
Investment in NWC - 365,704 - 160,150 - 9,058 - 10,195 - 10,714 - 11,412
CAPEX - 407,253 - 394,775 - 414,262 - 429,523 - 445,560 - 462,642
Depreciation 394,304 400,200 406,692 413,698 421,244 429,373
Free Cashflow 148,639 387,313 537,917 542,828 548,711 554,855
Cash-Flow Projections
As a discount rate we used the WACC, which represents the rates of return of both the Company’s debt and equity holders, weighted by the respective participation on the capital structure. The WACC formula is:
𝑊𝐴𝐶𝐶 = 𝐸
𝐸 + 𝐷∗ 𝑟𝐸+ 𝐷
𝐸 + 𝐷∗ 𝑟𝐷∗ (1 − 𝑡) Where:
E = Market Value of firm’s Equity D = Market Value of firm’s Debt 𝑟𝐸 = Cost of equity
𝑟𝐷 = Cost of debt
t = Corporate tax rate
The cost of equity is the rate that reflects the required rate of return paid to investors, that compensate for the risk taken, and was calculated through Capital Asset Pricing Model (CAPM):
r𝐸= 𝑟𝑓+ 𝛽𝐿∗ 𝐸𝑅𝑃 + CRP
Where:
𝑟𝑓 = risk free rate
ERP = Equity Risk Premium 𝛽𝐿 = Levered beta
Table 39 - Free cash Flow Projections
Table 40 - Free cash Flow Projections
Source: Analyst
Table 41 - WACC calculationSource: Analyst
Table 42 - WACC calculation
Table 43 - WACC calculation
Source: Analyst
22
𝐶𝑅𝑃 = 𝐶𝑜𝑢𝑛𝑡𝑟𝑦 𝑅𝑖𝑠𝑘 𝑃𝑟𝑒𝑚𝑖𝑢𝑚
For the Risk Free Rate, we considered the yield of 10 year German bonds, which are recognized as a safe investment, resulting in a risk free rate of 0.24%. We considered 10-year bonds because, according to Frykman and Tolleryd (2003)25, bonds with longer maturity tend to have lower liquidity.
For the BETA, we calculated the average unlevered Beta from similar competitors through information extracted from Bloomberg. We considered the same companies used for the relative valuation resulting in unlevered Beta of 0.63. To achieve the levered Beta of 1.5, we applied the following formula:
𝛽𝑙 = 𝑈𝑛𝑙𝑒𝑣𝑒𝑟𝑒𝑑 𝐵𝑒𝑡𝑎 ( 1 + ((1 − 𝑡𝑎𝑥 𝑟𝑎𝑡𝑒) (𝐷/𝐸 𝑅𝑎𝑡𝑖𝑜) ))
As for the ERP and CRP, we used the values available on Aswath Damodaran’s website, which are 5.96% and 3.06% respectively.
The cost of debt reflects the effective rate at which a company can borrow or lend money.
We used the average cost of debt of the Rubber & Tires industry available on Aswath Damodaran’s website, which is 4.18%. The corporate Tax rate disclosed on the annual report of 2018 was 25%.
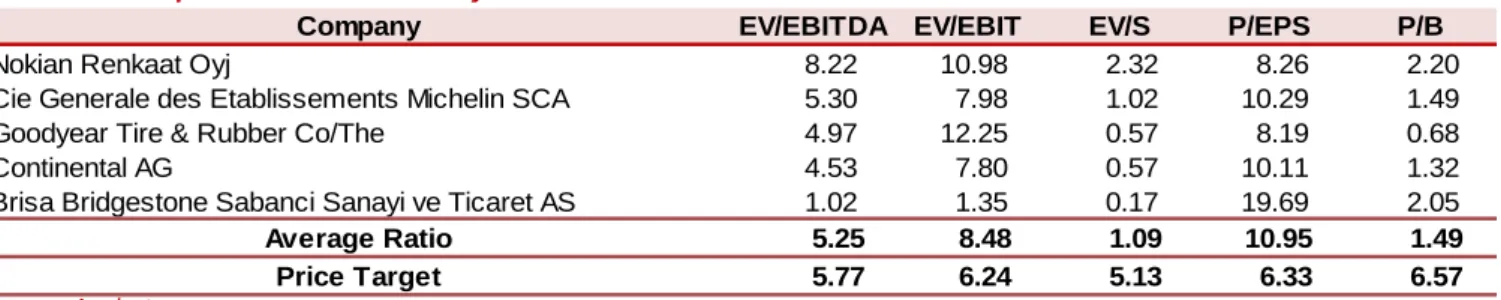
Multiples Valuation
A relative valuation was also performed to support the DCF method and compare the results. Using this methodology, we achieved a final price Target of € 6.01, with an upside potential of 11%, supporting that the company is currently undervalued on the market.
Considering that all companies have different structures, strategies and act differently on the market, we used for the relative valuation the average Price Targets from companies that are similar and comparable to Pirelli.
The peers used for the relative valuation are the five main international tyre companies that stand as the main competitors for Pirelli and are also the only companies on the market that act on the same segment - high-value consumer tyres. Most of the remaining players act on mass market segments without a line of high value tyres or have other rubber business. (See Appendix L)
For the relative valuation we considered five ratios, three based on Enterprise value, and the remaining on Price multiples. The peer data used for the calculations was extracted from BBG, and when possible, we used Bloomberg forecasts for 2019.
7. Financial Analysis
Profit and loss
Gross profit has increased from 2016 to 2017, whilst there was a decrease in 2018 due to a sales decrease, reaching the value of € 3.577B. For 2019, revenues are expected to increase again hitting € 3.626B, continuing that trend for the remaining forecasted years and reaching a value of € 4.187B in 2023. The costs of materials will also increase, although at a lower rate than the increase on sales explained by increased efficiency, technology and scale economies by Pirelli. The forecasted increase on
Table 47 - Multiples valuation Summary
Table 48 - Multiples valuation Summary
Source: Analyst
Figure 58 - Pirelli’s EBITDA in Million eurosSource: Analyst
Average ratio of Peers - Price Multiples: Peers Price Target
Price to Earnings per share 11.31 6.33 Price to Book 1.55 6.57
Average Price Target: 6.45
Average from Peers on EV Multiples:
Ratio Price Target
EV/Sales 1.12 5.77 EV/EBITDA 5.75 6.24 EV/EBIT 9.75 5.13
Average Price Target: 5.71
Relative Valuation: 6.01 Upside Potential 10.64%
Table 44 - Relative valuation Output
Table 45 - Relative valuation Output
Source: Analyst
Table 46 - Multiples valuation SummarySource: Analyst
Company EV/EBITDA EV/EBIT EV/S P/EPS P/B
Nokian Renkaat Oyj 8.22 10.98 2.32 8.26 2.20
Cie Generale des Etablissements Michelin SCA 5.30 7.98 1.02 10.29 1.49
Goodyear Tire & Rubber Co/The 4.97 12.25 0.57 8.19 0.68
Continental AG 4.53 7.80 0.57 10.11 1.32
Brisa Bridgestone Sabanci Sanayi ve Ticaret AS 1.02 1.35 0.17 19.69 2.05
Average Ratio 5.25 8.48 1.09 10.95 1.49 Price Target 5.77 6.24 5.13 6.33 6.57