Market Timing and Capital Structure
MALCOLM BAKER and JEFFREY WURGLER*
ABSTRACT
It is well known that firms are more likely to issue equity when their market values are high, relative to book and past market values, and to repurchase equity when their market values are low. We document that the resulting effects on capital structure are very persistent. As a consequence, current capital structure is strongly related to historical market values. The results suggest the theory that cap-ital structure is the cumulative outcome of past attempts to time the equity market.
IN CORPORATE F INANCE, “equity market timing” refers to the practice of issuing shares at high prices and repurchasing at low prices. The intention is to exploit temporary f luctuations in the cost of equity relative to the cost of other forms of capital. In the efficient and integrated capital markets stud-ied by Modigliani and Miller~1958!, the costs of different forms of capital do not vary independently, so there is no gain from opportunistically switching between equity and debt. In capital markets that are inefficient or seg-mented, by contrast, market timing benefits ongoing shareholders at the expense of entering and exiting ones. Managers thus have incentives to time the market if they think it is possible and if they care more about ongoing shareholders.
In practice, equity market timing appears to be an important aspect of real corporate financial policy. There is evidence for market timing in four different kinds of studies. First, analyses of actual financing decisions show that firms tend to issue equity instead of debt when market value is high, relative to book value and past market values, and tend to repurchase equity when market value is low.1 Second, analyses of long-run stock returns
fol-* Baker is from the Harvard University Graduate School of Business Administration. Wurgler is from the New York University Stern School of Business. We thank Arturo Bris, John Campbell, Paul Gompers, Roger Ibbotson, Andrew Roper, Geert Rouwenhorst, Geoff Verter, Ralph Walkling, participants of seminars at Columbia, Cornell, Duke, Harvard, INSEAD, MIT, Northwestern, NYU, Rutgers, Stanford, University of Chicago, University of North Carolina at Chapel Hill, University of Notre Dame, Wharton, and Yale, and especially Richard Green, Andrei Shleifer, Jeremy Stein, Ivo Welch, and an anonymous referee for helpful comments. We thank John Graham and Jay Rit-ter for data and Alok Kumar for research assistance. Baker gratefully acknowledges the financial support of the Division of Research of the Harvard Graduate School of Business Administration.
1Seasoned equity issues coincide with high valuations in Taggart~1977!, Marsh~1982!, Asquith
and Mullins~1986!, Korajczyk, Lucas, and McDonald~1991!, Jung, Kim, and Stulz~1996!, and Hovakimian, Opler, and Titman~2001!. Initial public equity issues coincide with high valuations in Loughran, Ritter, and Rydqvist~1994!and Pagano, Panetta, and Zingales~1998!. Repurchases coincide with low valuations in Ikenberry, Lakonishok, and Vermaelen~1995!.
THE JOURNAL OF FINANCE • VOL. LVII, NO. 1 • FEB. 2002
lowing corporate finance decisions suggest that equity market timing is suc-cessful on average. Firms issue equity when the cost of equity is relatively low and repurchase equity when the cost is relatively high.2Third, analyses of earnings forecasts and realizations around equity issues suggest that firms tend to issue equity at times when investors are rather too enthusiastic about earnings prospects.3Fourth, and perhaps most convincing, managers admit to market timing in anonymous surveys. Graham and Harvey~2001!
find that two-thirds of CFOs agree that “the amount by which our stock is undervalued or overvalued was an important or very important consider-ation” in issuing equity, and nearly as many agree that “if our stock price has recently risen, the price at which we can sell is ‘high’”~p. 216!. In that survey as a whole, equity market prices are regarded as more important than 9 out of 10 other factors considered in the decision to issue common stock, and more important than all 4 other factors considered in the decision to issue convertible debt.
In this paper, we ask how equity market timing affects capital structure. The basic question is whether market timing has a short-run or a long-run im-pact. One expects at least a mechanical, short-run imim-pact. However, if firms subsequently rebalance away the inf luence of market timing financing de-cisions, as normative capital structure theory recommends, then market tim-ing would have no persistent impact on capital structure. The significance of market timing for capital structure is therefore an empirical issue.
Our results are consistent with the hypothesis that market timing has large, persistent effects on capital structure. The main finding is that low leverage f irms are those that raised funds when their market valuations were high, as measured by the market-to-book ratio, while high leverage firms are those that raised funds when their market valuations were low. We document this in traditional capital structure regressions. Leverage is the dependent variable and the “external finance weighted-average” market-to-book ratio is the independent variable. This variable is a weighted average of a firm’s past market-to-book ratios which, for example, takes high values for firms that raised their external finance—equity or debt—when their market-to-book ratios were high. The basic regression result is that leverage is strongly negatively related to this measure of historical market valuations.
2Net of adverse announcement effects, equity issuers have low subsequent ~idiosyncratic!
returns in Stigler~1964!, Ritter~1991!, Loughran and Ritter~1995!, Speiss and Aff leck-Graves
~1995!, Brav and Gompers~1997!, and Jegadeesh~2000!, and high market-to-book issuers earn even lower returns. Repurchasers have high~idiosyncratic!returns in Ikenberry et al.~1995!, and low market-to-book repurchasers earn even higher returns. Not all authors interpret these results as successful market timing: Eckbo, Masulis, and Norli~2000!interpret the firm-level results as ref lecting low risk of equity issuers, and Fama~1998!challenges the firm-level re-sults on several grounds. A high share of equity issues in aggregate equity and debt issues also forecasts low~market!returns in Baker and Wurgler~2000!. This market-level evidence goes the same direction as the firm-level evidence and avoids some of the methodological difficulties endemic to the firm-level studies.
3See Loughran and Ritter~1997!, Rajan and Servaes~1997!, Teoh, Welch, and Wong~1998a,
1998b!, and Denis and Sarin~2001!.
The inf luence of past market valuations on capital structure is economi-cally significant and statistieconomi-cally robust. The relationship is apparent whether leverage is measured in book or market values or whether various control variables are included. The inf luence of past market valuations on capital structure is also quite persistent. We document this persistence in three separate ways. A first test uses leverage regressions that control for the current market-to-book. This leaves the weighted average to pick up only the within-firm time-series variation. The fact that this variation helps to explain capital structure outcomes implies that temporary f luctuations in market valuations can lead to permanent changes in capital structure. A second test for persistence is in regressions that control for the initial cap-ital structure level and look at how subsequent f luctuations in market val-uations move capital structure away from this initial level. A third test for persistence is to look at the power of lagged values of the weighted average market-to-book variable. The impact of past market values turns out to have a half-life of well over 10 years.For example, capital structure as of the year 2000 depends strongly upon variation in the market-to-book ratio from 1990 and before, even controlling for the 1999 value of market-to-book.
The bottom line is that f luctuations in market value have very long-run impacts on capital structure. It is hard to explain this result within tradi-tional theories of capital structure. In the trade-off theory, market-to-book is an indicator of investment opportunities, risk, agency, or some other deter-minant of the optimal leverage ratio. The trade-off theory predicts that tem-porary f luctuations in the market-to-book ratio or any other variable should have temporary effects. The evidence indicates that the market-to-book ratio has very persistent effects, however. In the pecking order theory of Myers
~1984!, adverse selection leads managers to avoid issuing equity entirely. A dynamic version predicts that firms with upcoming investment opportuni-ties may reduce leverage to avoid issuing equity in the future. Nevertheless, it is hard to imagine a version of the pecking order theory that explains the observed strong relationship between leverage and the long-past pattern of investment opportunities. The standard version implies that periods of high investment will push leverage higher toward a debt capacity, not lower as our results suggest. In the managerial entrenchment theory of capital struc-ture in Zwiebel~1996!, high market valuations allow managers to add equity but also allow them to become entrenched, resisting the debt finance neces-sary to restore debt to the optimum. While generally consistent with our evidence, this theory has managers exploiting existing investors ex post by not rebalancing with debt. The prior studies of earnings management evi-dence and long-run returns suggest that managers aim to exploit new investors. In our opinion, a simple and realistic explanation for the results is that capital structure is the cumulative outcome of attempts to time the equity market. This is a simple theory of capital structure. To our knowledge, it has not been articulated before.
managers and investors. The extent of adverse selection varies across firms or across time and is inversely related to the market-to-book ratio. The sec-ond version is that managers think investors are irrational and raise equity when the cost of equity is unusually low. This story explains the results if variation in the market-to-book ratio is a proxy for managers’ perceptions of misvaluation. To explain the persistent empirical effect of past valuations, both versions require that adjustment costs, perhaps related to adverse se-lection, reduce the desirability of undoing market timing. Our results do not discriminate between these two versions of market timing, but the earnings management evidence and the long-run return evidence points to the second. The rest of the paper is organized as follows. Section I investigates the relationship between capital structure and the historical path of the market-to-book ratio. Section II discusses the results. Section III concludes. Addi-tional robustness tests are included in the Appendix.
I. Capital Structure and Past Market Valuations
Prior research documents that individual f inancing decisions depend on market-to-book. Here we document the cumulative effect of the history of market-to-book ratios on capital structure. The main questions here are whether market-to-book affects capital structure through net equity issues, as market timing implies, and whether market-to-book has persistent effects that help to explain the cross section of leverage.
A. Data and Summary Statistics
Our main sample consists of COMPUSTAT firms for which we could de-termine the IPO date. Knowing the IPO date allows us to examine the be-havior of leverage around the IPO, which is itself an important financing decision that is known to be related to the market-to-book ratio. Knowing the IPO date also allows us to study the evolution of leverage from a fixed starting point.
We typically study this sample in IPO time, meaning that we study it in subsamples that hold the number of years since the IPO constant. The whole sample includes 2,839 observations on firms at the first fiscal year end after IPO, 2,652 observations on firms in the next fiscal year~which we refer to as subsample IPO⫹1!, et cetera, down to 715 observations on firms at 10 years after the IPO~subsample IPO⫹10!. The steady attrition in IPO time is due to merger, bankruptcy, the end of all data in 1999, and other circumstances that cause an exit from COMPUSTAT. To be clear, each IPO⫹k subsample includes only firms that have survived k years from the IPO.
Panel A of Table I summarizes leverage and financing for this sample. We define book debt as total assets ~COMPUSTAT Annual Item 6! minus book equity. We define book equity as total assets less total liabilities~Item 181!
and preferred stock~Item 10!plus deferred taxes~Item 35!and convertible debt~Item 79!. When preferred stock is missing, it is replaced with the re-demption value of preferred stock ~Item 56!. Book leverage is then defined as book debt to total assets. We drop firm-year observations where the re-sulting book leverage is above one.4We define market leverage as book debt divided by the result of total assets minus book equity plus market equity. Market equity is defined as common shares outstanding ~Item 25! times price~Item 199!. These definitions follow Fama and French~2000!. The book leverage in the year prior to the IPO, which we call the pre-IPO value, is often available in COMPUSTAT.
Using the identity that book equity equals balance sheet retained earn-ings plus paid-in share capital, we define net equity issues~e0A!as the change in book equity minus the change in balance sheet retained earnings ~Item 36! divided by assets. We define newly retained earnings ~⌬RE0A! as the change in retained earnings divided by assets. We define net debt issues
~d0A!as the residual change in assets divided by assets.5
Table I shows that, not surprisingly, book leverage decreases sharply fol-lowing the IPO. Over the next 10 years, it rises slightly, while market value leverage rises more strongly. The book leverage trend is indeed an age effect, not a survival effect; the book leverage ratio for the subsample of firms that survive 10 years rises by a similar five percentage points~not reported!. In terms of financing activity, the most notable result is the sharp switch to debt finance in the year following the IPO. This marks the transition to a
4The number of observations dropped depends on the sample being analyzed. In book
val-ues, this limit on leverage drops 47 firms from the IPO⫹1 sample and 28 firms in the IPO⫹
10 sample. Because market value cannot be less than zero, market leverage is never greater than one, so this limit has no effect on the market leverage samples.
5We have also defined equity and debt issues using cash f low statement data. Equity issues
are the sale of common and preferred stock ~Item 108! minus the purchase of common and preferred stock~Item 115!, and debt issues are long-term debt issuance~Item 111!minus long-term debt reduction~Item 114!plus changes in current debt~Item 301!. This made little dif-ference to any of the results that follow. We prefer the balance sheet measures, because the statement of cash f lows data is missing more often and start in 1971. The balance sheet mea-sures are missing less often and are available for all COMPUSTAT firm-years.
Table I
Summary Statistics of Capital Structure and Financing Decisions
Means and standard deviations of leverage and components of the change in assets. Book value leverage is book debt to assets and is expressed in percentage terms. In this and following tables, we drop firm-year observations where book leverage is above one. Market value leverage is book debt divided by the result of total assets minus book equity plus market equity and is expressed in percentage terms. Net equity issues~e0A!are defined as the change in book equity, minus the change in retained earnings, divided by assets. Newly retained earnings~⌬RE0A!are defined as the change in retained earnings divided by assets. Net debt issues~d0A!are defined as the residual change in assets divided by assets. The sample includes firm-year observations that satisfy data availability, nonfinancial industry, asset, and market-to-book screens. Panel A shows data in years relative to the IPO for firms with a known IPO date. Panel B shows data in calendar time for all COMPUSTAT firms.
Book LeverageD0At% Market LeverageD0At% d0At% e0At % ⌬RE0At%
Year N Mean S.D. Mean S.D. Mean S.D. Mean S.D. Mean S.D.
Panel A: IPO Time
Pre-IPO 2,281 66.54 ~21.33!
IPO 2,839 43.17 ~21.41! 27.18 ~20.48! 0.35 ~20.89! 32.98 ~23.50! 9.17 ~19.08! IPO⫹1 2,652 45.04 ~21.80! 32.78 ~23.24! 10.84 ~15.97! 6.64 ~14.56! 2.68 ~13.98! IPO⫹3 2,412 46.88 ~21.44! 40.30 ~26.15! 5.78 ~16.22! 3.93 ~13.02! 1.03 ~14.90! IPO⫹5 1,668 47.00 ~20.99! 43.82 ~26.59! 3.53 ~15.33! 3.07 ~11.28! 1.10 ~14.52! IPO⫹10 715 48.68 ~20.20! 43.73 ~24.85! 4.32 ~15.37! 2.44 ~9.28! 1.21 ~13.62!
Panel B: Calendar Time, All Firms
1970–1974 4,399 47.22 ~17.92! 51.11 ~22.79! 4.84 ~11.91! 0.98 ~4.67! 3.34 ~6.57! 1975–1979 5,526 49.11 ~17.49! 54.60 ~22.27! 4.58 ~12.38! 0.66 ~3.79! 4.09 ~6.77! 1980–1984 5,568 49.71 ~19.01! 50.21 ~23.84! 3.45 ~13.54! 1.70 ~6.77! 2.78 ~9.01! 1985–1989 6,441 49.44 ~20.96! 45.27 ~24.31! 3.97 ~17.51! 2.11 ~9.68! 1.22 ~12.31! 1990–1994 7,977 48.98 ~20.89! 43.49 ~24.69! 2.18 ~15.40! 2.54 ~10.43! 0.73 ~13.56! 1995–1999 11,165 49.01 ~21.24! 40.22 ~24.83! 4.54 ~20.21! 3.54 ~13.43! 0.32 ~15.77!
6
The
Journal
of
steady pattern in average financing activity. Note that, under our defini-tions for financing activity, the change in assets is equal to the sum of net debt issues, net equity issues, and newly retained earnings. The table shows that on average, following the IPO, the annual change in assets is driven roughly 50 percent by net debt issues, 35 percent by net equity issues, and 15 percent by newly retained earnings. This is a broad generalization that hides wide cross-sectional variation, however, and indeed the change in as-sets is often negative.
For comparison with the IPO sample, Panel B studies the full 1970 to 1999 COMPUSTAT sample. This All Firms sample does not impose the known-IPO-date selection criterion. To be clear, the All Firms sample is a pooled firm-calendar year sample that contains multiple observations on the same firm and is analyzed as a single whole, not in subsamples that condition on survival; in contrast, the IPO⫹ksubsamples contain one observation perk-year-surviving firm. The All Firms sample also excludes financial firms, firms with missing data on assets or low book values, and individual firm-year outliers. Recent calendar trends in this sample include a decrease in market leverage, an in-crease in equity issues, and a dein-crease in internal finance. The dein-crease in mar-ket leverage ref lects the historically high marmar-ket valuations prevailing at the end of the 1990s. The concurrent increase in equity issues is suggestive of mar-ket timing. These trends also ref lect the many newly public firms that appear near the end of the COMPUSTAT sample in 1999.
B. Determinants of Annual Changes in Leverage
Prior evidence on equity market timing notwithstanding, the net effect of to-book on changes in leverage is not obvious. Firms with high market-to-book ratios are often growing quickly and may be issuing as much debt as equity, for instance. Here we document the net effect of market-to-book on the annual change in leverage. Then we decompose the change in leverage to examine whether the effect comes through net equity issues, as market tim-ing implies.
Our main focus is on market-to-book, but to round out a benchmark set of control variables, we also use three other variables that Rajan and Zingales
tention of earnings in a Modigliani and Miller environment, or from the tax-advantaged retention of earnings in a more realistic tax environment. Yet another hypothesis is that profitable firms face more free cash f low problems, in which case effective governance might call for more leverage
~Jensen ~1986!!. Profitability is defined as earnings before interest, taxes, and depreciation~Item 13!divided by total assets and expressed in percent-age terms. Size may increase leverpercent-age if large firms are less likely to enter financial distress. It is measured as the log of net sales ~Item 12!.
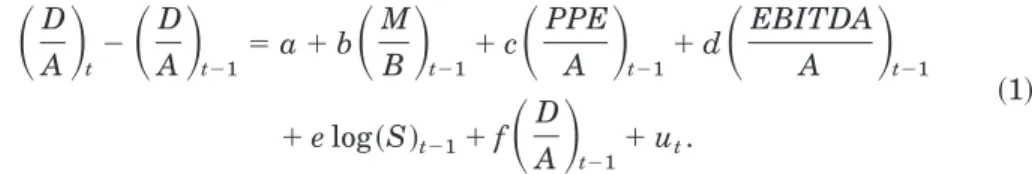
Table II explores the effects of these variables on annual changes in book leverage.
冉
D A冊
t⫺冉
D
A
冊
t⫺1⫽a⫹b冉
MB
冊
t⫺1⫹c冉
PPEA
冊
t⫺1⫹d冉
EBITDA
A
冊
t⫺1⫹elog~S!t⫺1⫹f
冉
DA
冊
t⫺1⫹ut.~1!
We run this regression in IPO time on the IPO sample. For example, the IPO row in Panel A denotes the change in leverage between the pre-IPO value and the end of the IPO year; the IPO⫹1 row denotes the change in leverage from the end of the IPO year to the end of the IPO⫹1 year; et cetera. The last vari-able, lagged leverage, is included because leverage is bounded between zero and one. When leverage is near one of these boundaries, the change in lever-age can only go in one direction, regardless of the values of the other variables. Not controlling for lagged leverage may obscure the effects of the other vari-ables. Lagged leverage therefore enters with a negative sign~not reported!.
The more interesting results are as follows. The net effect of high market-to-book is to lower leverage. At IPO⫹3, a one standard deviation increase in market-to-book is associated with a 1.14 percentage-point decrease in le-verage. This is consistent with the idea that firms increase equity when market valuations are high, but it does not rule out a channel through higher retained earnings or lower debt, for example. The other columns show that tangible assets tend to increase leverage~by 0.69 percentage points per stan-dard deviation increase!, profitability tends to reduce leverage ~by 1.40 per-centage points per standard deviation increase!, and size tends to increase leverage ~by 0.95 percentage points per standard deviation increase!.6 The results are generally consistent with theoretical priors. Fama–MacBeth calendar-time regressions on the All COMPUSTAT Firms sample yield no new conclusions and are omitted to save space.
6The comparative statics in this paragraph are computed with the coefficients in the
IPO⫹3 row in Panel A of Table II and the sample standard deviations of the independent variables.⫺1.14⫽ ⫺0.93*1.23 where 1.23 is the standard deviation of lagged market-to-book at IPO⫹3. 0.69⫽0.03*23.01 where 23.01 is the standard deviation of lagged asset tangibility in percentage terms at IPO⫹3.⫺1.40⫽ ⫺0.10*14.02 where 14.02 is the standard deviation of lagged profitability in percentage terms at IPO⫹3. 0.95⫽0.69*1.37 where 1.37 is the standard deviation of lagged log sales at IPO⫹3.
The other panels in Table II show how the change in leverage comes about. The change in leverage can be decomposed as follows:
冉
D A冊
t⫺冉
D
A
冊
t⫺1⫽ ⫺冋冉
EA
冊
t⫺冉
E
A
冊
t⫺1册
⫽ ⫺
冉
eA
冊
t⫺
冉
⌬REA
冊
t⫺
冋
Et⫺1冉
1At
⫺ 1
At⫺1
冊册
.~2!
Equation~2!divides the change in leverage into equity issues, retained earn-ings, and the residual change in leverage, which depends on the total growth in assets from the combination of equity issues, debt issues, and newly re-tained earnings. In the bottom three panels in Table II, we regress each of these three components of changes in leverage on the market-to-book ratio and the other independent variables. This allows us to determine whether market-to-book affects leverage through net equity issues, as market timing implies.
The results indicate that the effect of market-to-book on changes in lever-age does indeed come through net equity issues. Panel B shows that higher market-to-book is associated with higher net equity issues, consistent with the results of Marsh~1982!and others~note the sign of the dependent vari-able!. Panel C shows that market-to-book is not strongly related to retained earnings, ruling out the possibility that market-to-book affects leverage be-cause it forecasts earnings. Panel D shows that market-to-book is positively related to growth in assets, an effect that tends to increase leverage. This ref lects the total effect of market-to-book on net equity issues, net debt is-sues, and newly retained earnings.7 By equation ~2!, the sum of the coeffi-cients in Panels B, C, and D is equal to the total effect in Panel A. The clear result is that market-to-book affects leverage through net equity issues.
The other columns of Table II report results for asset tangibility, profit-ability, and size. Two interesting patterns are worth noting. First, the effect of profitability on changes in leverage arises primarily because of retained earnings. Profitable firms issue less equity, but this effect is more than off-set by higher retained earnings, so that the net effect of higher profits is to reduce leverage. Second, firm size plays an important role at the time of the
7The coefficient in Panel D is positive, for the most part, because increasing the ratio of net
equity issues to assets does not reduce leverage one for one. The derivative of the debt to assets ratio with respect to the ratio of net equity issues to assets is
d
d
冉
e A冊
t冋
Dt At册
⫽ d
d
冉
e A冊
t冤
Dt
At⫺1⫹
冉
e A
冊
tAt⫹
冉
⌬REA
冊
t At⫹冉
d A
冊
tAt
冥
⫽ ⫺DtAt
.
Increasing the ratio of net equity issues to assets byetherefore reduces leverage only byDe0A.
Table II
Determinants of Annual Changes in Leverage and Components
OLS regressions of changes in book leverage and its components on the market-to-book ratio, fixed assets, profitability, firm size, and lagged leverage.
冉
D A冊
t⫺
冉
DA冊
t⫺1⫽ ⫺
冉
etAt
冊
⫺
冉
⌬AREtt
冊
⫺
冋
Et⫺1冉
1 At⫺A1
t⫺1
冊册
⫽a⫹b
冉
MB
冊
t⫺1⫹c
冉
PPEA
冊
t⫺1⫹d
冉
EBITDAA
冊
t⫺1⫹elog~S!t⫺1⫹f
冉
D A冊
t⫺1⫹ut.
We do not reportaandf. Book value leverage is book debt to assets and is expressed in percentage terms. The market-to-book ratio is assets minus book equity plus market equity all divided by assets and is measured at timet⫺1 except for the IPO year, when it is measured at timet. We drop firm-year observations where market-to-book is above 10. Fixed assets intensity is defined as net property, plant, and equipment divided by assets. Profitability is defined as operating income before depreciation, divided by assets. Firm size is defined as the log of net sales. The total change in leverage is in Panel A. The net equity issues component is in Panel B. The newly retained earnings component is in Panel C. The growth in assets component is in Panel D. Robustt-statistics are in parentheses.
M0Bt⫺1 PPE0At⫺1% EBITDA0At⫺1% log~S!t⫺1
Year N b t~b! c t~c! d t~d! e t~e! R2
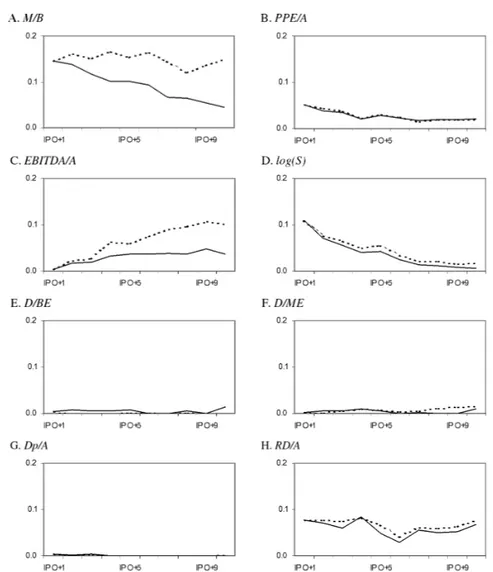
Panel A: Change in Book Leverage~⌬~D0A!t!%
IPO 2,281 ⫺3.70 ~⫺11.81! 0.04 ~2.50! ⫺0.10 ~⫺3.84! 3.83 ~14.65! 0.45 IPO⫹1 2,652 ⫺1.21 ~⫺5.65! 0.04 ~3.78! ⫺0.16 ~⫺6.33! 0.22 ~1.24! 0.12 IPO⫹3 2,412 ⫺0.93 ~⫺4.47! 0.03 ~2.79! ⫺0.10 ~⫺4.26! 0.69 ~4.31! 0.08 IPO⫹5 1,668 ⫺0.03 ~⫺0.10! 0.04 ~3.89! ⫺0.11 ~⫺3.22! 0.89 ~5.09! 0.06 IPO⫹10 715 ⫺1.80 ~⫺2.75! 0.04 ~2.20! ⫺0.02 ~⫺0.28! 0.12 ~0.41! 0.09
10
The
Journal
of
Panel B: Change in Book Leverage Due to Net Equity Issues~⫺~e0At!!%
IPO 2,281 ⫺5.33 ~⫺13.58! 0.05 ~2.55! 0.10 ~2.89! 4.98 ~18.10! 0.27 IPO⫹1 2,652 ⫺3.44 ~⫺11.76! ⫺0.02 ~⫺1.55! 0.31 ~8.82! 0.96 ~4.93! 0.18 IPO⫹3 2,412 ⫺3.69 ~⫺10.87! ⫺0.01 ~⫺1.05! 0.25 ~6.26! 0.96 ~3.80! 0.17 IPO⫹5 1,668 ⫺3.14 ~⫺6.49! 0.01 ~0.54! 0.20 ~3.68! 0.73 ~3.00! 0.14 IPO⫹10 715 ⫺3.56 ~⫺4.41! ⫺0.02 ~⫺1.22! 0.25 ~2.46! 0.39 ~1.34! 0.20
Panel C: Change in Book Leverage Due to Newly Retained Earnings~⫺~⌬RE0At!!%
IPO 2,281 0.20 ~0.59! 0.02 ~1.71! ⫺0.27 ~⫺7.14! 0.81 ~4.24! 0.12 IPO⫹1 2,652 ⫺0.18 ~⫺0.80! 0.01 ~0.63! ⫺0.59 ~⫺16.19! ⫺0.97 ~⫺5.24! 0.37 IPO⫹3 2,412 ⫺0.20 ~⫺0.54! 0.03 ~2.23! ⫺0.54 ~⫺12.24! ⫺0.31 ~⫺1.33! 0.25 IPO⫹5 1,668 ⫺0.51 ~⫺0.77! 0.01 ~0.89! ⫺0.45 ~⫺5.83! ⫺0.15 ~⫺0.53! 0.17 IPO⫹10 715 ⫺0.37 ~⫺0.41! 0.05 ~2.44! ⫺0.56 ~⫺5.20! ⫺0.76 ~⫺1.75! 0.26
Panel D: Change in Book Leverage Due to Growth in Assets~⫺Et⫺1~10At⫺10At⫺1!!%
IPO 2,281 1.44 ~6.68! ⫺0.02 ~⫺2.91! 0.07 ~3.24! ⫺1.96 ~⫺12.79! 0.46 IPO⫹1 2,652 2.41 ~9.33! 0.05 ~4.70! 0.12 ~3.31! 0.24 ~1.15! 0.16 IPO⫹3 2,412 2.84 ~9.82! 0.01 ~0.69! 0.18 ~5.59! 0.16 ~0.65! 0.13 IPO⫹5 1,668 2.70 ~6.50! 0.00 ~0.34! 0.25 ~4.78! 0.47 ~2.00! 0.20 IPO⫹10 715 1.77 ~3.84! 0.01 ~0.30! 0.29 ~3.63! 0.66 ~2.06! 0.17
Market
T
iming
and
Capital
Structure
IPO. Panel A shows that the reduction in leverage that occurs at the IPO is much smaller for large firms. Panel B shows that this is because large firms issue less equity as a percentage of assets.
C. Determinants of Leverage
We have established that market-to-book affects leverage, in the short run, mainly through net equity issues. Whether or not this helps us to un-derstand the cross section of leverage depends on persistence. Market timing could be just a local opportunism whose effect is quickly rebalanced away. Alternatively, if managers do not rebalance to some target leverage ratio, market timing may have persistent effects, and historical valuations will help to explain why leverage ratios differ. Whether one or the other alter-native holds is an empirical question, which we address here.
We regress leverage on the Rajan and Zingales ~1995! control variables and a variable that summarizes the relevant historical variation in market valuations. This is the “external finance weighted-average” market-to-book ratio. For a given firm-year, it is defined as
冉
MB
冊
efwa,t⫺1⫽s(
⫽0 t⫺1 es⫹ds
(
r⫽0 t⫺1
er⫹dr
{
冉
M B冊
s, ~3!
where the summations are taken starting at the IPO year ~or, in the All COMPUSTAT Firms sample, from the first year of COMPUSTAT data where stock price data are not missing!, andeandddenote net equity and net debt issues, respectively, as defined earlier.
This variable takes high values for firms that raised external finance when the market-to-book ratio was high and vice-versa. The intuitive motivation for this weighting scheme is that external financing events represent prac-tical opportunities to change leverage. It therefore gives more weight to val-uations that prevailed when significant external financing decisions were being made, whether those decisions ultimately went toward debt or equity. This weighted average is better than a set of lagged market-to-book ratios because it picks out, for each firm, preciselywhichlags are likely to be the most relevant.
For purposes of computing this variable, we set the minimum weight to zero. We also drop firm-year observations where the resulting M0Befwa ex-ceeds 10.0.8 The purpose of not allowing negative weights is to ensure that we are forming a weighted average. Otherwise the weights might not be increasing in the total amount of external finance raised in each period, which would eliminate the intuition that the weights correspond to times
8The number of observations dropped depends on the sample being analyzed. In book
le-verage, this limit on market-to-book drops 27 firms in the IPO⫹1 tests and 1 firm in the IPO⫹
10 tests. We report results without this limit in a robustness check.
when capital structure was most likely to be changed. In any event, a zero weight just means that the variable contains no information about the mar-ket valuation in that year.9
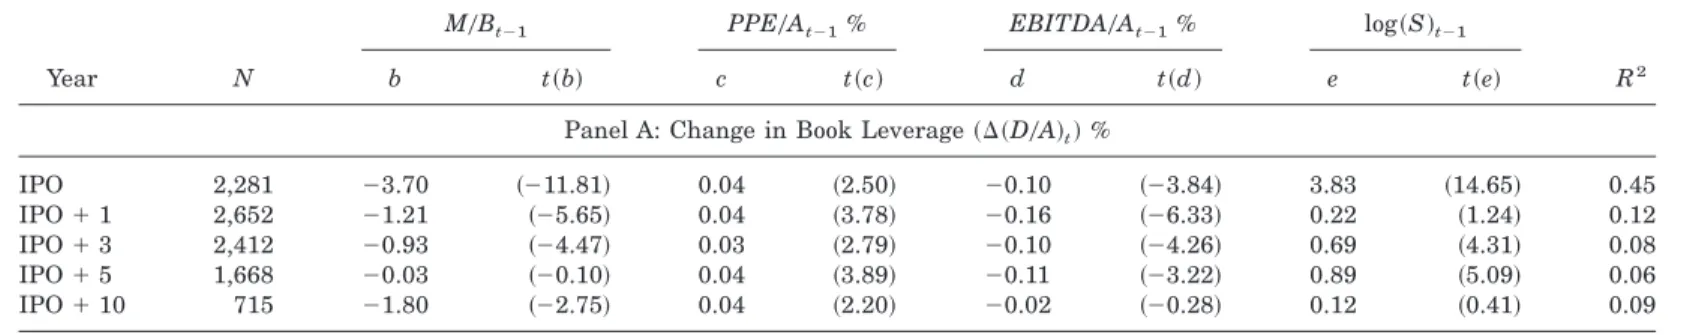
To compare the univariate explanatory power of this variable relative to other determinants of leverage, Figure 1 shows theR2 for univariate regres-sions run in IPO time:
冉
DA
冊
IPO⫹t⫽a⫹bXt⫺1⫹ut, ~4!
where X includes the four Rajan and Zingales ~1995! variables, as well as four more variables used in a study of capital structure determinants by Fama and French~2000! that do not substantially overlap: two measures of dividends, a measure of depreciation, and a measure of research and devel-opment. Those variables are defined as follows. Dividends over book equity are common stock dividends~Item 21! divided by book equity. Dividends to market equity is self-explanatory. Depreciation expense to assets is depre-ciation ~Item 14! divided by assets. Research and development to assets is R&D expenditures ~Item 46! divided by assets. Fama and French regard dividends to book equity as a proxy for profitability, dividends to market equity and research and development as proxies for investment opportuni-ties, and depreciation as a proxy for nondebt tax shields. In analogy to our procedure with market-to-book, we also construct the weighted averages of the past values of each variable.
The solid lines in Figure 1 trace out the cross-sectionalR2 ofXt⫺1, and the dashed lines trace out theR2 ofXefwa,t⫺1. Panel A reports results for market-to-book. It enters with a negative coefficient, as expected. The weighted av-erage explains about 15 percent of the cross-sectional variation in capital structure, and this cross-sectional explanatory power holds steady as firms age. In contrast, the explanatory power of the once-lagged value steadily diminishes as firms age. The growing gap between the dashed line and the solid line means that historical valuation information becomes increasingly relevant for firms that are more than a few years old.
The univariate explanatory power of the weighted average market-to-book is strong by comparison to the other variables. Both the weighted and the unweighted versions of asset tangibility have the expected positive coeffi-cient but relatively low explanatory power.~We report the magnitude of the
9An alternative procedure that also ensures that the weight is increasing in the amount of
external finance is to exclude years when the denominator~the sum of external finance from 0 tot⫺1!is negative. This allows for some negative weights. Another possibility is to put all of the weight on the historical maximum market-to-book, that is, the maximum market-to-book that prevailed between the IPO andt⫺1. The intuition behind this measure is that if market valuations have large and persistent effects on leverage, this is most likely to be because of the extreme value. Other possibilities include an equal-weighted average and an external equity-weighted average. All of these procedures give similar results and are omitted to save space.
Figure 1. Univariate explanatory power of determinants of capital structure as cor-porations age.R2for univariate OLS regressions of book leverage on determinants of capital
structure:
冉
D A冊
IPO⫹t⫽a⫹bXt⫺1⫹ut
Book value leverage is book debt to assets. We consider eight independent variables, and each one is defined in two ways. The solid line uses the yeart⫺1 value. The dashed line uses an external finance weighted-average value from the IPO year through year t⫺1. External fi-nance is defined as net equity issues plus net debt issues. Where this is negative, the weight is set to zero. Market-to-book is assets minus book equity plus market equity all divided by assets. We drop firm-year observations where market-to-book is above 10. Fixed assets intensity is defined as net property, plant, and equipment divided by assets. Profitability is defined as operating income before depreciation divided by assets. Firm size is defined as the log of net sales. Common dividends are scaled by book equity and market equity. Depreciation expense is scaled by assets. R&D is defined as research and development expense divided by assets.
coefficients in the multivariate results to follow.! Profitability has the ex-pected negative coefficient and accumulates explanatory power as firms age, especially the weighted version. This makes sense if firms prefer to retain earnings rather than pay them out. The weighted average includes not only recent profitability but also the effect of past profitability, both of which affect total retained earnings. Size has the expected positive coefficient but relatively little ability to explain the cross section among firms that are more than a few years old. The two scaled dividends variables generally have positive coefficients, depreciation has an unstable coefficient, and none of these variables has a univariateR2consistently greater than 0.01. This is perhaps not surprising in our sample of IPOs. Research and development expense has the expected negative coefficient and is stronger. Figure 1 also shows that the weighting scheme does not improve the performance of all variables. Historical information adds incremental value only to market-to-book and profitability. Finally, we note that survival bias does not drive the patterns in Figure 1. The same patterns are apparent in the sample of 10-year survivors ~not reported!.
Figure 1 sheds new light on the dynamics of capital structure. It does not control for interrelationships—we do that shortly—but it does hint at some general conclusions. When firms go public, their capital structure ref lects a number of factors, including market-to-book, asset tangibility, size, and re-search and development intensity. As firms age, the cross section of leverage is more and more explained by past financing opportunities, as determined by the market-to-book ratio, and past opportunities to accumulate retained earnings, as determined by profitability. The effect of past profitability has previously been noted by Titman and Wessels ~1988!.
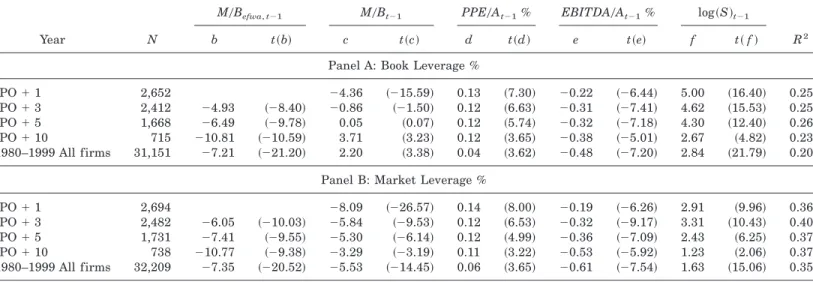
Table III shows results for multivariate regressions of book and market leverage on the weighted average market-to-book ratio and the four Rajan and Zingales ~1995!variables:
冉
D A冊
t⫽a⫹b
冉
MB
冊
efwa,t⫺1⫹c冉
MB
冊
t⫺1⫹d冉
PPEA
冊
t⫺1⫹e
冉
EBITDAA
冊
t⫺1⫹flog~S!t⫺1⫹ut.
~5!
The simultaneous inclusion of M0Bt⫺1 controls for current cross-sectional variation in the levelof market-to-book. What is left for M0Befwa is the re-sidual inf luence ofpast, within-firm variationin market-to-book. This is an important aspect of our experimental design. The first-order variation in market-to-book may be related to investment opportunities, not perceived mispricing. Controlling for current investment opportunities in the form of current market-to-book leaves the past within-firm variation to do a better job of picking up what may have been perceived as transient market timing opportunities.
Table III
Determinants of Leverage
OLS and Fama–MacBeth regressions of book and market leverage on the market-to-book ratio, fixed assets, profitability, and firm size.
冉
DA
冊
t⫽a⫹b
冉
MB
冊
efwa,t⫺1⫹c
冉
MB
冊
t⫺1⫹d
冉
PPEA
冊
t⫺1⫹e
冉
EBITDAA
冊
t⫺1⫹f log~S!t⫺1⫹ut.
We do not reporta. Leverage is defined either as book debt to book assets~book value!or book debt to the result of total assets minus book equity plus market equity~market value!and is expressed in percentage terms. The market-to-book ratio is defined in two ways. The first is a weighted average market-to-book ratio from the IPO year to year t⫺1. The weights are the amount of external finance raised in each year. External finance is defined as net equity issues plus net debt issues. Where this is negative, the weight is set to zero. The second is the market-to-book ratio in yeart⫺1, defined as assets minus book equity plus market equity all divided by assets. Fixed assets intensity is defined as net property, plant, and equipment divided by assets. Profitability is defined as operating income before depreciation divided by assets. Firm size is defined as the log of net sales. Panel A shows results for book leverage. Panel B shows results for market leverage. Robustt-statistics are in parentheses.
M0Befwa,t⫺1 M0Bt⫺1 PPE0At⫺1% EBITDA0At⫺1% log~S!t⫺1
Year N b t~b! c t~c! d t~d! e t~e! f t~f! R2
Panel A: Book Leverage %
IPO⫹1 2,652 ⫺4.36 ~⫺15.59! 0.13 ~7.30! ⫺0.22 ~⫺6.44! 5.00 ~16.40! 0.25 IPO⫹3 2,412 ⫺4.93 ~⫺8.40! ⫺0.86 ~⫺1.50! 0.12 ~6.63! ⫺0.31 ~⫺7.41! 4.62 ~15.53! 0.25 IPO⫹5 1,668 ⫺6.49 ~⫺9.78! 0.05 ~0.07! 0.12 ~5.74! ⫺0.32 ~⫺7.18! 4.30 ~12.40! 0.26 IPO⫹10 715 ⫺10.81 ~⫺10.59! 3.71 ~3.23! 0.12 ~3.65! ⫺0.38 ~⫺5.01! 2.67 ~4.82! 0.23 1980–1999 All firms 31,151 ⫺7.21 ~⫺21.20! 2.20 ~3.38! 0.04 ~3.62! ⫺0.48 ~⫺7.20! 2.84 ~21.79! 0.20
Panel B: Market Leverage %
IPO⫹1 2,694 ⫺8.09 ~⫺26.57! 0.14 ~8.00! ⫺0.19 ~⫺6.26! 2.91 ~9.96! 0.36 IPO⫹3 2,482 ⫺6.05 ~⫺10.03! ⫺5.84 ~⫺9.53! 0.12 ~6.53! ⫺0.32 ~⫺9.17! 3.31 ~10.43! 0.40 IPO⫹5 1,731 ⫺7.41 ~⫺9.55! ⫺5.30 ~⫺6.14! 0.12 ~4.99! ⫺0.36 ~⫺7.09! 2.43 ~6.25! 0.37 IPO⫹10 738 ⫺10.77 ~⫺9.38! ⫺3.29 ~⫺3.19! 0.11 ~3.22! ⫺0.53 ~⫺5.92! 1.23 ~2.06! 0.37 1980–1999 All firms 32,209 ⫺7.35 ~⫺20.52! ⫺5.53 ~⫺14.45! 0.06 ~3.65! ⫺0.61 ~⫺7.54! 1.63 ~15.06! 0.35
16
The
Journal
of
Table III shows that the effect ofM0Befwais stronger and more consistent thanM0Bt⫺1. This is especially true in book leverage, whereM0Bt⫺1does not benefit from a mechanical relationship to the dependent variable. In book val-ues, the once-lagged market-to-book goes from having little incremental ex-planatory power for young firms, to none at all, then f lips sign for older firms. In contrast, the coefficient onM0Befwaremains negative and actually gets larger with firm age. The importance of historical valuation information is also ap-parent in the 1980 to 1999 All Firms sample that does not impose the known-IPO date screen. For this sample, the weighted average is formed using market-to-book information from the first appearance on COMPUSTAT where stock price data are not missing~whether or not the firm appears in the SDC or Rit-ter IPO samples!throught⫺1. Overall, these results suggest thathistorical within-firm variation in market-to-book, not current cross-firm variation, is more important in explaining the cross section of leverage. This persistence of his-torical valuations contrasts with the normative trade-off theory in which man-agers keep leverage at a target determined by current characteristics.
Table III also indicates that the weighted average market-to-book is gen-erally the single most economically important of these variables. At IPO⫹3, for example, a one standard deviation increase in leverage is associated with a decrease in book leverage of 6.51 percentage points~e.g., from 46.88 per-cent, the IPO⫹3 sample mean, to 40.37 percent! and a decrease in market leverage of 7.99 percentage points. The second-largest effect at IPO⫹3 comes through size, where a one standard deviation increase in log sales is asso-ciated with an increase in book leverage of 6.33 percentage points and an increase in market leverage of 4.53 percentage points. As firms age, the effect of past market valuations becomes even more prominent, consistent with the impressions from Figure 1. At IPO⫹ 10, for example, a one stan-dard deviation increase in M0Befwa is associated with a decrease in book leverage of 10.49 percentage points and a decrease in market leverage of 10.45 percentage points. The second-largest effect at IPO⫹10 comes through profitability, where a one standard deviation increase is associated with a decrease in book leverage of 4.59 percentage points and a decrease in market leverage of 6.40 percentage points. The relative strength of the effect of his-torical valuations is also large in the sample that does not condition on know-ing the IPO date, indicatknow-ing that the dynamics apparent in IPO time also apply to the broader COMPUSTAT universe.10
Table IV reports results of multivariate regressions that use the control variables suggested by Fama and French ~2000!. They use eight variables,
10The comparative statics in this paragraph are computed as follows. Referring to the
co-efficients in Table III, ⫺6.51⫽ ⫺4.93 *1.32 and ⫺7.99⫽ ⫺6.05* 1.32, where 1.32 is the standard deviation of the lagged weighted average market-to-book at IPO⫹3. 6.33⫽4.62*
1.37 and 4.53⫽ 3.31 * 1.37, where 1.37 is the standard deviation of lagged log sales at IPO⫹3.⫺10.49⫽ ⫺10.81* 0.97 and ⫺10.45⫽ ⫺10.77 *0.97, where 0.97 is the standard deviation of the lagged weighted average market-to-book at IPO⫹10.⫺4.59⫽ ⫺0.38*12.07 and⫺6.40⫽ ⫺0.53* 12.07 where 12.07 is the standard deviation of lagged profitability in percentage terms at IPO⫹10.
Table IV
Determinants of Leverage: Alternative Control Variables
OLS and Fama–MacBeth regressions of leverage on determinants suggested by Fama and French ~2000!.
冉
D A冊
t⫽a⫹b
冉
MB
冊
efwa,t⫺1⫹c冉
M
B
冊
t⫺1⫹d冉
ET
A
冊
t⫺1⫹e冉
Div
BE
冊
t⫺1⫹f冉
Div
ME
冊
t⫺1⫹g冉
Dp A
冊
t⫺1⫹h
冉
RDA
冊
t⫺1⫹iRDDt⫺1⫹j log~A!t⫺1⫹ut.
We do not reporta. Leverage is defined either as book debt to book assets~book value!or book debt to the result of total assets minus book equity plus market equity~market value!and is expressed in percentage terms. The market-to-book ratio is defined in two ways. The first is an external finance weighted average market-to-book ratio from the IPO year to yeart⫺1. The weights are the amount of external finance raised in each year. External finance is defined as net equity issues plus net debt issues. Where this is negative, the weight is set to zero. The second is the market-to-book ratio in yeart⫺1, defined as assets minus book equity plus market equity all divided by assets. Earnings before interest and taxes is scaled by assets. Common dividends are scaled by book equity and market equity. Depreciation expense is scaled by assets. Research and development expense is scaled by assets. RDD is a dummy set to one if the firm has no R&D expense. Panel A shows results for book leverage. Panel B shows results for market leverage. Robust t-statistics are in parentheses.
18
The
Journal
of
M0Befwa M0B ET0A% Div0BE% Div0ME% Dp0A% RD0A% RDD log~A!
Year N
b t~b!
c t~c!
d t~d!
e t~e!
f t~f!
g t~g!
h t~h!
i t~i!
j
t~j! R2
Panel A: Book Leverage %
IPO⫹1 2,651 ⫺4.75 ⫺0.20 0.31 ⫺0.54 0.06 ⫺0.32 7.35 3.83 0.28 ~⫺16.83! ~⫺5.89! ~6.92! ~⫺5.19! ~0.78! ~⫺3.50! ~6.88! ~12.22! IPO⫹3 2,411 ⫺4.46 ⫺0.36 ⫺0.35 0.29 ⫺0.16 ⫺0.08 ⫺0.45 6.14 3.30 0.29
~⫺7.88! ~⫺0.66! ~⫺8.98! ~1.58! ~⫺0.99! ~⫺1.03! ~⫺6.11! ~6.62! ~10.98! IPO⫹5 1,667 ⫺6.13 0.25 ⫺0.30 0.28 ⫺0.14 ⫺0.08 ⫺0.32 5.32 3.25 0.26
~⫺9.02! ~0.35! ~⫺8.17! ~2.58! ~⫺1.07! ~⫺1.08! ~⫺2.45! ~4.25! ~9.46! IPO⫹10 715 ⫺9.45 3.84 ⫺0.44 0.44 0.02 ⫺0.17 ⫺0.42 4.80 1.82 0.27
~⫺8.52! ~3.46! ~⫺5.51! ~2.90! ~0.08! ~⫺1.28! ~⫺2.54! ~2.90! ~3.51! 1980–1999 All firms 31,147 ⫺6.28 1.88 ⫺0.43 0.19 ⫺0.48 ⫺0.31 ⫺0.52 3.51 2.36 0.22
~⫺28.59! ~3.69! ~⫺7.99! ~2.55! ~⫺4.65! ~⫺4.38! ~⫺13.19! ~8.23! ~31.72!
Panel B: Market Leverage %
IPO⫹1 2,693 ⫺7.66 ⫺0.22 ⫺0.04 0.13 0.03 ⫺0.48 6.83 1.67 0.39 ~⫺26.11! ~⫺7.09! ~⫺1.42! ~1.75! ~0.34! ~⫺5.68! ~6.84! ~5.43! IPO⫹3 2,481 ⫺5.43 ⫺4.95 ⫺0.36 ⫺0.14 0.42 ⫺0.20 ⫺0.52 7.18 1.67 0.44
~⫺8.95! ~⫺8.05! ~⫺9.82! ~⫺1.18! ~3.28! ~⫺2.67! ~⫺5.63! ~6.70! ~5.23! IPO⫹5 1,730 ⫺6.53 ⫺4.52 ⫺0.36 ⫺0.06 0.22 ⫺0.22 ⫺0.60 6.29 1.12 0.40
~⫺8.51! ~⫺5.51! ~⫺8.83! ~⫺1.08! ~3.45! ~⫺2.65! ~⫺5.39! ~4.90! ~2.95! IPO⫹10 738 ⫺8.17 ⫺3.10 ⫺0.51 ⫺0.07 0.33 ⫺0.24 ⫺0.60 6.15 0.13 0.40
~⫺6.50! ~⫺2.91! ~⫺6.85! ~⫺0.37! ~0.70! ~⫺1.95! ~⫺3.53! ~3.47! ~0.24! 1980–1999 All firms 32,205 ⫺5.89 ⫺5.41 ⫺0.53 ⫺0.53 0.17 ⫺0.38 ⫺0.66 4.51 1.34 0.39
~⫺20.76! ~⫺12.02! ~⫺9.50! ~⫺2.86! ~1.29! ~⫺5.43! ~⫺14.17! ~8.27! ~11.07!
Market
T
iming
and
Capital
Structure
some of which overlap with the variables used earlier. Their eight vari-ables are: market-to-book, earnings before interest and taxes to assets, dividends over book equity, dividends to market equity, depreciation ex-pense to assets, research and development exex-pense to assets, a dummy variable for firms that report no research and development, and the log of total assets. As before, all independent variables are lagged. The re-sults show that the coefficient on the weighted average market-to-book is not sensitive to this change in control variables. At IPO⫹ 10, a one stan-dard deviation change inM0Befwais associated with bigger changes in book and market leverage than a similar one standard deviation change in the other independent variables ~we omit the calculations for brevity!. As be-fore, the second-biggest effect is generally profitability. Overall, the results from Tables III and IV show that the effect of historical valuations on leverage is large and separate from various effects documented in prior literature.11
D. Persistence
So far we have documented two main results. First, high market valua-tions reduce leverage in the short run. Second, historically high market valuations are associated with lower leverage in the cross section. The connection between these two results must be that the market-to-book ef-fect is very persistent. We conclude the empirical section by f leshing out the degree and magnitude of this persistence. We use the Rajan and Zin-gales ~1995! control variables going forward. The results are similar using other controls.
Table V shows results for regressions of cumulative changes in leverage from the pre-IPO value on the Rajan and Zingales~1995!variables plus the pre-IPO value of leverage.12
11The inclusion of a measure of the marginal corporate tax rate, kindly provided by John
Graham as used in Graham, Lemmon, and Schallheim~1998!, also did not affect the coefficient on the weighted average market-to-book.
12The coefficients on M0B
efwa,t⫺1are slightly smaller when the initial level of leverage is
not included as an independent variable. For example, the coefficient is⫺6.78 with at-statistic of⫺3.45 for IPO⫹10 and book leverage. The reason for the reduced statistical and economic significance is that our sample contains firms that start with mostly debt or no debt. For these firms, the test is one-sided. It is impossible to increase leverage above 1, and impossible to decrease leverage below 0. The latter effect is more important for this sample. Unprofit-able, all equity firms can issue lots of equity but cannot further reduce their leverage ratio in the face of high market valuations. By controlling for initial leverage, we can demonstrate that firms that start with low leverage and high valuations increase their leverage by less than firms that start out with similarly low leverage but low valuations. To us, this seems to be the relevant test. The coefficient on the initial level of leverage is not reported in Table V. It ranges from⫺0.62 to⫺0.71 for book value regressions and from⫺0.70 to⫺0.75 for market value regressions.
Table V
Determinants of Cumulative Changes in Leverage from the Pre-IPO Value
OLS and Fama–MacBeth regressions of the cumulative change in leverage since the pre-IPO value on the market-to-book ratio, fixed assets, profitability, and firm size.
冉
DA
冊
t⫺冉
D
A
冊
pre-IPO⫽a⫹b
冉
MB
冊
efwa,t⫺1⫹c
冉
MB
冊
t⫺1⫹d
冉
PPEA
冊
t⫺1⫹e
冉
EBITDAA
冊
t⫺1⫹f log~S!t⫺1⫹g
冉
DA
冊
pre-IPO⫹ut.
We do not reportaandg. Leverage is defined either as book debt to book assets~book value!or book debt to the result of total assets minus book equity plus market equity~market value!and is expressed in percentage terms. The market-to-book ratio is defined in two ways. The first is a weighted average market-to-book ratio from the IPO year to yeart⫺1. The weights are the amount of external finance raised in each year. External finance is defined as net equity issues plus net debt issues. Where this is negative, the weight is set to zero. The second is the market-to-book ratio in yeart⫺1, defined as assets minus book equity plus market equity all divided by assets. Fixed assets intensity is defined as net property, plant, and equipment divided by assets. Profitability is defined as operating income before depreciation divided by assets. Firm size is defined as the log of net sales. Panel A shows results for book leverage. Panel B shows results for market leverage. Robust t-statistics are in parentheses.
M0Befwa,t⫺1 M0Bt⫺1 PPE0At⫺1% EBITDA0At⫺1% log~S!t⫺1
Year N b t~b! c t~c! d t~d! e t~e! f t~f! R2
Panel A: Book Leverage %
IPO⫹1 2,166 ⫺4.10 ~⫺13.43! 0.11 ~6.95! ⫺0.27 ~⫺6.52! 3.49 ~12.44! 0.46 IPO⫹3 1,553 ⫺4.45 ~⫺6.48! ⫺0.75 ~⫺1.04! 0.11 ~5.34! ⫺0.36 ~⫺6.25! 3.45 ~9.70! 0.46 IPO⫹5 1,058 ⫺5.46 ~⫺6.73! 0.03 ~0.03! 0.11 ~4.33! ⫺0.36 ~⫺7.35! 3.58 ~8.34! 0.47 IPO⫹10 381 ⫺10.26 ~⫺6.96! 4.25 ~3.30! 0.07 ~1.82! ⫺0.28 ~⫺3.54! 2.34 ~3.26! 0.45 1980–1999 All firms 17,383 ⫺6.81 ~⫺16.72! 2.54 ~5.03! 0.05 ~7.19! ⫺0.50 ~⫺12.33! 2.61 ~14.34! 0.48
Panel B: Market Leverage %
IPO⫹1 2,180 ⫺8.10 ~⫺21.93! 0.12 ~6.98! ⫺0.27 ~⫺7.33! 1.57 ~5.26! 0.54 IPO⫹3 1,588 ⫺5.47 ~⫺7.70! ⫺5.68 ~⫺7.87! 0.12 ~5.36! ⫺0.40 ~⫺8.96! 2.14 ~5.41! 0.53 IPO⫹5 1,091 ⫺6.14 ~⫺6.54! ⫺5.14 ~⫺5.03! 0.12 ~4.18! ⫺0.39 ~⫺5.86! 1.59 ~3.23! 0.49 IPO⫹10 393 ⫺11.78 ~⫺8.29! ⫺1.96 ~⫺1.76! 0.09 ~2.10! ⫺0.47 ~⫺6.17! 0.69 ~0.91! 0.56 1980–1999 All firms 17,896 ⫺6.74 ~⫺14.81! ⫺6.25 ~⫺6.40! 0.08 ~5.25! ⫺0.63 ~⫺11.83! 1.27 ~7.93! 0.55
Market
T
iming
and
Capital
Structure
冉
D A冊
t⫺冉
D
A
冊
pre-IPO⫽a⫹b冉
M
B
冊
efwa,t⫺1⫹c冉
MB
冊
t⫺1⫹d冉
PPEA
冊
t⫺1⫹e
冉
EBITDAA
冊
t⫺1⫹f log~S!t⫺1⫹g
冉
D A冊
pre-IPO~6!
⫹ut.
By measuring changes from the leverage prevailing in the year before the IPO, the dependent variable includes the effect of the IPO itself. This is useful for us because the IPO is a critical financing event known to be con-nected to market value.
Table V shows that the determinants of cumulative changes in leverage are essentially the same, in sign and magnitude, as the determinants of leverage levels reported in Table III. As before, a one standard deviation change in the weighted average market-to-book is associated with a larger change in the dependent variable than a similar one standard deviation change in other in-dependent variables~we omit the calculations for brevity!. This regression re-sult indicates that the weighted average market-to-book rere-sult is unlikely to ref lect an omitted firm characteristic that would also inf luence initial lever-age. Instead, it provides more evidence that market valuations have effects on capital structure that persist and therefore accumulate over time.
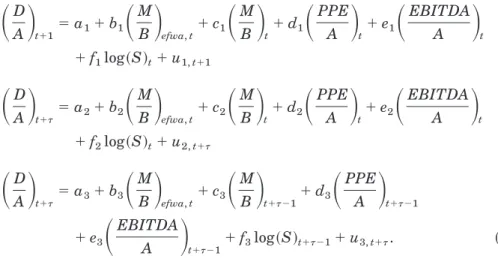
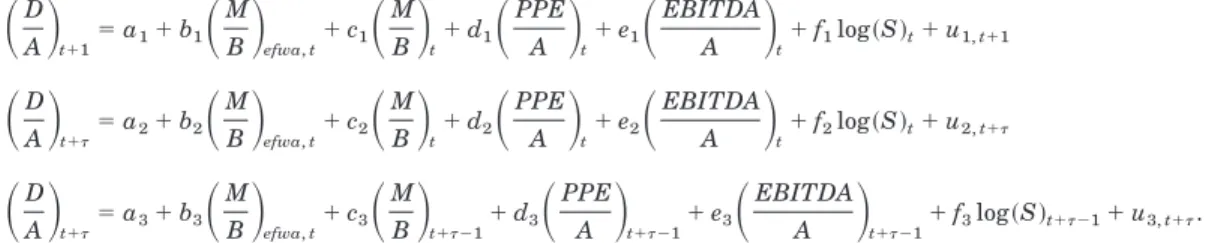
Table VI takes a direct look at the persistence of the effect of past valua-tions. We test persistence with a system of three regressions. The first re-gression looks at the effect ofM0Befwa,t oncurrent capital structure at time t⫹1, controlling for other characteristics measured at timet. This is simply a repetition of the regressions in Table III. The second regression replaces current capital structure with future capital structure at time t ⫹ t, still using controls from timet. The third regression looks at the effect ofM0Befwa measured at timet on future capital structure, controlling for future char-acteristics measured at time t⫹t⫺ 1.
冉
DA
冊
t⫹1⫽a1⫹b1冉
MB
冊
efwa,t⫹c1
冉
MB
冊
t⫹d1
冉
PPEA
冊
t⫹e1
冉
EBITDA
A
冊
t⫹f1log~S!t⫹u1,t⫹1
冉
D A冊
t⫹t⫽a2⫹b2
冉
MB
冊
efwa,t⫹c2
冉
M B冊
t⫹d2
冉
PPE A冊
t⫹e2
冉
EBITDA A冊
t⫹f2log~S!t⫹u2,t⫹t
冉
D A冊
t⫹t⫽a3⫹b3
冉
MB
冊
efwa,t⫹c3
冉
MB
冊
t⫹t⫺1⫹d3冉
PPEA
冊
t⫹t⫺1⫹e3
冉
EBITDA
The trade-off theory with adjustment costs allows capital structure to re-spond slowly toM0Bt. But eventually the past, temporary f luctuations cap-tured inM0Befwameasured at timetshould no longer matter. In terms of the coefficients, the trade-off theory predicts that b2 and b3 should be zero for capital structure measured in the distant future. The ratio of b2 to b1 and the ratio of b3 to b1 therefore measure the long-term effect of temporary f luctuations in the market-to-book ratio. By simultaneously estimating equa-tion~7!, we can also put confidence intervals around the two ratios.
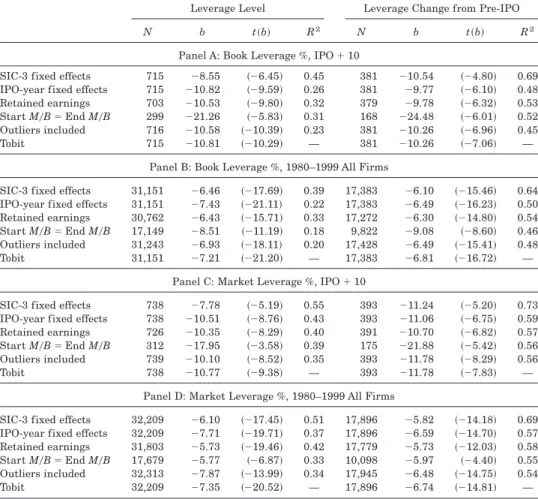
Table VI reports the results. The columns on the left report Fama– MacBeth estimates and t-statistics for b1, b2, b3, and c3. We require that the set of firms is the same in all three regressions. In other words, to be included in the first regression, a firm must survive at least t years. As a result, the estimates of b1 change with t. The first and second columns show that this survival effect is small. In book values, the coefficients fall in a narrow range between ⫺6.91 and ⫺7.48. Note also that the first row in each panel matches the estimate for the 1980 to 1999 All Firms sample in Table III. The next four columns document the persistence of the M0Befwa effect: b2 and b3 both remain strongly significant for at least 10 years.13The b
3 coefficient is surprising. Its strength indicates that market-to-book variation from 1990 and before, for example, remains a strong determinant of capital structure as of 2000. This is true controlling for the 1999 values of market-to-book and other characteristics. Perhaps even more surprising is that, in book values, b3 is several times the size of the c3 coefficients reported in the next two columns. Thus the historical path of market-to-book, even calculated with data over 10 years old, is much more inf luential than the current market-to-book. In market values, b3 is also substantial relative to c3, which is notable since much of the contempora-neous correlation between market-to-book and market leverage is likely to be mechanical.
The last columns in Table VI report the fraction of the initial effect that remains after t years. For book leverage,b2 divided by b1 is still 0.73 after 10 years; 73 percent of the initial effect is still apparent 10 years later. By any practical definition, the effect is permanent. We also report a lower bound estimate of this ratio, calculated by drawing values ofb1andb2from the joint distribution of the two estimates. We can say with 95 percent con-fidence that at least two-thirds of theM0Befwa effect lasts for 10 years. For market leverage, the effect is 100 percent permanent. The last two columns show similar results for the ratio ofb3 to b1.
In summary, we have documented that historical market valuations have large and very persistent effects on capital structure. This effect is indepen-dent of various control variables. In the Appendix, we report results for some additional robustness checks.
13The standard errors onb
3are smaller than the standard errors onb2because the
corre-lation betweenM0Befwa,tandM0Bt⫹t⫺1is generally lower than correlation betweenM0Befwa,t
andM0Bt.
Table VI
Persistence of Market-to-Book Effects
Fama–MacBeth regressions of current and future leverage on the market-to-book ratio, fixed assets, profitability, and firm size.
冉
DA
冊
t⫹1⫽a1⫹b1
冉
MB
冊
efwa,t⫹c1
冉
MB
冊
t⫹d1
冉
PPEA
冊
t⫹e1
冉
EBITDA
A
冊
t⫹f1log~S!t⫹u1,t⫹1
冉
D A冊
t⫹t⫽a2⫹b2
冉
MB
冊
efwa,t⫹c2
冉
MB
冊
t⫹d2
冉
PPEA
冊
t⫹e2
冉
EBITDA
A
冊
t⫹f2log~S!t⫹u2,t⫹t
冉
D A冊
t⫹t⫽a3⫹b3
冉
MB
冊
efwa,t⫹c3
冉
MB
冊
t⫹t⫺1⫹d3冉
PPEA
冊
t⫹t⫺1⫹e3冉
EBITDA
A
冊
t⫹t⫺1⫹f3log~S!t⫹t⫺1⫹u3,t⫹t.We report onlyb1,b2,b3, andc3. Leverage is defined either as book debt to book assets~book value!or book debt to the result of total assets minus book equity plus market equity~market value!and is expressed in percentage terms. The persistence of the market-to-book effect is measured by a ratio of coefficients:b2divided byb1orb3divided byb1. For eachtfrom 1 to 10, we run a set of three regressions for each yeartstartingtyears prior to 1980 and endingsyears prior to 1999 and record 20 sets of three coefficients. Only firms that survivetyears are included so that each set of coefficients is calculated with the same sample of firms. A lower bound estimate~LB!for the ratio of the coefficients is calculated for the five percent level of significance by drawing from the joint distribution of the two means. Panel A shows results for book leverage. Panel B shows results for market leverage. Robustt-statistics are in parentheses.
M0Befwa,tCoefficient M0Bt⫹t⫺1Coefficient Coefficient Ratios and Lower Bounds
Year b1 t~b1! b2 t~b2! b3 t~b3! c3 t~c3! b20b1 LBp⫽0.05 b30b1 LBp⫽0.05
Panel A: Book Leverage %
t⫹1 ⫺7.21 ~⫺21.20! ⫺7.21 ~⫺21.20! ⫺7.21 ~⫺21.20! 2.20 ~3.38! 1.00 — 1.00 —
t⫹3 ⫺7.36 ~⫺25.28! ⫺6.31 ~⫺18.44! ⫺5.57 ~⫺18.33! 0.20 ~0.29! 0.86 0.81 0.76 0.71
t⫹5 ⫺7.48 ~⫺24.85! ⫺5.99 ~⫺14.98! ⫺5.35 ~⫺16.97! 0.24 ~0.29! 0.80 0.73 0.73 0.67
t⫹10 ⫺6.91 ~⫺13.77! ⫺5.05 ~⫺12.15! ⫺5.11 ~⫺18.15! 0.45 ~0.49! 0.73 0.66 0.75 0.68 Panel B: Market Leverage %
t⫹1 ⫺7.35 ~⫺20.52! ⫺7.35 ~⫺20.52! ⫺7.35 ~⫺20.52! ⫺5.53 ~⫺14.45! 1.00 — 1.00 —
t⫹3 ⫺7.50 ~⫺19.34! ⫺7.51 ~⫺13.33! ⫺6.64 ~⫺18.64! ⫺7.72 ~⫺19.33! 1.00 0.90 0.90 0.81
t⫹5 ⫺7.65 ~⫺19.04! ⫺7.61 ~⫺12.57! ⫺6.13 ~⫺18.26! ⫺8.57 ~⫺16.92! 1.00 0.89 0.82 0.75
t⫹10 ⫺6.47 ~⫺9.59! ⫺6.98 ~⫺13.56! ⫺5.67 ~⫺14.36! ⫺9.23 ~⫺13.25! 1.08 0.98 0.88 0.74
24
The
Journal
of
II. Discussion
We have documented that f luctuations in the market-to-book ratio have considerable and lasting effects on leverage. Here we ask whether the re-sults can be explained by existing theories given particular interpretations of the market-to-book ratio. We also consider the possibility that capital structure evolves as the outcome of past attempts to time the market. In our opinion, the results are most consistent with this market-timing theory of capital structure.
A. Trade-off Theory
In perfect and efficient markets, Modigliani and Miller ~1958! show that capital structure is irrelevant. The trade-off theory determines an optimal capital structure by adding various imperfections, including taxes, costs of financial distress, and agency costs, but retains the assumptions of market efficiency and symmetric information. Some of the imperfections that lead to an optimal trade-off are as follows. Higher taxes on dividends indicate more debt ~Modigliani and Miller ~1963! and Miller and Scholes ~1978!!. Higher nondebt tax shields indicate less debt~DeAngelo and Masulis~1980!!. Higher costs of financial distress indicate more equity. Short of bank-ruptcy, senior debt can force managers to forgo profitable investment op-portunities ~Myers ~1977!!. Agency problems can call for more or less debt. Too much equity can lead to free cash f low and conf licts of interest be-tween managers and shareholders ~Jensen~1986!!. Too much debt can lead to asset substitution and conf licts of interest between managers and bond-holders ~Fama and Miller ~1972! and Jensen and Meckling ~1976!!. Harris and Raviv ~1991! survey these and other possible inf luences on optimal capital structure.
The market-to-book ratio can be connected to several elements of the trade-off theory. It is most commonly attached to costly financial distress as in Myers ~1977!, Smith and Watts ~1992!, Rajan and Zingales ~1995!, and Barclay, Smith, and Watts ~1995!. The idea is that firms with substan-tial growth and investment opportunities have the most to lose when over-hanging debt prevents new capital from being raised or leads to an inefficient bankruptcy negotiation during which some investment opportunities are forever lost.