2017 | Lavras | Editora UFLA | www.editora.ufla.br | www.scielo.br/cagro
http://dx.doi.org/10.1590/1413-70542017415006917
Spatial distribution of the litter carbon stock in the
Cerrado biome in Minas Gerais state, Brazil
Distribuição espacial do estoque de carbono na serrapilheira de fragmentos do bioma Cerrado em Minas Gerais, Brasil
Vinícus Augusto Morais1, José Marcio de Mello2, Carlos Rogério de Mello3*, Carlos Alberto Silva4, José Roberto Soares Scolforo2
1Universidade do Estado de Mato Grosso/UNEMAT, Curso de Engenharia Florestal, Alta Floresta, MT, Brasil 2 Universidade Federal de Lavras/UFLA, Departamento de Ciências Florestais/DCF, Lavras, MG, Brasil 3Universidade Federal de Lavras/UFLA, Departamento de Engenharia/DEG, Lavras, MG, Brasil 4Universidade Federal de Lavras/UFLA, Departamento de Ciência do Solo/DCS, Lavras, MG, Brasil *Corresponding author: [email protected]
Received in March 14, 2017 and approved in June 19, 2017
ABSTRACT
Litter corresponds to the layer of decomposing dead organic matter present on the soil surface. This layer is very important for nutrient
cycling and contributes with organic matter accumulation in the soil, besides the carbon stock. The objective herein was to quantify the carbon biomass, both content and stock, and map the litter C-stock in the Cerrado biome, which is formed by Savanna Grassland
(SG), Cerrado Stricto Sensu (CE) and Forest Savanna (FS), in Minas Gerais state, southeastern Brazil. The data were collected in 26
fragments in Minas Gerais state, totaling 210 sampling locations. A variographic study was conducted and, for mapping, the ordinary kriging method was used for delimitation of homogeneous zones. It was possible to detect high variability in the carbon biomass, carbon content and C-stock in the Cerrado biome litter in Minas Gerais state. The carbon content presented lower variability, ranging from 40 to 44%, so that it is not responsible for explaining the variability of the litter C-stock. Savanna Grassland and Savanna Forest present, respectively, the lowest and highest C-stocks. C-stock presented a considerable spatial structure dependence, allowing to use the geostatistical procedures for mapping it in the Cerrado biome of the Minas Gerais state. The C-stock kriging map showed good accuracy, allowing to verify that the lowest C-stocks in the litter are found from the center to the northern of the Minas Gerais since the highest air temperatures are also verified in this direction.
Index terms: Climate change; Kriging; mapping procedures; accumulated biomass.
RESUMO
A serrapilheira corresponde à camada de matéria morta em decomposição presente sobre o solo. Esta camada é de grande importância na ciclagem de nutrientes e aporte de matéria orgânica sobre o solo, além de estocar carbono. Objetivou-se quantificar a biomassa, teor e estoque de carbono e espacializar o estoque de C da serrapilheira do Cerrado de Minas Gerais. Os dados foram coletados em 26 fragmentos de Cerrado no Estado de MG, totalizando 335 pontos amostrados em todo estado. Foi realizado o estudo variográfico e, para o mapeamento, utilizou-se a Krigagem, para delimitação de zonas homogêneas. Foi possível detectar alta variabilidade nas características avaliadas, biomassa, teor e estoque de carbono na serrapilheira do Cerrado em Minas Gerais, Brasil. O teor de C foi a característica que apresentou menor variabilidade, com intervalo de 40-44%, de modo que não é um atributo crítico para explicar o estoque de C na serrapilheira. O Campo Cerrado tem o mais baixo estoque de C, e o Cerradão o mais alto. O estoque de C apresenta considerável dependência da estrutura espacial, permitindo o uso de procedimentos geoestatísticos para mapeá-lo no bioma Cerrado do estado de Minas Gerais. O mapa de krigagem de estoque de C mostrou boa precisão e com base nele, foi possível verificar que os estoques de menor teor de carbono na serrapulheira são encontrados do centro para o norte do estado de Minas Gerais, onde
tem-se as maiores temperaturas médias anuais.
Termos para indexação: Mudanças climáticas; Krigagem; procedimentos de mapeamento; biomassa acumulada.
INTRODUCTION
In recent decades, the increase in carbon dioxide (CO2) concentrations in the atmosphere has contributed
significantly to the threat of climate change caused by global warming. Deforestation is responsible for about
25% of annual atmospheric CO2 emissions across the globe
(Paiva; Faria, 2007). On the other hand, in Brazil, land
Spatial distribution of the litter carbon stock in the Cerrado biome in Minas Gerais state, Brazil 581
Ciência e Agrotecnologia, 41(5):580-589, Sep/Oct. 2017
most CO2 into the atmosphere (Matthewset al., 2014). In
Minas Gerais state, which is located in southeastern Brazil, deforestation and land use changes have accounted for 54% of all greenhouse gas emissions in Brazil (Brazil, 2011).
Minas Gerais still retains about 35% of its area covered by native vegetation, from which, 62% is formed by Cerrado (Brazilian Savanna) and the other 38%, Atlantic Forest (Scolforo et al., 2016). The Cerrado occupies an area of 122147 km2, considering the different physiognomic
variations, and has undergone extensive anthropic pressure (Rezende et al., 2006; Rufini et al., 2010). However, in
order to preserve the Cerrado, development projects have been necessary aiming making the vegetation maintenance more favorable than deforestation, which can be achieved with carbon credit trading policies. Therefore, it is essential technologies to estimate as accurate as possible the carbon stocks in forests environment and thus to develop maps for spatially estimations of it in the various existing compartments of a forest.
In this context, the geostatistical theory and its spatial interpolation capabilities (Mello et al., 2015; Scolforo et al., 2015) are the tools that allow to quantify precisely and accurately this kind variable. Such methods are widely employed in meteorological, soil attributes and hydrological studies, among others (Ahmed; Marsily 1987; Angulo-Martinez et al., 2009; Hengl; Heuvelink; Rossiter, 2007; Mello et al., 2013), with great results. Thus, it is possible to generate spatial distribution maps of the variable of interest, covering parts not sampled with interpolated information from the sampled locations taking into account the main properties of these techniques, which are minimum variance and summing of the weights equal to 1 (Isaaks; Srivastava, 1989).
One of the compartments present in plant ecosystems is the litter, which can be defined as the layer of organic matter deposited over the soil surface that remains until it is fragmented and broken down by physical-chemical and biotic processes (Aduan; Vilela; Klink, 2003). This matter comes from leaves, flowers, fruits, stems, scraps and animal fecal material (Aduan; Vilela; Klink, 2003; Bellote; Dedecek; Silva, 2008; Silva et al., 2007; Silva et al., 2009). In tropical forests, in general, litter production and its accumulation are continuous over the time (Carreira; Rondon; Zaidan, 2006), in different amounts, depending on the vegetation type which directly influence the amount of litter deposited on the ground
(Silva et al., 2007; Silva et al., 2009).
The litter is a terrestrial ecosystem that is fundamental for nutrients cycling and supply carbon to the soils (Gregorich et al., 2016). Studies have demonstrated that its removal, which mostly occurs by land-use changes
and burning, causes negative impacts on the soil quality properties, like soil bulk density, soil organic matter and microbiological diversity (Tanner; Sheldrake; Turner, 2016). However, an excessive accumulation of organic matter in soil surface can also promote effects in soil’s function which are not yet entirely understood by the science as reported by Leff et al. (2012); Lajtha et al. (2014a); Lajtha et al. (2014b) and Bowden et al. (2014). Both decomposition rate and burning of the litter affect the CO2 emissions to the
atmosphere, which has been increased due to the increase in observed air temperatures in Minas Gerais state in the last 50 years (Ávila et al., 2014) and, indeed, contributing directly with the global warming (Conant et al., 2011).
Carbon stocks in litter can vary greatly. Paiva et al. (2011) determined a range from 2.32 - 4.83 Mg ha-1
for Cerrado biome in the Federal District region (Mid-West Brazil), while Morais et al. (2013a) found values ranging from 2.28 to 8.88 Mg ha-1 for a Savanna Forest
of Minas Gerais. However, the few studies available and the different methodologies used (Watzlawick et al., 2010; Froufe et al., 2011; Paiva et al., 2011; Torres et al., 2013) hinder the understanding of these stocks.
Taking in mind the importance and the natural variability of the litter in the tropical region, this study aimed to quantify and map the biomass, carbon content and C-stocks of litter on the Cerrado biome in Minas Gerais state, southeastern Brazil.
MATERIAL AND METHODS
Physiographic characterization of Minas Gerais state, Brazil
The area of Minas Gerais is 586,528 km2, the altitude
ranges from 50 to 2500 m, the average annual temperature varies from 14 °C in the south to 27 °C in the north, and the average annual rainfall varies from 700 mm in the north to 2000 mm in the far southern (Carvalho et al., 2008).
Minas Gerais still accounts for approximately 35% of its total area covered by native vegetation (Scolforo et al., 2016), which is split into two major biomes: the Cerrado (Brazilian Savanna) that covers 62% of this area (121821 km2) and Atlantic Forest, covering 38% (83464
km2) (Scolforo et al., 2016; Carvalho et al., 2008).
Sensu (CE), with greater density trees and shrubs and a higher
occurrence in Minas Gerais, with ground-cover ranging from 10 to 60%; and Forest Savanna (FS), with ground-cover of 80%, and with a continuous canopy formation. The woody stratum, composed of twisted trees and shrubs, varies between 1.5 m to 15 m in height. Average dry matter, volume and basal area values for each of these Phyto-physiognomies can be observed in Table 1.
Sampling strategy
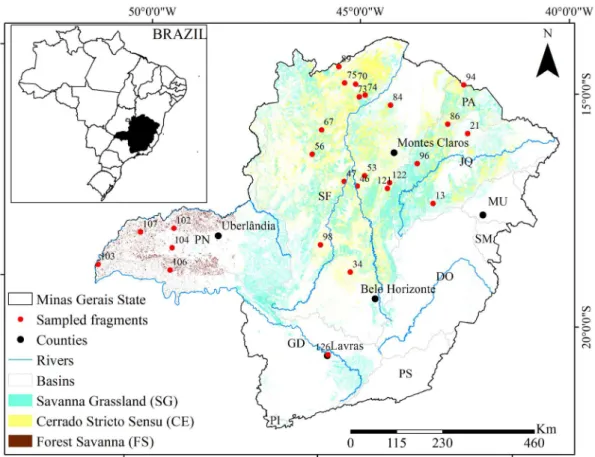
The data sets were collected in 26 Cerrado fragments (Figure 1) that are part of the permanent plot network of the Forest Inventory of Minas Gerais state (Scolforo et al., 2008b). These fragments were selected seeking to cover ranges of temperature, altitude, rainfall pattern and physiognomic differences found in the Cerrado biome in Minas Gerais.
Physiognomic types N G Dg H Vol DW C
Savanna Grassland (SG) 370.4 3.5 11.2 4.3 17.7 10.9 5.0
Cerrado Stricto Sensu (CE) 1168.9 9.4 10.2 5.1 48.5 29.3 14.3
Forest Savanna (FS) 1626.8 18.3 12.0 7.4 128.9 64.6 35.1
Table 1: Average values for the main biometric variables of the physiognomic types under study for the Minas Gerais state, Brazil.
N: number of plants per hectare; G: average basal area (m²ha-1); Dg: quadratic mean diameter (cm); H: average height of the plants
(m); Vol: average volume (m³ ha-1); DW: dry weight (Mg ha-1); C: shoot carbon stock (Mg ha-1). Source: Scolforo et al. (2008b).
Figure 1: Study area with the Cerrado fragments analyzed. (Minas Gerais state basins: DO: Doce; GD: Grande; JQ:
Jequitinhonha; MU: Mucuri; PA: Pardo; PI: Piracicaba; PN: Paranaiba; PS: Paraíba do Sul; SF: San Francisco; SM:
Spatial distribution of the litter carbon stock in the Cerrado biome in Minas Gerais state, Brazil 583
Ciência e Agrotecnologia, 41(5):580-589, Sep/Oct. 2017 In each selected fragment, sampled points were
randomly selected in 30% of the plots, totaling 214 samples. However, the number of samples varied between the fragments as each one of these fragments has a different number of samples. In each sampled fragment, it was randomly selected a sample point, within a plot with wide varying from 0 to 10 m and length varying from 10 to 100 m. For the latter, the first 10 m was neglected since in this strip studies related to natural regeneration have been conducted. At each sampled point, we collected litter samples using a 0.5 m x 1 m (0.5 m2) steel template as a reference
area. The collected material was taken to laboratory and
dried in an oven at 70 oC up to obtain a constant weight.
Dry biomass (g) of each sample was quantified using a weight-machine with an accuracy of 0.01 g. Afterwards, the samples were crushed, grinded and sieved through a mesh of 0.250 mm. After that, the samples were dried again in an oven with forced air circulation at 70 oC during
48 hours, and then, the carbon content was determined. For carbon content determination, a “Elementar” carbon analyzer, type TOC, model Vario TOC Cube, was used, considering samples from 2 to 4 mg from the litter. The samples were packed in tin capsules and taken to an oven at 950 oC for dry combustion. The CO
2 generated by
each sample was quantified using an infrared detector, type NDIR, which relates the carbon generated with respective weight of the samples. Litter C-stocks were obtained weighting the dry biomass value by the respective content and the calculated value was extrapolated to 1 hectare, allowing to obtain the C-stock in Mg ha-1.
Statistical analysis
Biomass, carbon content and C-stock data undergone descriptive statistical analysis, generating information on average, minimum and maximum values for each fragment, and also for all the fragments. For mapping the C stored in the litter we used geostatistical techniques such as variography study and ordinary kriging. In this methodology, the Exponential, Gaussian and Spherical models were tested by means fitting them using the geoR package of the R Core Team software (2013). After fittings, the best model was selected through cross validation, adopting the reduced average error statistics, being the closer to 0 the better the model, and the standard deviation of the reduced errors, which the closer 1 the better the model. Subsequently, the kriging map was generated in ArcGIS software (ESRI, 2004), using the previous selected spatial model.
Interpolation maps were generated in a raster format with 100 m x 100 m grid, or 10000 m2 area for
each pixel within the Cerrado biome. Thus, it was possible to generate of litter C-stock maps for the entire Cerrado biome in Minas Gerais state.
RESULTS AND DISCUSSION
Basic statistical analysis
The average carbon content in the Cerrado litter was 43.27% (± 2.85%), with SG and CE physiognomies presenting lower and higher C content, respectively. The coefficient of variation for carbon content was 6.6%. This low carbon variability allowed to ensure that the average carbon content of the Cerrado litter is approximately 44%. Considering the areas covered by each one of the physiognomies presented by Carvalho et al. (2008), the FS physiognomy area in Minas Gerais state accounts for only 355.01 km2 but present the greatest average C-stock
(4.68 Mg C ha-1). CE physiognomy presents an average
C-stock of 3.74 Mg C ha-1, although to occupy an area
much greater than FS (5560.62 km2). SG physiognomy has
an area similar CE (5374.31 km2), however, an average
C-stock of 2.47 Mg C ha-1. The average C-stock in the
litter of Brazilian Cerrado biome accounts for 3.79 Mg
C ha-1, representing 48% of the variability. It is important
highlight that FS physiognomy occupies only small areas in Triangulo Mineiro region (west of Minas Gerais) while CE and SG are the physiognomy predominant in the Cerrado biome within Minas Gerais state (Figure 1).
FS physiognomy presents both a greater number and large size trees which indeed has greater contribution with litter formation when compared to CE and SG physiognomies. Besides that, FS is formed by species with strong decidual characteristic during the dry season in the state (winter period), increasing the deposition of organic matter in the surface.
Table 2 contains the basic statistics of carbon biomass, carbon content and C-stock observed in the Cerrado biome litter obtained from the 26 fragments evaluated in Minas Gerais state. The average biomass value was 8.73 Mg ha-1 (± 4.11 Mg ha-1), and the lower and
the higher average values were, respectively, found to CE (1.8 Mg ha-1) and FS (20.04 Mg ha-1). These finds mean
MORAIS, V. A. et al.
Table 2: Descriptive statistics for carbon biomass, content and stock in litter for different fragments of Cerrado in Minas Gerais state.
Fragment physiognomyPhyto- Number of samples Biomass (Mg ha
-1) C Content (%) C Stock (Mg ha-1)
Minimum Average Maximum Minimum Average Maximum Minimum Average Maximum
13 CE 10 4.38 12.88 23.67 41.12 44.11 46.70 2.05 5.65 10.43
21 CE 10 5.06 8.34 15.79 40.68 46.46 49.59 2.22 3.90 7.68
34 CE 9 6.62 12.79 22.43 40.59 45.50 48.47 2.96 5.81 10.30
46 CE 6 2.49 7.61 17.57 38.58 42.96 46.44 1.03 3.27 8.02
47 CE 6 0.04 1.80 6.43 36.83 41.97 47.94 0.02 0.69 2.37
53 CE 6 2.47 3.62 6.35 37.01 42.51 49.13 1.04 1.51 2.35
56 SG 6 2.46 4.39 7.85 28.99 35.10 40.78 0.93 1.54 2.78
67 CE 6 2.49 6.32 10.18 41.93 44.98 48.29 1.06 2.84 4.27
70 CE 11 2.18 5.35 10.63 40.14 44.19 47.87 0.97 2.40 4.99
73 CE 5 1.46 3.77 7.39 33.66 43.89 49.67 0.49 1.69 3.38
74 CE 11 1.50 6.58 15.00 38.53 43.73 48.13 0.64 2.84 6.29
75 CE 18 4.09 9.42 20.00 33.31 41.44 49.05 1.43 3.96 9.51
84 CE 4 2.19 5.45 9.22 41.50 46.16 49.60 1.09 2.45 3.83
86 SG 17 2.35 7.60 20.24 40.42 44.79 50.40 0.99 3.39 8.18
89 CE 14 4.02 8.15 21.75 42.08 47.13 51.22 2.06 3.80 9.55
94 CE 8 3.64 15.21 26.27 47.56 49.14 51.99 1.83 7.51 13.43
96 CE 7 6.00 14.35 22.64 38.42 43.24 49.44 2.39 6.27 10.06
98 CE 5 5.63 8.07 11.97 42.85 46.70 50.05 2.47 3.77 5.39
102 FS 18 6.22 10.86 18.91 32.20 40.16 46.37 2.50 4.35 8.01
103 FS 5 2.92 5.62 12.73 37.33 40.73 42.96 1.09 2.34 5.47
104 CE 6 3.43 6.74 10.12 39.16 42.45 46.43 1.44 2.86 4.22
106 FS 5 6.15 9.29 14.05 36.43 40.91 43.91 2.61 3.79 5.68
107 FS 5 5.23 20.04 32.45 39.01 41.34 42.95 2.21 8.24 13.94
121 CE 6 5.73 10.19 16.69 36.22 41.23 46.43 2.08 4.15 6.04
122 CE 7 4.29 11.08 23.48 38.50 43.94 48.01 1.91 4.97 11.27
126 CE 4 5.72 11.37 21.39 38.85 40.34 41.72 2.31 4.54 8.31
Average 3.80 8.73 16.35 38.53 43.27 47.44 1.61 3.79 7.14
Maximum 6.62 20.04 32.45 47.56 49.14 51.99 2.96 8.24 13.94
Minimum 0.04 1.80 6.35 28.99 35.10 40.78 0.02 0.69 2.35
Spatial distribution of the litter carbon stock in the Cerrado biome in Minas Gerais state, Brazil 585
Ciência e Agrotecnologia, 41(5):580-589, Sep/Oct. 2017 This characteristic is noticed when viewing the data
presented in Table 2, which presents a wide range of biomass stock values and also those for the carbon content, which therefore also affects the C stock values.
However, it should be noted that the wide range of values, which demonstrate high variability, a characteristic also mentioned by Aduan and Vilela, Klink, (2003) and Watzlawick et al. (2012), even taken just a single fragment (Morais et al., 2013), hinders comparison with other studies. It occurs due to the both scarce and available data, even in those studies already cited, in which almost was employed different procedures for collection as well as data analysis methods (Caldeira et al., 2008; Watzlawick et al., 2012).
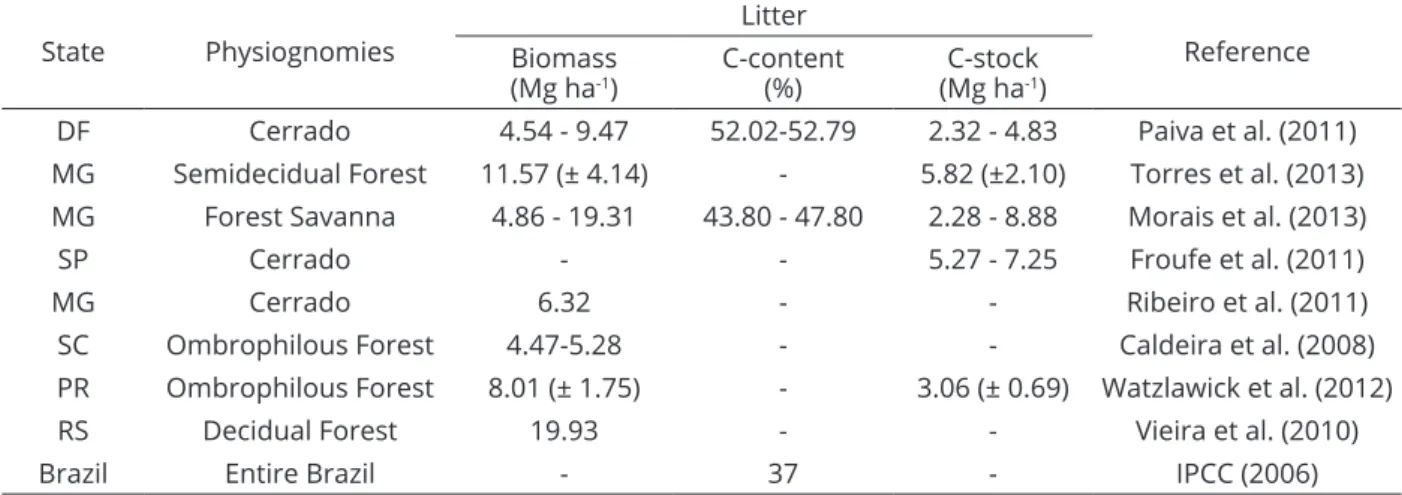
To decrease the amplitude, average values per vegetation type were generated (Table 3), and the values are similar to those shown in other studies (IPCC 2006; Caldeira et al., 2008; Vieira et al., 2010; Froufe et al., 2011; Paiva et al., 2011; Ribeiro et al., 2011; Watzlawick et al., 2012; Morais et al., 2013; Torres et al., 2013) for various vegetation types. The differences among the averages for physiognomies correlated with the number of trees and biomass stock, which means the higher the values of these characteristics, the higher
the stocks of biomass and C in the litter. In Table 4, values of biomass, C-stock and carbon content for the litter from different physiognomies in Brazil are also presented.
The range of values is given by the litter formation process, which is a complex interaction among edafo-climatic factors, source material, trees density and species composition, among others (Yang et al., 2005; Cunha; Gama Rodrigues, 2014; White et al., 2013). Wtzlawick et al. (2012) and O’Connell and Sakan (1997) related that the low level of nutrients accumulated in the litter and the soil water deficit are the factors more unfavorable to decomposition, both intrinsic characteristics of the Brazilian Cerrado biome.
Litter carbon stock mapping
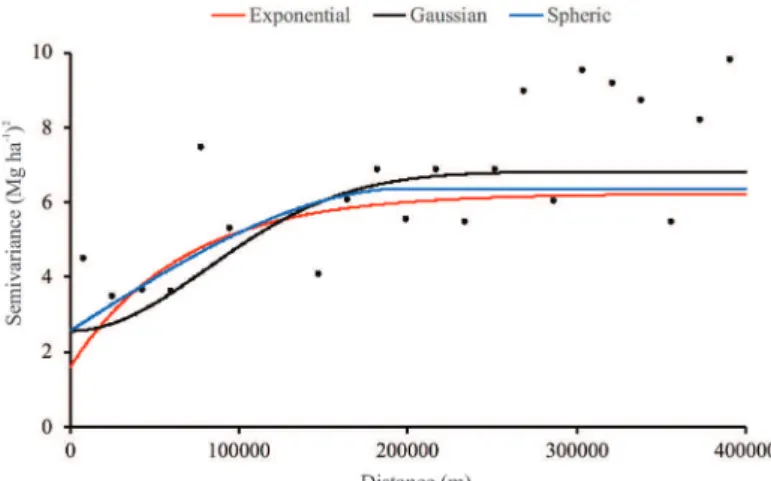
After variogram analysis, it was found that was possible to fit spatial models to describe the semivariance in function of distance, meaning the existence of spatial dependence. Thus, Exponential, Gaussian and Spherical models were adjusted (Figure 2). All three models showed good fit, proving that there is a structural function, which was possible to be modeled. The parameters of the fitted models are shown in Table 5 as well as the statistical
Physiognomy Litter
Biomass (Mg ha-1) C (%) C Stock (Mg ha-1)
SG 6.00 (± 2.27) 39.95 (± 6.85) 2.47 (± 1.31)
CE 8.45 (± 3.69) 44.10 (± 2.24) 3.74 (± 1.71)
FS 11.45 (± 6.13) 40.79 (± 0.49) 4.68 (± 2.52)
State Physiognomies
Litter
Reference Biomass
(Mg ha-1) C-content (%) (Mg haC-stock -1)
DF Cerrado 4.54 - 9.47 52.02-52.79 2.32 - 4.83 Paiva et al. (2011)
MG Semidecidual Forest 11.57 (± 4.14) - 5.82 (±2.10) Torres et al. (2013)
MG Forest Savanna 4.86 - 19.31 43.80 - 47.80 2.28 - 8.88 Morais et al. (2013)
SP Cerrado - - 5.27 - 7.25 Froufe et al. (2011)
MG Cerrado 6.32 - - Ribeiro et al. (2011)
SC Ombrophilous Forest 4.47-5.28 - - Caldeira et al. (2008)
PR Ombrophilous Forest 8.01 (± 1.75) - 3.06 (± 0.69) Watzlawick et al. (2012)
RS Decidual Forest 19.93 - - Vieira et al. (2010)
Brazil Entire Brazil - 37 - IPCC (2006)
Table 3: Average values and standard deviation of carbon biomass content and C-stock in the litter of the Cerrado
biome and its different physiognomies studied in Minas Gerais state.
Table 4: Biomass, C-stock and C content for litter from different physiognomies in Brazil.
DF: “Brazilian Federal District”; MG: Minas Gerais State; SP: São Paulo State; SC: Santa Catarina State; PR: Paraná State; RS: Rio
precision based on the cross-validation outputs from the three semivariogram models tested.
Based on these statistics obtained from cross validation (Table 5), it was possible to choose the model with the best performance that will be used in the kriging process. We found that the Spherical model showed less
reduced mean deviation and reduced standard deviation of
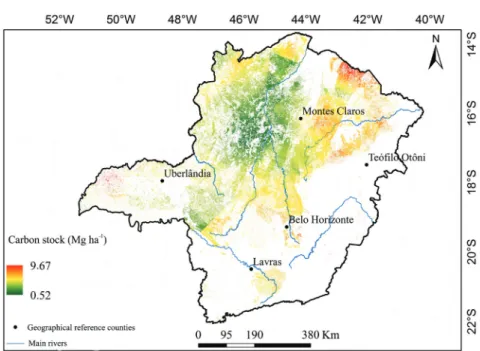
the mean close to 1, thus, this model was used to perform
the kriging map for the litter C-stock in Minas Gerais state. The kriging map for litter C-stock was generated using the Spherical model parameters (Table 5) and is shown in Figure 3. The northeast and west regions of Minas Gerais showed higher values. The first presents remnants of deciduous forests and transitions for another biome, however, this region has more species that tend to lose greater amounts of leaves during the dry season, a typical characteristic situation for these vegetation types and the weather hot and dry, which require biological strategies for survival. This vegetation is highly susceptible to burning (forest fire), which is responsible for emission of approximately 4 Pg C year-1 in the tropical and subtropical
regions (27% of all over South America) (Maraseni et al.,
2016). Thus, the litter has a high contribution to biomass and, consequently, to C-stock, thus, its burning represents a very high percentage of contribution for CO2 emissions,
being one of the most important environmental concern of the Minas Gerais state. The west region has Forest Savanna remnants, which correspond vegetation types with the greatest number of trees and larger trees, therefore also responsible for a high amount of biomass and number of leaves falling to the ground in the winter. In addition, there are also humid conditions more favorable for decomposition of the raw material that forms the litter (Valentine et al., 2008), which reduces the carbon concentration.
Regions with lower C-stock (green area on the map) correspond to Savanna Grassland and Cerrado
Strictu Sensu vegetation type. These are described as areas
with few small trees, both in height and in crown size. Therefore, with lower leaf volume and less contribution to biomass deposited in the ground and consequently lower litter C-stock (Figure 3). However, these Cerrado species present a lower decomposition rate (Valentine et al., 2008), which favors the maintenance of C in the litter accumulated on the ground and onto the soils.
Nugget effect (τ2), structured variation (σ2), landing (τ2 + σ2), reduced mean deviation (RMD) and reduced standard deviation of
the mean (SD).
Model τ2 σ2 τ2+σ2 Range (Km) RMD SD
Exponential 1.57 4.65 6.22 240 -0.0004430 1.7067
Spherical 2.54 3.81 6.35 120 0.0001743 1.3574
Gaussian 2.55 4.27 6.82 171 0.0015833 1.3738
Spatial distribution of the litter carbon stock in the Cerrado biome in Minas Gerais state, Brazil 587
Ciência e Agrotecnologia, 41(5):580-589, Sep/Oct. 2017 Considering the data published on the SEEG Brazil
(2017), the total C stocked in the litter of Cerrado biome has been equivalent to 4.5% of the CO2 emitted by Minas Gerais
state between 1990 and 2015, thus, its adequate management is fundamental to keep this biome as a very important carbon sunk not only for the studied state but also for Brazil.
CONCLUSIONS
It was possible to detect a high variability in the characteristics evaluated, carbon biomass, content and stock in the Cerrado biome litter in Minas Gerais, state, Brazil. The carbon content was the characteristic that had the lowest variability, with a range of 40-44%, so that it is not a critical attribute to account for the litter C-stock. The Savanna Grassland has the lowest C-stock, and the Savanna Forest, the highest. C-stock presents a considerable spatial structure dependence, allowing to make use of geostatistical procedures to map it in the Cerrado biome of the Minas Gerais state. In addition, kriging C-stock map showed good accuracy, being possible to verify that the lowest litter C-stocks are found from the center to the north of Minas Gerais state since the climate is hotter in this direction.
ACKNOWLEDGEMENTS
The authors thank the coordinators of the Inventário florestal de Minas Gerais, for the availability of data used in this study. Also, to Fundação de Amparo à Pesquisa do
Estado de Minas Gerais - FAPEMIG (Processo CAG - APQ-00291-11) and the Coordenação do Aperfeiçoamento de Pessoal de Nível Superior - CAPES, for granting the Doctoral scholarship to the 1st author. Special thanks to the entire team of students and trainees of UFLA/DCF/ LEMAF and other professionals in the field and in the lab, who contributed to sample collection and generation of data used in this study.
REFERENCES
ADUAN, E. A.; VILELA, M. F.; KLINK, C. A. Ciclagem de carbono em ecossistemas terrestres: O caso do cerrado brasileiro.
Planaltina, DF, Embrapa Cerrados, 2003. 330p.
AHMED, S.; MARSILY, G. DE. Comparison of geostatistical
methods for stimating transmissivity using data on
transmissivity and specific capacity. Water Resources Research, 23(9):1717-1737, 1987.
ANGULO-MARTINEZ, M. et al. Mapping rainfall erosivity at a
regional scale: A comparision of interpolation methods in
the Ebro Basin (NE Spain). Hidrology and Earth System Science, 13:1907-1920, 2009.
AVILA, L. F. et al. Tendências de temperaturas mínimas e máximas do ar no Estado de Minas Gerais. Pesquisa Agropecuária Brasileira, 49(4):247-256, 2014.
BELLOTE, A. F. J.; DEDECEK, R. A.; SILVA, H. D. da. Nutrientes minerais, biomassa e deposição de serrapilheira em
plantio de Eucalyptus com diferentes sistemas de manejo
de resíduos florestais. Pesquisa Florestal Brasileira,
56:31-41, 2008.
BOWDEN, R. D. et al. Litter input controls soil carbon in
temperate deciduous forest. Soil Science Society of
American Journal, 78:66-75, 2014.
BRASIL. Ministério da Ciência e Tecnologia. Segundo inventário brasileiro de emissões e remoções antrópicas de gases de efeito estufa: Emissões de gases de efeito estufa no setor uso da terra, mudanças do uso da terra. Brasília, 2010. Available in: <http://www.mct.gov.
br/upd_blob/0215/215990.pdf>. Access in: Dec, 21, 2011.
CALDEIRA, M. V. W. et al. Quantification of litter and nutrientes
on an Atlantic Rain Forest. Semina: Ciências Agrárias,
29:53-68, 2008.
CAMBARDELLA, C. A. et al. Field scale variability of soil properties incentral Iowa soils. Soil Science Society of America Journal, 58:1501-1511, 1994.
CARREIRA, R. C.; RONDON, J. N.; ZAIDAN, L. B. P. Produção de serrapilheira em uma área de cerrado de Mogi Guaçu, SP. São Paulo: Instituto de Botânica, 2006. 11p.
CARVALHO, L. G. et al. Zoneamento ecológico-econômico do estado de Minas Gerais: Componentes geofísico e biótico.
Lavras: UFLA, 2008. p.89-101.
CARVALHO, L. M. T. et al. Análises espaciais e estatísticas da flora nativa em Minas Gerais.In: CARVALHO, L. M. T.; SCOLFORO, J. R. Monitoramento da flora nativa. Lavras:
UFLA, 2008. p.25-316.
CONANT, R. T. et al. Temperature and soil organic matter decomposition rates - Synthesis of current knowledge and a way forward. Global Change Biology, 17(11):3392-3404, 2011.
CUNHA, G. M.; GAMA-RODRIGUES, A. C. Does nutrient cycling differ between fragments of Atlantic Forest with distinct
structural aspects? A case study in the state of Rio de
Janeiro, Brazil. Acta Botanica Brasilica, 28(4):609-616, 2014.
CURI, N. et al. Solos, geologia, relevo e mineração. In: SCOLFORO, J. R.; CARVALHO, L. M. T.; OLIVEIRA, A. D. (Ed.).
Zoneamento ecológico-econômico do Estado de Minas Gerais: Componentes geofísico e biótico. Lavras: UFLA,
2008. p.73-88.
ENVIRONMENTAL SYSTEMS RESEARCH INSTITUTE. ArcGIS 9:
Getting Started with ArcGIS, Redlands, 2004. 265p.
FROUFE, L. C. M. et al. Potencial de sistemas agroflorestais multiestrata para sequestro de carbono em áreas de ocorrência de Floresta Atlântica. Pesquisa Florestal Brasileira, 31:143-154, 2011.
GREGORICH, E. G. et al, Litter decay controlled by temperature, not soil properties, affecting future soil carbon. Global Change Biology, 23(4):1725-1734, 2016.
HENGL, T.; HEUVELINK, G. M. B.; ROSSITER, D. G. About regression-kriging: From equations to case studies.
Computers & Geosciences, 33:1301-1315, 2007.
INTERGOVERNMENTAL PANEL ON CLIMATE CHANGE - IPCC.
Guidelines for National Greenhouse Gas Inventories: Agriculture, forestry and other land use.Japan: Institute
for Global Environmental Strategies (IGES), 2006.
ISAAKS, E. H.; SRIVASTAVA, R. M.Applied Geostatistics. Oxford:
Oxford University Press. 1989. 561p.
LAJTHA, K. et al. Changes to particulate versus mineral-associated soil carbon after 50 years of litter manipulation in forest and prairie experimental ecosystems, Biogeochemistry,
119:341-360, 2014a.
LAJTHA, K. et al. Litter and root manipulations provide insights into soil organic matter dynamics and stability, Soil Science Society of America Journal, 78:261-269, 2014b.
LEFF, J. W. et al. Experimental litterfall manipulation drives large and rapid changes in soil carbon cycling in a wet tropical
forest. Global Change Biology, 18:2969-2979, 2012.
MARASENI, T. N. et al. Savana burning methodology for fire management and emissions reduction: A critical review of influencing factors. Carbon Balance and Management,
11:25, 2016.
MATTHEWS, H. D. et al, National contributions to observed global warming. Environmental Research Letter, 9:1-9, 2014.
MELLO, C. R. et al. Interpolation methods for improving the RUSLE R-factor mapping in Brazil. Journal of Soil and Water Conservation, 70:182-197, 2015.
MELLO, C. R. et al. Multivariate models for annual rainfall
erosivity in Brazil. Geoderma, 202:88-102, 2013.
MORAIS, V. A. et al. Carbon and biomass stocks in a fragmente
of cerradão in Minas Gerais state, Brazil. Cerne,
Spatial distribution of the litter carbon stock in the Cerrado biome in Minas Gerais state, Brazil 589
Ciência e Agrotecnologia, 41(5):580-589, Sep/Oct. 2017 O’CONNELL, A. M.; SANKARAN, K. V. Organic matter accretion,
decomposition and mineralisation. In: NAMBIAR, E. K. S.; BROWN, A. G. (Ed.) Management of soil, nutrients and water in tropical plantations forests.Canberra: ACIAR
Australia/CSIRO, 1997. p.443-480.
OLIVEIRA FILHO, A. T. et al. Definição e delimitação de domínios e subdomínios das paisagens naturais do estado de Minas Gerais. In: SCOLFORO, J. R.; CARVALHO, L. M. T. (Ed.).
Mapeamento e Inventário da Flora e dos Reflorestamentos
de Minas Gerais. Lavras: UFLA, 2006. cap. 1, p.21-35.
PAIVA, A. O.; FARIA, G. E. de. Estoque de carbono do solo sob
Cerrado Sensu Stricto no Distrito Federal, Brasil. Revista Tropica - Ciências Agrárias e Biológicas, 01:59-65, 2007.
PAIVA, A. O. et al. Estoque de carbono em cerrado Sensu Stricto do Distrito Federal. Revista Árvore, 35(3):527-538, 2011.
R CORE TEAM. R: A language and environment for statistical computing. R Foundation for Statistical Computing, Vienna, Austria. 2013.
REZENDE, A. V. et al. Comparison of mathematical models to volume, biomass and carbon stock estimation of the woody
vegetation of a Cerrado Sensu Stricto in Brasília, DF. Scientia Forestalis, 71:65-76, 2006.
RIBEIRO, S. C. et al. Above-and belowgriund biomass in a
Brazilian Cerrado. Forest Ecology and Management,
262:491-499, 2011.
RUFINI, A. L. et al. Equações volumétricas para o cerrado Sensu Stricto em Minas Gerais. Cerne, Lavras, 16 (1):1-11, 2010.
SCOLFORO, J. R. et al. Volumetria, peso de matéria seca e carbono. In: SCOLFORO, J. R.; MELLO, J. M. de; OLIVEIRA, A. D.
CERRADO: Florística, estrutura, diversidade, similaridade,
distribuição diamétrica e de altura, volumetria, tendências de crescimento e áreas aptas para manejo florestal. Lavras: Editora UFLA, 2008a, p.361-438.
SCOLFORO, J. R. et al. Amostragem e caracterização dos fragmentos inventariados. In: SCOLFORO, J. R.; MELLO, J. M. de; OLIVEIRA, A. D. CERRADO: Florística, estrutura,
diversidade, similaridade, distribuição diamétrica e de altura, volumetria, tendências de crescimento e áreas aptas para manejo florestal. Lavras: Editora UFLA, 2008b, p.1-78.
SCOLFORO, H. F. et al. Spatial distribution of aboveground carbon stock of the arboreal vegetation in Brazilian biomes
of Savanna, Atlantic Forest and Semi Arid Woodland. Plos
One, 10(6):1-20, 2015.
SCOLFORO, H. F. et al. Spatial interpolators for improving the mapping of carbon stock of the arboreal vegetation in Brazilian biomes of Atlantic forest and Savanna. Forest Ecology and Management, 376:24-35, 2016.
SISTEMA DE ESTIMATIVA DE EMISSÕES DE GASES DE EFEITO
ESTUFA. Emissões totais. 2016. Available in: <http://
plataforma.seeg.eco.br/total_emission>. Access in: Jan.
2017.
SILVA, C. J. et al. Contribuição de folhas na formação de serrapilheira e no retorno de nutrientes em florestas de
transição no norte de Mato Grosso. Acta Amazônica,
39:591-600, 2009.
SILVA, C. J. et al. Produção de serrapilheira no Cerrado e Floresta de Transição Amazônia-Cerrado do Centro-Oeste
Brasileiro. Acta Amazônica, 37:543-548, 2007.
TANNER, E. V. J.; SHELDRAKE, M. W. A.; TURNER, B. L. Changes in soil carbon and nutrients following 6 years of litter removal and addition in a tropical semi-evergreen rain
forest. Biogeosciences, 13:6183-6190, 2016.
TORRES, C. M. E. et al. Quantificação de biomassa e estocagem de carbono em uma Floresta Estacional semidecidual, no Parque Tecnológico de Viçosa, MG. Revista Árvore, 37(4):
647-655, 2013.
VALENTI, M. W.; CIANCIARUSO, M. V.; BATALHA, M. A. Seasonal
of litterfall and leaf decomposition in a Cerrado site. Brazilian Journal of Biology, 68(3):459, 2008.
VIEIRA, M. et al. Nutrientes na serrapilheira em um fragmento de Floresta Estacional decidual, Itaara, RS. Ciência Florestal, 20(4):611-619, 2010.
WATZLAWICK, L. F. et al. Estoque de biomassa e carbono na Floresta Ombrófila Mista Montana, Paraná. Scientia Forestalis, 40(95):353-362, 2012.
WHITE, B. L. A. et al. Dynamics of the production and decomposition of litterfall in a brazilian northeastern tropical forest (Serra de Itabaiana National Park, Sergipe
State). Acta Scientiarum. Biological Sciences,
35(2):195-201, 2013.
YANG, Y. S. et al. Litter production, seasonal pattern and nutrient return in seven natural forests compared with
a plantation in southern China. Forestry, 78:403-415,