An improved method for RNA extraction from
common bean seeds and validation of reference
genes for qPCR
Wendell Jacinto Pereira
1,2, Priscila Zaczuk Bassinello
3, Claudio
Brondani
4and Rosana Pereira Vianello
4*Abstract: An RNA extraction method with high integrity and purity as well as the selection of adequate reference genes are prerequisites for gene expression analysis. For common bean seeds, there is no well-defined protocol that can be used in a laboratory routine for gene expression analysis. In this study, an extraction protocol for RNA from common bean seeds, which produced material with good integrity for qPCR (RIN ≥ 6.5), was optimized. In addition, 10 reference genes were evaluated under qPCR standard conditions using different tissue samples of common beans. Gene stabilities were analyzed using the delta-CT method, Bestkeeper, NormFinder and geNorm approaches. The genes β-tubulin and T197 were ranked as the most stable among the sample sets evaluated with different tissue samples, while PvAct and Pv18S were the least stable. To our knowledge, this is the first study evaluating RNA isolation methods and reference gene selection for seeds of Phaseolus vulgaris.
Key words: Gene expression; Gene normalization; Grain RNA extraction;
Pha-seolus vulgaris; Molecular Breeding.
Crop Breeding and Applied Biotechnology 17: 150-158, 2017 Brazilian Society of Plant Breeding. Printed in Brazil
http://dx.doi.org/10.1590/1984-70332017v17n2a22 ARTICLE
*Corresponding author: E-mail: [email protected]
Received: 09 December 2016 Accepted: 04 January 2017
1 Universidade Federal de Goiás, Instituto de
Ciências Biológicas, 74.001-970, Goiânia, GO,
Brazil 2 Universidade de Brasília, Departamento de
Biologia Celular, 70910-900, Brasília, DF, Brazil
3 Embrapa Arroz e Feijão, Laboratório de
Grãos e Subprodutos, Rodovia GO-462, km 12, Fazenda Capivara, Zona Rural, 75375-000, Santo Antônio de Goiás, GO, Brazil 4 Embrapa Arroz e Feijão, Laboratório de
Biotecnologia INTRODUCTION
Experimental validation of gene transcription data is usually performed using real-time quantitative polymerase chain reaction (qPCR), which involves
amplifying in vitro copies of complementary DNA (cDNA) from an RNA template
and monitoring the levels of the molecules produced during each cycle in real time (Heid et al. 1996). The advantages of this method include speed, specificity and sensitivity for amplifying the target fragment through relative and absolute transcribed gene quantification (Hu et al. 2014). The qPCR technique has been considered the gold standard for quantifying gene expression since many factors, such as the quality and integrity of the extracted RNA, sample storage, and the
correct choice of internal controls, are considered to avoid obtaining biased
and/or misleading results (Dheda et al. 2005).
conducted for different species (Christou et al. 2014, Ma et al. 2015). For the common bean, RNA extraction methods from leaves and roots have been established, which have been based on either commercial kits (Contour-Ansel et al. 2010) or not (Borges et al. 2012). However, a well-defined RNA extraction protocol for common bean grain/seed tissue is not available and, among legumes, there is just one protocol that was created for soybean seeds (Yin et al. 2014).
Because extraction of high-quality RNA and identification of reference genes are among the most important factors for reliable qPCR experiments, we aimed in this paper to establish a suitable RNA extraction method for common bean seeds. Additionally, we evaluated a set of reference genes previously described in the literature, optimized the qPCR conditions and determined the most adequate method for qPCR analysis in different tissues of common beans and under variable experimental conditions.
MATERIAL AND METHODS
Plant samples
Seeds from six cultivars of common bean of the Carioca grain type were used: BRSMG Madrepérola, BRS Pontal, Pérola, BRS Estilo, CNFC10467 and Pinto Beans. Plants were grown in a field from August to October 2014, and the plots consisted of 10 rows that were each five meters in length in Santo Antônio de Goiás - GO, Brazil. After harvesting, the seeds were dried at room temperature (21 °C), processed and stored at -80 °C until use. Aiming to define stable reference genes across different types of common bean tissue in addition to seeds, RNA samples were used from the leaves and roots of Pérola and BAT477 that were cultivated under drought stress and the leaves of BRS Realce and BRS Executivo that were inoculated with the fungus Colletotrichum lindemuthianum.
Seed total RNA extraction
The total RNA from mature seeds of the six cultivars was extracted using three different protocols: 1) based on TRIzol® RNA Isolation Reagents (Invitrogen™, Carlsbad, California) following the manufacturer’s instructions; 2) a commercial kit, PureLink® RNA Mini Kit (Ambion®, Carlsbad, California), which is based on a column extraction method, following
the manufacturer’s instructions and 3) a protocol proposed by Silva et al. (2011) for coffee seeds, with adaptations as described below. The ground seeds (150 mg, five grains on average) were transferred to 1.5 mL tubes, then 1000 μL of Concert™ Plant RNA Reagent (Invitrogen™, Carlsbad, California) was added and the samples were homogenized by vortexing for 2 min. Subsequently, the tubes were incubated horizontally at room temperature (21 °C) for 5 min. Next, the samples were centrifuged at 11,400 rpm for 2 min at room temperature, and the supernatant was subsequently removed and transferred to fresh tubes. The supernatant was treated with 100 μL of 1.5 mol L-1 NaCl and homogenized
by inverting the tube eighty times. Thereafter, 300 μL of chloroform was added and homogenized by inverting the tube eighty times. The tubes were then centrifuged for 10 min at 11,400 rpm at 4 °C; the upper phase was recovered and transferred to a new tube. Then, 500 μL of the lysing reagent (Concert™ Plant RNA Reagent) was added to the recovered upper phase, and the initial extraction procedures were repeated. The centrifugation step was repeated, and the final supernatant was extracted; then, 500 μL of isopropanol was added, and the tubes were inverted eighty tubes. The tubes were incubated at room temperature for 10 min. The precipitate was recovered by centrifugation at 11,400 rpm for 10 min at 4 °C followed by washing with 1000 μL of 75% cold ethanol and centrifugation at 11,400 rpm for 1 min at room temperature. To the dried precipitate, 70 μL of autoclaved Diethylpyrocarbonate (DEPC) water was added followed by storage at -80 °C. Three technical replicates were used for each sample. The total RNA extraction from leaves and roots was performed using the PureLink® RNA Mini Kit (Ambion®, Carlsbad, California).
RNA quality control and synthesis of complementary DNA (cDNA)
The quantity and purity of each RNA sample was estimated using a NanoVue™ Plus Spectrophotometer (General Electric Company, GE). Additionally, an RNA integrity number (RIN) was verified with an Agilent 2100 Bioanalyzer (General Electric Company, GE). RNA samples were treated with DNase I (Invitrogen™, Carlsbad, California) following the manufacturer’s guidelines. Subsequently, the RNA was transcribed into cDNA using SuperScript® II Reverse Transcriptase
(Invitrogen™, Carlsbad, California), as directed by the manufacturer. The cDNA was quantified using a Qubit® ssDNA
Optimization of primer concentration for qPCR
The primer sequences corresponding to the target reference genes in different plants were obtained through a literature search (Table 1). Each primer was individually tested for amplification and specificity. The PCR reaction was conducted as described by Müller et al. (2014), and the amplified products were visualized on a 2.0% agarose gel.
For the primer titration, a matrix of reactions was created. A total of 9 reactions were performed varying the concentration of each primer (forward and reverse) independently (50, 300, and 900 nM) to determine the best quantification cycle (Cq) values that avoided primer dimer formation. The reactions were conducted in duplicate using
Real Master SYBR ROX Mix (5 Prime, Gaithersburg, Maryland) and 10 ng of cDNA in a final volume of 20 μL, as suggested by the manufacturer. The thermocycling conditions included one cycle at 94 °C for 2 min followed by 40 cycles at 95 °C for 15 sec and 60 °C for 1 min. The qPCR was performed on an ABI7500 Real Time PCR (Life TechnologiesTM).
A dissociation curve based on a melting temperature analysis (Tm) was generated and analyzed using the 7500 software v2.0.5. The Sequence Detection Software (SDS) v.1.3 (Applied Biosystems) was used to calculate the cycle threshold (Ct). Two methods were used to evaluate the amplification efficiencies: 1) a standard curve based on a serial
cDNA dilution (128, 64, 32, 16, 8, 4 and 2 ng) and 2) linear regression within the window-of-linearity by the LinRegPCR
software (Ruijter et al. 2009).
Gene expression stability
The Cq values were used to determine the reference gene stability using a variety of methods: Delta-CT (Silver et al. 2006), NormFinder (Andersen et al. 2004), geNorm (Vandesompele et al. 2002) and BestKeeper (Pfaffl et al. 2004). The web-based tool RefFinder (Xie et al. 2012) was used to integrate the results of these programs and to generate the final ranking of the tested reference genes.
RESULTS AND DISCUSSION
Several methods to remove polysaccharide and protein contamination from plant RNA have been developed, as described for seeds containing high levels of starch (Li and Trick 2005) and soybean seeds (Yin et al. 2014). In this report,
Table 1. Candidate genes for qPCR analyses with their respective nomenclature and bibliographic citation, GenBank accession number,
gene description, primer sequence (forward and reverse) and product size in base pairs (bp)
Gene name Accession nº Gene description Origin of primers Primer sequences (forward/reverse)5’- 3’ Size (pb)
Cons 6 (Libault et al. 2008) CD397253 F-box protein family soybean AGATAGGGAAATGGTGCAGGT 93
CTAATGGCAATTGCAGCTCTC
Cons 7 (Libault et al. 2008) AW310136 Insulin-degrading enzyme, Metalloprotease soybean ATGAATGACGGTTCCCATGTA 114
GGCATTAAGGCAGCTCACTCT
Cons 15 (Libault et al. 2008) AW396185 CDPK-related protein kinase soybean TAAAGAGCACCATGCCTATCC 97
TGGTTATGTGAGCAGATGCAA
Pv18S (Santos et al. 2005) AF207040 18S ribosomal RNA cocoa AACGGCTACCACATCCAAGG 393
TCATTACTCCGATCCCGAAG
PvAct (Chen et al. 2009) --- Actin bean GAAGTTCTCTTCCAACCATCC
---TTTCCTTGCTCATTCTGTCCG
PvUBC9 (Ramírez et al. 2013) TC34057 Ubiquitin bean GCTCTCCATTTGCTCCCTGTT 66
TGAGCAATTTCAGGCACCAA
T197 (Thibivilliers et al. 2009) --- Guanine nucleotide-binding protein beta subunit-like protein
bean TGGGCAATTGGACGTTATTAG 80 to 125
GCCACGGTCTTGAACATAAAA
Tc127 (Thibivilliers et al. 2009) Q39257 Ubiquitin bean CCAAGGAACTTCAGATTGCTG 80 to 125
GTCATCACCATCATCCATTCC
Tc185 (Thibivilliers et al. 2009) --- Tubulin beta chain bean TTTGGACAACGAGGCTCTCTA 80 a 125
GAGATGGTTAAGGTCCCCAAA
β-tubulin (Eticha et al. 2010) CV530631 β-tubulin bean CCGTTGTGGAGCCTTACAAT 117
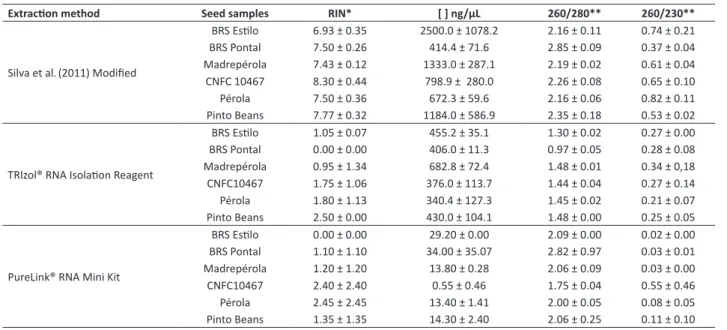
three different protocols were used based on their reported impact in the literature. The procedures based on the TRIzol® and column purifications (PureLink®) did not generate RNA from seeds with sufficient purity and integrity for
subsequent qPCR analyses (Table 2). The resulting 260/280 ratio (1.8-2.0 desired as an indication of purity) was below 1.5 for the TRIzol® reagent. For the 260/230 ratio (1.8-2.0 desired as an indication of purity), the values obtained were
below 0.3 for both TRIzol® and PureLink® reagents, and the RIN values were below 2.6 for all samples.
The adapted protocol from Silva et al. (2011), based on an isolation procedure using the organic solvents phenol and chloroform, in addition to various mixing steps (extremely important for tissue homogenization), allowed the insoluble material to be removed from the samples (as polysaccharides and proteins). The 260/280 ratio obtained was adequate (≥ 2.0). The extraction of high-purity RNA is challenge because of the high protein and carbohydrate content in common bean seeds which might be difficult to remove from samples. The secondary metabolites can either interact with or intercalate in RNA, or taken together during the extraction process due to reagent affinity, which reduce the yield and quality of the RNA. The amounts of these compounds may vary widely among common bean genotypes, reaching values of 32% protein and 23% carbohydrate in the seeds (Brigide et al. 2014). The optimized protocol was efficient at removing these organic compounds. For the 260/230 ratio, low values were obtained (ranging from 0.37 to 0.82) revealing remains of solvents or salts in the RNA solution. These impurities did not compromise the reliability of the qPCR results in this
Table 2. Summary of the common bean seed RNA profile based on the three extraction methods
Extraction method Seed samples RIN* [ ] ng/μL 260/280** 260/230**
Silva et al.(2011) Modified
BRS Estilo 6.93 ± 0.35 2500.0 ± 1078.2 2.16 ± 0.11 0.74 ± 0.21
BRS Pontal 7.50 ± 0.26 414.4 ± 71.6 2.85 ± 0.09 0.37 ± 0.04
Madrepérola 7.43 ± 0.12 1333.0 ± 287.1 2.19 ± 0.02 0.61 ± 0.04 CNFC 10467 8.30 ± 0.44 798.9 ± 280.0 2.26 ± 0.08 0.65 ± 0.10
Pérola 7.50 ± 0.36 672.3 ± 59.6 2.16 ± 0.06 0.82 ± 0.11
Pinto Beans 7.77 ± 0.32 1184.0 ± 586.9 2.35 ± 0.18 0.53 ± 0.02
TRIzol® RNA Isolation Reagent
BRS Estilo 1.05 ± 0.07 455.2 ± 35.1 1.30 ± 0.02 0.27 ± 0.00
BRS Pontal 0.00 ± 0.00 406.0 ± 11.3 0.97 ± 0.05 0.28 ± 0.08
Madrepérola 0.95 ± 1.34 682.8 ± 72.4 1.48 ± 0.01 0.34 ± 0,18 CNFC10467 1.75 ± 1.06 376.0 ± 113.7 1.44 ± 0.04 0.27 ± 0.14
Pérola 1.80 ± 1.13 340.4 ± 127.3 1.45 ± 0.02 0.21 ± 0.07
Pinto Beans 2.50 ± 0.00 430.0 ± 104.1 1.48 ± 0.00 0.25 ± 0.05
PureLink® RNA Mini Kit
BRS Estilo 0.00 ± 0.00 29.20 ± 0.00 2.09 ± 0.00 0.02 ± 0.00
BRS Pontal 1.10 ± 1.10 34.00 ± 35.07 2.82 ± 0.97 0.03 ± 0.01
Madrepérola 1.20 ± 1.20 13.80 ± 0.28 2.06 ± 0.09 0.03 ± 0.00 CNFC10467 2.40 ± 2.40 0.55 ± 0.46 1.75 ± 0.04 0.55 ± 0.46
Pérola 2.45 ± 2.45 13.40 ± 1.41 2.00 ± 0.05 0.08 ± 0.05
Pinto Beans 1.35 ± 1.35 14.30 ± 2.40 2.06 ± 0.25 0.11 ± 0.10
* Values higher than 6.5 were considered adequate ** Desired values ≥ 1.8 and ≤ 2.2
Table 3. Performance evaluation of qPCR for the five selected candidate genes in leaf/root pooled cDNA and seed cDNA
Genes Tissue (Standard curve)r2 Standard curve am-plification factor (Standard curve)%Eff (LinRegPCR)r2 LinRegPCR mean Efficiency (LinRegPCR)%Eff
Pv18S leaf/root 0.997 ± 0.00 1.64 ± 0.00 63.98 ± 0,51 ≥ 0.999 1.55 ± 0.02 55.32 ± 2.63
seed 0.999 ± 0.00 1.66 ± 0.06 65.72 ± 5,64 ≥ 0.999 1.57 ± 0.03 56.96 ± 2.91
β-tubulin leaf/root 0.997 ± 0.00 1.97 ± 0.01 96.75 ± 1,38 ≥ 0.999 1.85 ± 0.02 85.43 ± 1.88
seed 0.991 ± 0.01 2.03 ± 0.03 103.02 ± 3,07 ≥ 0.999 1.85 ± 0.08 84.76 ± 8.09
PvAct leaf/root 0.991 ± 0.01 1.96 ± 1.11 95.30 ± 10,45 ≥ 0.999 1.67 ± 0.02 66.94 ± 2.22
seed 0.960 ± 0.03 1.95 ± 0.04 95.22 ± 3,93 ≥ 0.999 1.65 ± 0.06 64.93 ± 5.92
Tc127 leaf/root 0.996 ± 0.00 1.96 ± 0.01 95.62 ± 0,45 ≥ 0.999 1.83 ± 0.01 82.97 ± 1.26
seed 0.997 ± 0.00 1.97 ± 0.03 97.01 ± 2,27 ≥ 0.999 1.84 ± 0.01 84.01 ± 1.32
T197 leaf/root 0.993 ± 0.00 2.01 ± 0.02 100.67 ± 2,09 ≥ 0.999 1.93 ± 0.04 93.33 ± 3.48
study; this finding is consistent with previous reports in the literature (Cincinnati et al. 2008, Yee et al. 2014). The RIN values ranged from 6.93 to 8.30 (Table 2) and the efficiency of the qPCR reactions was high, as demonstrated by the test of efficiency (Table 3), being used in this study as the criteria for a protocol selection. Most studies have considered the RNA integrity using the RIN algorithm.
Reference genes for qPCR
Concerning the reference genes available for common beans, this work does not intend to confirm information already described in the literature, but rather intends to provide additional guidance on working with common bean reference genes. The purpose is to allow readers access to the most appropriate genes to be used for different plant tissues and the qPCR amplification conditions fundamental to conducting routine laboratory analysis. Important steps of the research process, not available in the published literature, such as primer titrations and a determination of suitability across different tissue samples with strong statistical support, were provided in the present study. Of the genes that were evaluated (Table 1), only the gene Const15 did not generate an amplified product. It is a constitutive gene of soybeans, and an amplified product may be obtained by redesigning the primer sequences using the reference common bean genome. From the remaining 9 genes, four genes presented the formation of a secondary structure, as demonstrated by the dissociation curve, indicating the need to design new sets of primers for these genes. This optimization step for qPCR conditions, implemented in the present study, was fundamental for the development of a robust assay, which ensures reproducibility between replicates. Of the five remaining primers suitable for evaluation as reference genes (Pv18S, β-tubulin, PvAct, Tc127, T197) of leaf, root and seed tissues, four primers were derived from
bean genomic sequences and one from cocoa.
The values of PCR efficiency ranged from 63 to 103% based on the standard curve (Table 3). Although the method
based on the standard curve remains reliable and broadly used (Svec et al. 2015), it often results in unrealistic values
greater than 100% for qPCR efficiency. As described by Peirson et al. (2003), several analytical procedures could result in a cumulative error that might lead to efficiency overestimation. To overcome these limitations, mathematical models have been published describing the kinetics of the qPCR reaction and trying to estimate qPCR efficiency from a single reaction (Robledo et al. 2014). The methodology implemented by the LinRegPCR software used in the present study resulted in values of qPCR efficiency ranging from 55 to 94%, which are reduced values compared to the standard curve. The qPCR efficiency was similar, and even higher, for the seed samples compared to the leaf/root samples, using both the standard curve method and LinRegPCR (Table 3). Based on the standard curve method, all genes, except Pv18S, showed adequate estimates of efficiencies ranging from 95 to 105%, while for LinRegPCR all genes, except Pv18S and PvAct,
presented values of efficiency higher than 82% (Table 3). For three genes, β-tubulin, Tc127, and T197, both methods
provided satisfactory levels of efficiency (≥ 82.97%) with the highest value for T197 (≥ 93.33%). Among all genes, T197
(encodes a guanine nucleotide-binding protein beta subunit-like protein) was selected from the common bean cDNA libraries; however, in a previous study, it was not recommended for use as a normalizer gene due to the variability of its expression levels (Thibivilliers et al. 2009). As the primer amplifications in this study were carefully adjusted by titration procedure, the potential of each gene and its efficiency as a reference for normalization were evaluated under the adequate qPCR conditions. Failures to amplify a desired target sequence are often assigned to inadequate primer design, and targeting other regions of the gene sequence could be strategic to redesign a new set of primers and obtain a satisfactory amplification.
Expression stability of reference genes
It is well known that gene expression stability is one of the most important criteria for selection of a reference gene. The five selected genes in this study (Pv18S, β-tubulin, PvAct, Tc127 and T197) showed adequate amplification of cDNA
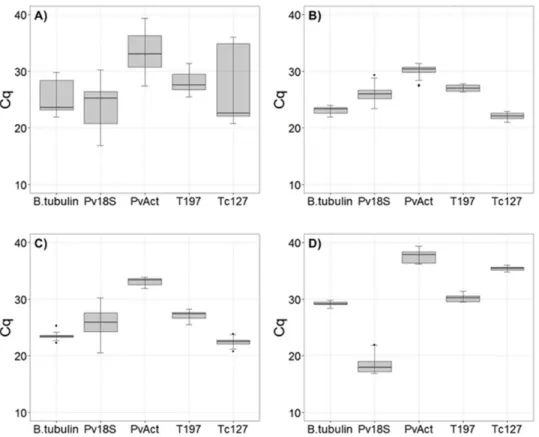
samples from the seeds, leaves and roots of common bean plants. The absolute Cq values individually obtained for each one of the five reference genes are graphically represented on a box plot graphic in Figure 1 where the median raw Cqs are represented by lines. There is a premise that reference genes cannot be regulated by the experimental conditions of the sample set (Robledo et al. 2014). The geNorm and BestKeeper algorithms are based on the assumption that none
The gene-to-gene correlations were verified by the Pearson correlation coefficient (r) (Pfaffl et al. 2004), and a strong positive correlation for all reference genes (r ≥ 0.80) was observed (Figure 2), even for Pv18S, which presented a negative and strong correlation with the other reference genes evaluated (r ≤ -0.66). For Pv18S, the Cq value tended
to be reduced in seeds (Figure 1d) (ranging from 16.92 to 30.23) compared to the other tissues, which is indicative of higher initial copy numbers of this target sequence. The Pv18S expression level (Cq value) compared with the
remaining genes resulted in statistically significant negative correlations (Figure 2).
The ranking of reference gene stabilities evaluated for the whole set of samples and inter-group variation (abiotic stress, biotic stress and seeds) showed that the genes
did not present a high stability of expression across all sample groups (Table 4), as demonstrated by the high standard deviation and by the wide range of Cq values (Figure 1a). For all samples analyzed together, geNorm ranked T197 and
β-tubulin as the most stable genes (M = 1.4) with the combined value below the recommended cutoff of 1.5 (Robledo et al. 2014). NormFinder considered the same two genes most stable, with a combined stability value of 0.468. Based on RefFinder and Bestkeeper,the T197 and β-tubulin were also considered the most stable, although the SD (1.26 and
Figure 1. Box plot analysis of Cqs obtained for distinct sample sets of each gene. Each box indicates the middle 50% of the distribu
-tion, with a line at the median dividing the box into two parts. A) Cqs distribution values for all samples; B) Cqs distribution for abiotic stress; C) Cqs distribution for biotic stress; D) Cqs distribution for seed samples.
Figure 2. Correlation between Cq values for the reference genes.
2.37, respectively) and CV (4.52 and 9.50, respectively) determined by Bestkeeperwere above the recommended cutoff of 1 (Table 4).
When considering the whole set of samples, the Cq values become more stable and lower (Figures 1b, 1c and 1d). For the samples of leaves and roots submitted to the same experimental conditions (abiotic stress), Tc127, T197, β-tubulin and PvAct were ranked as more stable with reduced SD (0.8) by Bestkeeper. The remaining algorithms gave the same
result and indicated that the reference genes T197 and β-tubulin were the most stable, with a geNorm value of 0.415. For
the samples submitted to biotic stress, the genes Tc127 and β-tubulin were ranked as the best combination by geNorm
(M=0.386) and the remaining methods, except for BestKeeper, and the genes ranked with lower SD (below the cutoff of 1) were β-tubulin (0.52), PvAct (0.58), Tc127 (0.59) and T197 (0.64). For the seed samples, geNorm suggested β-tubulin
and Tc127 as the most stable (M= 0.605) combination, as well as for the other programs. All genes, except for Pv18S,
presented SD values lower than one by BestKeeper. For qPCR data normalization, two genes were frequently observed as the optimal number in several experimental plots (Borges et al. 2012, Müller et al. 2014).
In the present study, out of the five genes, β-tubulin and T197, previously determined for common beans under biotic
and abiotic stress, respectively, ranked as the most stable among the sample sets evaluated in different tissue samples (leaves, roots and seeds) and experimental conditions (biotic and abiotic stress). In a previous study, two β-tubulin genes
(Tub8 and Tub9) were not selected as reference genes (Borges et al. 2012), suggesting that the β-tubulin isoforms may
have different expression patterns, as seen for other enzymes (Sielski et al. 2014). In addition, the genes PvAct and
Pv18S were the least stable, in accordance with previous studies (Fernandez et al. 2011).
The RNA extraction, optimization and validation of reference genes for expression analysis in different tissues and experimental conditions were aimed at enabling the optimal performance of qPCR experiments in common bean samples. A more adequate method for RNA seed extraction was implemented that produced RNA with high integrity for gene expression studies (RIN ≥ 6.9). Furthermore, a set of reference genes using SYBR Green chemistry were tested and made available for normalization in qPCR experiments for different tissue samples and experimental conditions. This study also provided the validation of the web-based tool RefFinder that integrates a diverse set of methods to compare and rank the best combination of candidate reference genes in common bean samples. The data from the present study strongly support the indication of reference genes for qPCR analysis.
Table 4. Stability rankings obtained with the six determination methods for the individual group of common bean samples
Group Rank Comparative Delta-CT BestKeeper (SD) BestKeeper (CV%) NormFinder geNorm RefFinder
all samples
1 β-tub.(3.147) T197 (1.26) T197 (4.52) T197 (0.649) T197/(1.403) β-tub. β-tub.(1.189) 2 T197 (3.308) β-tub.(2.37) PvAct (7.67) β-tub.(0.941) T197 (1.414) 3 PvAct (3.462) PvAct (2.55) β-tub.(9.50) PvAct (1.517) PvAct (1.712) PvAct (3.000)
4 Tc127 (5.215) Pv18S (3.31) Pv18S (13.83) Tc127 (4.175) Tc127 (2.754) Tc127 (4.229)
5 Pv18S (6.87) Tc127 (5.20) Tc127 (20.11) Pv18S (5.757) Pv18S (4.401) Pv18S (4.729)
abiotic stress (leaves)
1 T197 (1.017) Tc127 (0.46) T197 (1.94) β-tub.(0.461) T197/(0.415) β-tub. T197 (1.414) 2 β-tub.(1.018) T197 (0.52) Tc127 (2.10) T197 (0.523) β-tub.(1.565) 3 Tc127 (1.062) β-tub.(0.63) PvAct (2.64) Tc127 (0.581) Tc127 (0.502) Tc127 (2.280)
4 PvAct (1.566) PvAct (0.79) β-tub.(2.71) PvAct (1.323) PvAct (1.012) PvAct (4.000)
5 Pv18S (1.626) Pv18s (1.18) Pv18S (4.54) Pv18S (1.415) Pv18S (1.258) Pv18S (5.000)
biotic stress (leaves and roots)
1 Tc127 (0.991) β-tub.(0.52) PvAct (1.76) β-tub.(0.359) β-tub.(0.386)/Tc127 Tc127 (1.316) 2 β-tub.(1.044) PvAct (0.58) β-tub.(2.22) Tc127 (0.390) β-tub.(1.414) 3 T197 (1.209) Tc127 (0.59) T197 (2.36) PvAct (0.657) T197 (0.544) PvAct (3.130)
4 PvAct (1.215) T197 (0.64) Tc127 (2.63) T197 (0.816) PvAct (0.644) T197 (3.464)
5 Pv18S (2.526) Pv18S (2.25) Pv18S (8.67) Pv18S (1.808) Pv18S (1.397) Pv18S (5.000)
seed
1 β-tub.(1.048) β-tub.(0.31) Tc127 (0.86) β-tub.(0.302) β-tub.(0.605)/Tc127 β-tub.(1.189) 2 Tc127 (1.071) Tc127 (0.31) β-tub.(1.07) Tc127 (0.302) Tc127 (1.144) 3 T197 (1.092) T197 (0.50) T197 (1.64) T197 (0.487) T197 (0.684) T197 (3.000)
4 PvAct (1.400) PvAct (0.96) PvAct (2.56) PvAct (1.204) PvAct (0.832) PvAct (4.000)
REFERENCES
Andersen CL, Jensen JL and Ørntoft TF (2004) Normalization of real-time quantitative reverse transcription-PCR data: A model-based variance estimation approach to identify genes suited for normalization,
applied to bladder and colon cancer data sets. Cancer Research 64: 5245-5250.
Borges A, Tsai SM and Caldas DGG (2012) Validation of reference genes for RT-qPCR normalization in common bean during biotic and abiotic
stresses. Plant Cell Reports 31: 827-838.
Brigide P, Canniatti-Brazaca SG and Silva MO (2014) Nutritional characteristics of biofortified common beans. Food Science and
Technology 34: 493-500.
Chen JB, Wang SM, Jing RL and Mao XG (2009) Cloning the PvP5CS gene from common bean (Phaseolus vulgaris) andits expression patterns under abiotic stresses. Journal of Plant Physiology 166: 12-19.
Christou A, Georgiadou EC, Filippou P, Manganaris GA and Fotopoulos V (2014) Establishment of a rapid, inexpensive protocol for extraction of high quality RNA from small amounts of strawberry plant tissues and other recalcitrant fruit crops. Gene 537: 169-173.
Cicinnati VR, Shen Q, Sotiropoulos GC, Radtke A, Gerken G and Beckebaum S (2008) Validation of putative reference genes for gene expression studies in human hepatocellular carcinoma using real-time quantitative RT-PCR. BMC Cancer 8: 350.
Contour-Ansel D, Torres-Franklin ML, Zuily-Fodil Y and Carvalho MHC (2010) An aspartic acid protease from common bean is expressed ‘on call’ during water stress and early recovery. Journal of Plant
Physiology 167: 1606-1612.
Dheda K, Huggett JF, Chang JS, Bustin SA, Johnson MA, Rook GAW and Zumla A (2005) The implications of using an inappropriate reference gene for rela-time reverse transcription PCR data normalization.
Analytical Biochemistry 344: 141-143.
Eticha D, Zahn M, Bremer M, Yang Z, Rangel AF, Rao IM and Horst WJ (2010) Transcriptomic analysis reveals differential gene expression in response to aluminium in common bean (Phaseolus vulgaris)
genotypes. Annals of Botany 105: 1119-1128.
Fernandez P, Di-Rienzo JA, Moschen S, Dosio GAA, Aguirreza-bal LAN, Hopp HE, Paniego N and Heinz RA (2011) Comparison of predictive
methods and biological validation for qPCR reference genes in
sunflower leaf senescence transcript analysis. Plant Cell Reports 30: 63-74.
Heid CA, Stevens J, Livak K and Williams PM (1996) Real time quantitative
PCR. Genome Research 6: 986-994.
Hu Y, Chen H, Luo C, Dong L, Zhang S, He X and Huang G (2014) Selection of reference genes for real-time quantitative PCR studies of kumquat in various tissues and under abiotic stress. Scientia Horticulturae 174: 207-216.
Li Z and Trick HN (2005) Rapid method for high-quality RNA isolation from
seed endosperm containing high levels of starch. BioTechniques
38: 872-876.
Libault M, Thibivilliers S, Bilgin DD, Radwan O, Benitez M, Clough SJ and Stacey G (2008) Identification of four soybean reference genes for gene expression normalization. Plant Genome 1: 44-54.
Ma Z, Huang B, Xu S, Chen Y, Li S and Lin S (2015) Isolation of high-quality total RNA from chinese fir (Cunninghamia lanceolata (Lamb.) Hook).
Plos One 10(6): e0130234.
Matz MV, Wright RM and Scott JG (2013) No control genes required: bayesian analysis of qRT-PCR data. Plos One 8: 1-12.
Mornkham T, Wangsomnuk PP, Fu Y-B, Wangsomnuk P, Jogloy S and Patanothai A (2013) Extractions of high quality RNA from the seeds of jerusalem artichoke and other plant species with high levels of
starch and lipid. Plants 2: 302-316.
Müller BS de F, Sakamoto T, Silveira RDD, Zambussi-Carvalho PF, Pereira M, Pappas Jr GJ, Costa MMC, Guimarães CM, Pereira WJ, Brondani C and Vianello-Brondani RP (2014) Differentially expressed genes during flowering and grain filling in common bean (Phaseolus
vulgaris) grown under drought stress conditions. Plant Molecular
Biology Reporter 32: 438-451.
Peirson SN, Butler JN and Foster RG (2003) Experimental validation of novel and conventional approaches to quantitative real-time PCR
data analysis. Nucleic Acids Research 31: e73.
Pfaffl MW, Ales T, Prgomet C and Neuvians TP (2004) Determination of stable housekeeping genes, differentially regulated target genes and sample integrity: BestKeeper – Excel-based tool using pair-wise correlations. Biotechnology Letters 26: 509-515.
Ramírez M, Flores-Pacheco G, Reyes JL, Álvarez AL, Drevon JJ, Girard L and Hernández G (2013) Two common bean genotypes with contrasting response to phosphorus deficiency show variations in the microRNA 399-Mediated PvPHO2 regulation within the PvPHR1 signaling pathway. International Journal of Molecular Sciences 14: 8328-8344. Robledo D, Hernádez-Urcera J, Cal MR, Pardo BG, Sánchez L and Martinez P (2014) Analysis of qPCR reference gene stability determination methods and a practical approach for efficiency calculation on a turbot (Scophthalmus maximus) gonad dataset. BMC Genomics 15: 648.
Ruijter JM, Ramakers C, Hoogaars WMH, Karlen Y, Bakker O, Hoff MJB van den and Moorman AFM (2009) Amplification efficiency: linking baseline and bias in the analysis of quantitative PCR data. Nucleic
Acids Research 37: e45.
Santos MO, Romano E, Yotoko KSC, Tinoco MLP, Diasa BBA and Aragão FJL (2005) Characterization of the cacao somatic embryogenesis receptor-like kinase (SERK) gene expressed during somatic
embryogenesis. Plant Science 168: 723-729.
Silva TTA, Abreu LAS, Nascimento VE, Pinho ERVV, Rosa SDVF and Padilha L (2011) Protocolo para extração de RNA em semente de café.
In Proceedings of VII simpósio de pesquisa dos cafés do Brasil.
Sielski NL, Ihnatovych I, Hagen JJ and Hofmann WA (2014) Tissue specific
expression of myosin ICisoforms. BMC Cell Biology 15: 8.
Silver N, Best S, Jiang J and Thein SL (2006) Selection of housekeeping genes for gene expression studies in human reticulocytes using real-time PCR. BMC Molecular Biology 7: 33.
Svec D, Tichopad A, Novosadova V, Pfaffl MW and Kubista M (2015) How good is a PCR efficiency estimate: Recommendations for precise and robust qPCR efficiency assessments. Biomolecular Detection and Quantification 3: 9-16.
Thibivilliers S, Joshi T, Campbell KB, Scheffler B, Xu D, Cooper B, Nguyen HT and Stacey G (2009) Generation of Phaseolus vulgaris ESTs and investigation of their regulation upon Uromyces appendiculatus
infection. BMC Plant Biology 9: 1-13.
Vandesompele J, Preter KD, Pattyn F, Poppe B, Roy NV, Paepe AD and Speleman F (2002) Accurate normalization of real-time quantitative RT-PCR data by geometric averaging of multiple internal control
genes. Genome Biology3: 1-12.
Xie F, Xiao P, Chen D, Xu L, Zhang B (2012) miRDeepFinder: a miRNA analysis tool for deep sequencing of plant small RNAs. Plant
Molecular Biology 80: 75
Yee JY, Limenta LMG, Rogers K, Rogers SM, Tay VS and Lee EJ (2014) Ensuring good quality RNA for quantitative real-time PCR isolated from renal proximal tubular cells using laser capture microdissection.
BMC Research Notes 7: 62.
Yin G, Xu H, Liu J, Gao C, Sun J, Yan Y and Hu Y (2014) Screening and identification of soybean seed-specific genes by using integrated bioinformatics of digital differential display, microarray, and RNA-seq
data. Gene546: 177-186.
Zyzynska-Granica B and Koziak K (2012) Identification of suitable reference genes for real-time PCR analysis of statin-treated human umbilical