Correspondence: Profa. Dra. Janaina Bertoncelo de Almeida, Departamento de Odontologia Restauradora, Pontifícia Universidade Católica do Paraná, PUCPR, Rua Imaculada Conceição, 1155, Prado Velho, 80215-901 Curitiba, PR, Brasil. Tel: +55-41-3271-2548. Fax: +55-41-3224-6688. e-mail: [email protected]
Impact of Refrigeration on the Surface Hardness
of Hybrid and Microilled Composite Resins
Fernando Henrique Ruppel OSTERNACK1 Danilo Biazzetto de Menezes CALDAS1
Rodrigo Nunes RACHED1 Sérgio VIEIRA1 Jeffrey A. PLATT2
Janaina Bertoncelo de ALMEIDA1
1Department of Restorative Dentistry, Pontiical Catholic University of Paraná, Curitiba, PR, Brazil
2Department of Restorative Dentistry, Indiana University School of Dentistry, Indianapolis, IN, USA
This in vitro study evaluated the Knoop hardness of the composite resins Charisma® (C) and Duraill VS® (D) polymerized in 3
dif-ferent conditions: at room temperature (A) (23 ± 1°C); refrigerated at 4 ± 1°C and immediately photo-activated after removal from the
refrigerator (0); and, refrigerated at 4 ± 1°C and photo-activated after a bench time of 15 min at room temperature (15). One hundred
and twenty specimens (4 mm diameter and 2 mm depth) were made using a stainless steel mold and following manufacturer’s instruc-tions. All specimens were tested immediately after polymerization (I) and after 7 days of water storage in the dark at room temperature
(7d). The data were subjected to ANOVA and post-hoc Tukey’s test (a=0.05). On the top surface, CAI was statistically similar to C15I
and DAI to D15I (p>0.05). On the bottom surface, CAI presented higher hardness values when compared to C0I and C15I (p<0.05). The
D groups showed no signiicant differences (p>0.05) on the bottom surfaces for any tested polymerization condition. After 7 days of storage, the Knoop hardness decreased signiicantly (p<0.05) for groups C7d and D7d except for C07d, which was not different from C0I
at either surface (p>0.05). D07d showed higher Knoop hardness (p<0.05) values on the top surface when compared to the other groups.
Key Words: resin composite, refrigeration, Knoop hardness.
INTRODUCTION
The curing of methacrylate-based composite resins for dental applications is a major issue due to its importance regarding biocompatibility (1), bacterial growth associated with the release of unreacted mono-mers (2) and improvement of the material’s physical properties (3).
The balance of the components in the organic formulation has been proven essential during the po-lymerization process (4).Other factors controlling light-activated polymerization are irradiance, wavelength (4), and the time needed for polymerization to occur (5,6). Some studies have investigated the possibility that resin monomer lexibility and the temperature during polymerization may affect the conversion rate and the
material properties (4).
Kloosterboer et al. (7) have shown that monomer mobility is higher with increased polymerization tem-perature. Trujillo et al. (8) have found that pre-heating the composite resin increases the immediate and the inal conversion rates due to the increase of monomer mobility. Although relatively recent research has shown favorable results regarding the increase of the conversion rate with pre-heated composites (9),few studies have addressed the cooling of methacrylate resin materials (9,10).This is an important issue to be investigated because the refrigerated storage of composite resins is a common practice to increase their shelf-life and is suggested by some manufacturers.
re-frigeration could increase the material’s viscosity (4), thereby decreasing monomer mobility, an alteration of the properties of the polymerized composite resin could be anticipated. It would be expected in cases where the material is used for a clinical procedure immediately after removal from refrigeration.
Knoop hardness test is directly related to the degree of conversion (11). Bouschlicher et al. (12), showed a linear correlation between hardness and de-gree of conversion when investigating the differences between the type of composite resin and the depth of cure of the specimen.
The purpose of this study was to determine the impact of refrigeration on the Knoop hardness of two re-storative composite resins at the top and bottom surfaces of the specimens. The resins were polymerized in three different conditions: at room temperature (23 ± 1°C); refrigerated at 4 ± 1°C and immediately photoactivated after removal from the refrigerator; and, refrigerated at 4 ± 1°C and photoactivated after a bench time of 15 min at room temperature. Measurements were made immediately after polymerization and after 7 days of storage. The hypotheses tested were that there are no differences in the mean Knoop hardness values of the composite resins regardless of the polymerization condi-tions or storage time before testing.
MATERIAL AND METHODS
Two commercially available composite resins were tested in this study: a hybrid composite (Charisma
(C); Heraeus Kulzer GmbH & Co., Hanau, German) and a microilled composite (Duraill VS (D); Heraeus Kulzer GmbH & Co.) (Table 1). The Knoop hardness test was carried out to determine the surface hardness of the composite resins when submitted to different temperatures prior to polymerization.
For the control groups (immediate and 7 days) for both materials (C and D), the composite resin tubes were kept at 23 ± 1oC and a relative humidity of 50 ± 5%
up to the specimens preparation. For the other groups (refrigerated material), the composite resins were cooled to 4 ± 1oC for 24 h before preparing the specimens; after
this time the composite resin was removed from the tubes, placed at the mold and polymerized after different bench time at room temperature (Table 2).
In all groups, the temperature of the composite resin paste was veriied before the polymerization with a digital multimeter (ET 2210; Minipa, São Paulo, SP, Brazil). The composite resins at room temperature (23oC) took 15 min to reach 4oC when placed inside the
refrigerator. When started at 4oC, it was necessary the
same 15 min out of the refrigerator for the resin paste to reach room temperature again. The same operator prepared all specimens and the 6 groups were divided as shown in Table 2.
For all groups cylindrical specimens were fab-ricated using a split stainless steel mold with a 4 mm diameter and 2 mm depth. A Mylar matrix was pressed against the composite resin surface using a 1 mm glass slide in order to obtain a smooth and lat surface. Vis -ible light-activation was accomplished with a quartz-tungsten-halogen light-curing unit (Optilux VCL 501;
Demetron/Kerr, Danbury, CT, USA) with irradiance of 490 mW/cm2, as measured with a
curing radiometer. The activa-tion time was 20 s, as recom-mended by the manufacturer. The energy density emitted was calculated by multiplying the irradiance by the emission time. Therefore, all specimens were exposed to an energy density of 9.8 J/cm2.
After removing the specimens from the mold, the top was distinguished from the bottom and a line was draw at
Table 1. Tested materials.
Composite resin
Organic
matrix Filler type and size
Mean iller size
Filler content (vol)
Shade Batch
Charisma Bis-GMA TEGDMA
Barium aluminum luoride glass
(0.02-0.07 µm), highly dispersed silica
(0.02-2 µm)
0.7 µm 64% A2 010093
Duraill VS
Bis-GMA UDMA TEGDMA
Pre-polymerized particles (10-20 µm), highly dispersed silica
(0.02-0.07 µm).
0.04 µm 40% A2 010149
the center of each top and bottom surface. This provided one hemi-surface for immediate hardness testing and another for testing after 7 days. A microhardness tester (HVS1000; NDT Instrument Co, Beijing, China) was used with a load of 50 g applied for 15 s. Each specimen was tested immediately after polymerization and after a 7-day storage in water at 23 ± 1oC. Seven indentations
were made on the top and 7 indentations were made on the bottom of each specimen at each period. The distance between each indentation was ≥4 larger diagonals of the indenter (4D). This precaution was taken to prevent areas of plastic deformation produced by neighboring indentations from altering the hardness values (Fig. 1). The larger diagonal was measured with an optical micro-scope (Olympus BX 51; Olympus Corp, Tokyo, Japan) at 50-fold magniication, and using an image-analysis software (Image-Pro Express 5.0; MediaCybernetics Inc, Silver Spring, MD, USA). The values (in µm) were converted into Knoop hardness number values using the following equation:
2
14229
d
P
KHN
=
×
Where:
P=applied load, in kgf; d=larger diagonal, in µm;
KHN=Knoop Hardness Number, in kgf/mm2.
The average of the 7 indentations was calculated and this value was used as the KHN for each specimen (n=20). Values were obtained from the top and bottom surfaces for each group, and the the bottom/top ratio (B/T) was determined.
The data were analyzed by multiple-way analysis of variance. When statistical differences were veriied between the treatments, the means were individually analyzed with Tukey’s HSD test at 5% signiicance level.
RESULTS
The hardness values for the top surface of groups CAI and C15I did not differ signiicantly from each other
(p>0.05). C15I did not differ from C0I (p>0.05), but C0I
was signiicantly lower than CAI (p<0.05). For the bottom
surfaces, C0I and C15I showed lower mean values when
compared to CAI (p<0.05). The mean values for CA7d,
C07d and C157d did not differ signiicantly for either the
top or the bottom surfaces (p<0.05). After storage, no
Table 2. Group description by composite and temperature.
Groups
(n=20) Description
Temperature and humidity at photoactivation
CAI / CA7d
DAI / DA7d
Composite resins (C and D) polymerized at room
temperature
23 ± 1oC / 50 ± 5%
C0 I / C07d
D0 I / D07d
Composite resins (C and D) polymerized immediately after removal
refrigeration
4 ± 1oC / 50 ± 5%
C15 I / C157d
D15 I / D157d
Composite resins (C and D) removed from refrigeration and polymerized after 15-min
bench time.
23 ± 1oC / 50 ± 5%
The legends (CA, C0, C15, DA, D0 and D15) of discriminated groups,
are valid from tables 2 to 4. As well as legends (A, 0 and 15), that
refere to composites that were photoactivated, respectively: at room temperature (23 ± 1°C) and at refrigerated temperature (4 ± 1°C) with a bench time of 0 min and 15 min at room temperature before polymerization. The legends (I) and (7d) refer
to the specimens tested immediately after polymerization and after
Table 3. Mean Knoop hardness number (KHN) and standard deviations (sd) for the composite Charisma tested at the top and bottom surfaces, immediately after polymerization and after 7 days of water storage.
CA C0 C15
TopI 33.24 (5.35) aA 30.46 (3.57) bA 31.88 (3.97) abA
Top7d 28.65 (4.41) aB 29.79 (5.21) aA 28.41 (4.73) aB
BottomI 17.60 (4.29) aC 15.46 (3.31) bC 16.10 (3.15) bC
Bottom7d 14.51 (3.16) aD 14.99 (4.77) aC 14.49 (2.94) aD
I= Immediate; 7d = 7 days; Means followed by the same lowercase
letters in rows and uppercase letters in columns indicate no statistically signiicant difference at the 95% conidence level (Tukey’s test, p>0.05).
signiicant reduction in hardness was observed at the top and at the bottom surfaces of C0 (Table 3).
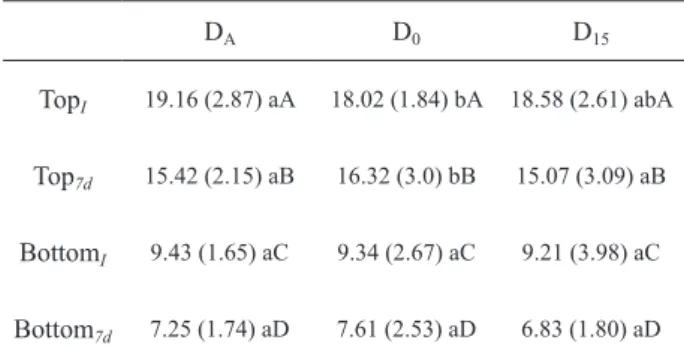
For D at the top surface, there were no statisti-cally signiicant differences between the mean values for DAI and D15I (p>0.05). D15I did not differ from D0I
(p>0.05), but D0I yielded statistically lower mean values
than DAI. (p<0.05).Still at the top surface, microill resin
composite had also showed no statistically signiicance difference (p<0.05) between DA7d and D157d. D07d showed
higher hardness values when compared to both groups. After storage, signiicant reductions (p<0.05) in hard -ness of the top and the bottom surfaces were observed when comparing immediate and 7-day tests within the groups (Table 4).
The B/T ratio did not present statistically signii -cant differences with the tested temperatures between the immediate and the 7-day tests for C (p>0.05). How-ever, statistically signiicant differences (p<0.05) were observed for D, which presented lower values after 7 days of storage, though without signiicant differences between the tested temperatures (p>0.05).
DISCUSSION
The results suggest inluence of refrigeration on Knoop hardness values for the hybrid (C) and microilled (D) composite resins tested in this study.
Both resins presented changes in the hardness
values veriied right after the polymerization (I) between
the specimens prepared at room temperature (A) and just
after removal of the resin from refrigeration at 4oC ( 0).
The strong inluence of temperature in the po -lymerization process of the composite resins found by Daronch et al. (9), who showed an increase in the degree of conversion at a 60oC and a decrease at 3oC,
does not seem to apply when using hardness testing and temperatures of 4 ± 1oC and 23 ± 1oC.
With a bench time of 15 min after removal from the refrigerator, the temperature of both composites was 23oC. The statistically similar top surface hardness
values for the groups tested at room temperature and 15 min after removal from the refrigerator was an expected inding. The hardness on the top surface was higher than the hardness on the bottom at all time periods, indicat-ing dificulty in polymerizindicat-ing the bottom surface. This can be partially attributed to the fact that proximity of the top surfaces to the light source and their receiving a higher energy density (5,6,13,14).
The temperature increase caused by halogen light-curing units, as reported by Soh et al. (13), might have helped the polymerization kinetics at the top sur-face by heating (4). However, the temperature increase may not have been enough to aid the polymerization at the bottom surface due to the isolating characteristics of the composite resin and the great distance from the light source (15,16).
Table 4. Mean Knoop hardness number (KHN) and standard deviations (sd) for the composite Duraill VS tested at the top and bottom surfaces, immediately after polymerization and after 7 days of water storage.
DA D0 D15
TopI 19.16 (2.87) aA 18.02 (1.84) bA 18.58 (2.61) abA
Top7d 15.42 (2.15) aB 16.32 (3.0) bB 15.07 (3.09) aB
BottomI 9.43 (1.65) aC 9.34 (2.67) aC 9.21 (3.98) aC
Bottom7d 7.25 (1.74) aD 7.61 (2.53) aD 6.83 (1.80) aD
I= Immediate; 7d = 7 days; Means followed by the same lowercase
Studies have reported that the hardness values at the bottom surface should be between 80 and 90% of the hardness at the top surfaces in order to indicate a proper polymerization (11,12,17). In this study, the exposure duration recommended by the manufacturer resulted in bottom-to-top-surface Knoop hardness ratios between 47 to 54% for the tested resins. This is in agreement with the indings of Cohen et al. (18), who reported the need for exposing the specimens from a 5- to 20-fold longer time than that indicated by the manufacturer to achieve 80% bottom-surface hardness with respect to the top. Caldas et al. (6) have also suggested using a longer curing time, in order to increase the energy density at the bottom of the layer and increase the degree of conversion.
Ideally, the manufacturers should inform the needed energy density and not only the curing time for an appropriate conversion at the bottom of the recom-mended maximum layer (19). The B/T ratio was not altered for Cin the tests carried out immediately and 7 days after polymerization. However, for D, this ratio decreased after 7 days, which suggests that although the values at the top and bottom have decreased with water storage, the bottom presented a more accentuated decrease. This could be explained by the bottom being less polymerized and thus, more susceptible to the inlu -ence of water during storage.
After 7 days for C, in both tested surfaces, the differences seen with the refrigerated material within groups were not observed, thus accepting the null hy-pothesis. A possible explanation could be that the initial difference was impacted by residual stress resulting from polymerization due to the effect of the temperature generated by the curing unit, mainly on the composite at the room temperature. Stress relaxation may have contributed to the hardness values being not statistically different for the 3 tested temperature conditions after 7 days of storage.
However, D0 showed the smallest decrease in
hardness at the top surface after 7 days, differing from the others and rejecting the null hypothesis.
The microilled resin composite with a iller load of 40 vol% and hence more resin matrix than the hybrid composite was even more sensitive to the phenomenon of residual stress and posterior relaxation at the top surface. The composite resin polymerized at the room temperature presented lower hardness mean values than the resin polymerized at 4oC after 7 days. A possible
explanation would be that the hardness at the top surface
of both refrigerated resin composites was less affected by the temperature of the curing unit, generating less stress during its polymerization. It may be speculated that faster polymerization occurred at room temperature was inluenced by the heat generated by the halogen lamp, which led to the entrapment of low molecular weight monomers among long polymer chains, hindering the formation of the polymer network.Therefore, hardness measurement immediately after the testing would not express the actual hardness of the material because the residual stress generated during the polymerization process accounts for reaching increased values.
These results suggest that the refrigeration al-lowed a behavior of the composite resin similar to the “soft start polymerization method” because, the low temperature could have proportioned less monomer mobility, decreasing the reaction velocity and providing an extension of the pre-gel phase without decreasing hardness values (20).
Despite the promising results from this prelimi-nary study, pointing to a decrease in the stress gener-ated during polymerization with refrigergener-ated composite resins, further research has been conducted keeping the molds at 37oC to simulate the intraoral conditions in
a better manner, although the insulating properties of composites is known.
According to the results, and within the limita-tions of this in vitro study, it may be concluded that for the hybrid composite resin, only the immediate hard-ness values were impacted by the temperature at the top and bottom surfaces. After 7 days for C, no statistically signiicant difference was observed regardless of the temperature. For DAI the top hardness value was higher
than D0I. However, the D0 hardness value was higher
than the DA values after 7 days. The B/T ratio did not
differ for the hybrid composite resinamong the tested groups. The B/T ratio did not differ for the microilled composite resin with the different temperatures, but decreased after 7 days of storage.
RESUMO
O objetivo do presente estudo in vitro foi avaliar a dureza Knoop das resinas compostas, uma resina híbrida (Charisma - C) e uma de micropartículas (Duraill VS - D) quando polimerizadas à temperatura ambiente (A) (23 ± 1°C); refrigeradas (4 ± 1°C) e
fotoativadas imediatamente após a remoção do refrigerador (0);
e refrigeradas (4 ± 1°C), com tempo de espera de 15 min após a remoção do refrigerador para fotoativação (15). Cento e vinte
foram confeccionados em uma matriz de aço inoxidável. Cada corpo-de-prova foi testado imediatamente após a fotoativação (I) e, após 7 dias de armazenamento (7d) em ambiente escuro
com umidade relativa a 100%, à temperatura do ambiente (23 ± 1°C). Quando testada imediatamente após a polimerização, na superfície de topo CAI foi estatisticamente semelhante à C15I e DAI
à D15I. Na base, a resina composta CAI, teve maiores valores de
dureza quando comparados à C0I e C15I. Os grupos do material D
não mostraram diferenças signiicantes com relação ao efeito da refrigeração na base. Sete dias após, os valores de dureza Knoop caíram tanto para C7d quanto para D7dcom exceção de C07d que
não diferiu de C07d nas diferentes superfícies, e D07d que mostrou
maiores valores de dureza no topo.
ACKNOWLEDGEMENTS
The authors would like to thank Heraeus Kulzer for supplying the composite resins and the Physics’ Department of the Federal University of Parana, especially Professors Carlos Maurício Lepienski and Paulo César Soares Júnior for the technical and intellectual support during this research.
REFERENCES
1. Gerzina TM, Hume WR. Effect of dentin on release of TEGDMA from resin composite in vitro. J Oral Rehabil 1994;21:463-468. 2. Hansel C, Leyhausen G, Mai UE, Geursten W. Effects of various
resin composite (co)monomers and extracts on two caries-associ-ated micro-organisms in vitro. J Dent Res 1998;77:60-67. 3. Ferracane JL, Mitchem JC, Condon JR, Todd R. Wear and
mar-ginal breakdown of composites with various degrees of cure. J Dent Res 1997;76:1508-1516.
4. Lovell LG, Newmann SM, Bowman CN. The effects of light intensity, temperature, and comonomer composition on the po-lymerization behavior of dimethacrylate dental resins. J Dent Res 1999;78:1469-1476.
5. Feng L, Carvalho R, Suh BI. Insuficient cure under the condi -tion of high irradiance and short irradia-tion time. Dent Mater 2009;25:283-289.
6. Caldas DB, Almeida JB, Correr-Sobrinho L, Sinhoreti MA,
Con-sani S. Inluence of curing tip distance on resin composite Knoop
hardness number, using three different light curing units. Oper Dent 2003;28:315-320.
7. Kloosterboer JG, van de Hei GMM, Gossink RG, Dortant GCM. The effects of volume relaxation and thermal mobilization of
trapped radicals on the inal conversion of photopolymerized
diacrylates. Pol Commun 1984;25:322-325.
8. Trujillo M, Newmann SM, Stansbury JW. Use of near-IR to
moni-tor the inluence of external heating on dental composite photopo -lymerization. Dent Mat 2004;20:766-777.
9. Daronch M, Rueggeberg FA, De Goes MF. Monomer conversion of pre-heated composite. J Dent Res 2005;84:663-667.
10. Borges GA, Spohr AM, Oliveira WJ, Correr-Sobrinho L, Correr AB, Borges LH. Braz Dent J 2006;17:186-190.
11. DeWald JP, Ferracane JL. A comparison of four modes of evalu-ating depth of cure of light-activated composites. J Dent Res 1987;66:727-730.
12. Bouschlicher MA, Rueggeberg FA, Wilson BM. Correlation of bottom-to-top surface microhardness and conversion ratios for a variety of resin composite compositions. Oper Dent 2004;29:698-704.
13. Soh MS, Yap AUJ, Siow KS. The effectiveness of cure of LED and halogen curing lights at varying cavity depths. Oper Dent 2003;28:707-715.
14. Lindberg A, Peutzfeld A, van Dijken JWV. Effect of power den-sity of curing unit, exposure duration, and light guide distance on composite depht of cure. Clin Oral Invest 2005;9:71-76. 15. Al-Qudah AA, Mitchell CA, Biagioni PA, Hussey DL.
Thermo-graphic investigation of contemporary resin-containing dental materials. J Dent 2005;33:593-602.
16. Stewardson DA, Shortall AC, Harrington E, Lumley PJ. Thermal changes and cure depths associated with a high intensity light activation unit. J Dent 2004;32:643-651.
17. Johnston WM, Leung RL, Fan PL. A mathematical model for post-irradiation hardening of photoactivated composite resins. Dent Mat 1985;1:191-194.
18. Cohen ME, Leonard DL, Charlton DG, Roberts HW, Ragain JC.
Statistical estimation of resin composite polymerization sufi -ciency using microhardness. Dent Mat 2004;20:158-166. 19. Obici AC, Sinhoreti MAC, Correr-Sobrinho L, de Goes, MF,
Consani S. Evaluation of depth of cure and Knoop hardness in a dental composite photo-activated using different methods. Braz Dent J 2004;15:199-203.
20. Dall’Magro E, Sinhoreti MAC, Correr AB, Correr-Sobrinho L, Consani S, Puppin-Rontani RM. Effect of different initial light intensity by the soft-start photoactivation on the bond strength and knoop hardness of a dental composite. Braz Dent J 2007;18:107-112.