Soil changes in a subtropical seasonal forest chronosequences in the south of Brazil
Mudanças no solo em cronossequências da floresta estacional subtropical no sul do Brasil
Ricardo de Vargas KilcaI Fabrício de Araújo PedronII Gustavo SchwartzIII Solon Jonas LonghiIV Gabriel Antônio DeobaldII
ISSN 0103-8478
ABSTRACT
The abandonment of field crops and the vegetation recovery in exhausted soils have been a recently studied subject as a way to assess the forest role on the soil recovering. The aim of this study was assess changes in the chemical (14 variables) and grain size (sand, silt, and clay) soil features in four forests chronosequences grew over abandoned field crops in the edge of the Brazilian Southern plateau, Rio Grande do Sul State. There were selected 25 forests aging from 5 to >100 years old in areas of slopes and highlands where samples of Leptosols and Regosols were collected at 15cm in depth. The Fisher’s Discriminant Analysis showed that some variable groups of soils can distinguish significantly the soils under different forest ages. Six chemical features of soil fertility were the best monitoring indicators of areas impacted by agriculture. Changes in soil did not occur in a linear way towards time.
Key words: secondary succession, agriculture impacts, Fisher’s
Discriminant Analysis.
RESUMO
O abandono de terras agrícolas e a recuperação da vegetação e dos solos exauridos têm sido um tema recentemente investigado como forma de avaliar o papel da floresta na recuperação do solo. O objetivo deste estudo foi verificar as mudanças nas propriedades químicas (14 variáveis) e granulométricos (areia, silte e argila) em quatro cronossequências florestais originadas após o cultivo agrícola no rebordo do Planalto Meridional, sul do Brasil. Foram selecionadas 25 florestas com idades variando de 5 a >100 anos, localizadas em áreas de encostas e patamares onde amostras de Neossolos Litólicos e Regolíticos Eutróficos foram coletados a 15cm de profundidade. A análise discriminante de Fisher demonstrou que alguns grupos
de variáveis dos solos podem distinguir significativamente os solos sob as diferentes idades florestais. Seis atributos químicos relacionados com a fertilidade do solo poderiam ser considerados os melhores indicadores de monitoramento das áreas impactadas pela agricultura. As mudanças no solo não ocorreram de forma linear ao longo do tempo.
Palavras-chave: sucessão secundária, impacto da agricultura,
análise discriminante de Fisher.
INTRODUCTION
The scientific literature brings many studies on the changes in the physical, chemical, and biological properties of soils after deforestation
(GUARIGUATA & OSTERTAG, 2001; MOJIRI et
al., 2011) and in medium and long times of crops
cultivation (HUGGETT, 1998; SCHOENHOLTZ et
al., 2000; YEMEFACK et al., 2006). After the field crop abandonment, usually due losses in soil fertility, the forest succession starts, where soils remain protected against erosion and surface runoff while a new system nutrient accumulation/cycling through the
vegetation takes place (GUARIGUATA & OSTERTAG,
2001). There is a controversy on the development of new soils after disturbances whether it occurs in a progressive (stable or non-self-organized) or in an unstable way (chaotic or self-organized) (HUGGETT, 1998).The study method of chronosequences assumes
IPrograma de Pós-graduação (CAPES-PNPD), Laboratório de Dendrologia e Fitossociologia, Centro Agroveterinário (CAV), Universidade
do Estado de Santa Catarina (UDESC), 88520-000, Lages, SC, Brasil. E-mail: [email protected]. Corresponding author.
IIDepartamento de Solos, Centro de Ciências Rurais (CCR), Universidade Federal de Santa Maria (UFSM), Santa Maria, RS, Brasil. IIIEmbrapa, Unidade Amazônia Oriental, Belém, PA, Brasil.
IVPrograma de Pós-graduação em Engenharia Florestal, CCR, UFSM, Santa Maria, RS, Brasil.
that sites under similar environmental conditions but, with different ages, can indicate sequences of ecosystem development after disturbances. Due to the advantages of low cost and rapid data collection, this method has been used to test theories on secondary
succession on the vegetation (FRELICH, 1992;
BARNES, et al., 1998) and on soils after disturbances
(HUGGETT, 1998; AN et al., 2008).
The largest areas covered by remnant native forests in the state of Rio Grande do Sul, South of Brazil, are in the southern plateau edge (SPE) (CORDEIRO & RASENACK, 2009). Most of these areas are currently covered by secondary forests resulting from abandoned field crops, in different decades, over Leptosol and Regosol (PEDRON et al., 2010).
The objectives of this study were to answer the following questions: (1) Do different forest soils present specific features depending on the secondary forest age? (2) What are the best indicators for forest soils changes through the secondary succession? (3) Are the changes in forest soil properties linear towards time? These questions were approached through the evaluation of possible patterns in the chemical and grain size features of forest soils in 5 to more than 100-year-old chronosequences in the RSP using Fisher’s discriminant models.
MATERIALS AND METHODS
Study area
The study forests are located in the central region of the southern edge plateau (SPE) in the state of Rio Grande do Sul, South of Brazil. The climate is Cfa, according to the Köppen classification, with an average annual temperature of 19.2°C, with the lowest and highest averages of 10.1°C and 27°C, respectively. The average annual rainfall is 1697.2 mm (INMET,
2009). The Leptpsols and Regosols in the upper
slopes of the SPE are formed by volcanic rocks of the Serra Geral formation, and in the lower slopes were originated from sandy-quartzitic sediments of the formations of Botucatu and Caturrita. The leptosols frequently have a lithic contact, whichis a layer of unaltered rock in a depth of 50 cm from the surface. In the regosols, the lytic contact occurs a depth greater than 50cm (PEDRON et al. 2009; 2010).
The dominant vegetation in these scarps is the subtropical seasonal forest (SPICHIGER et al., 2000). The study areas are in a strip of land with a low variability in climate, geology, and vegetation whether compared to the whole SPE forest cover. Details on the composition and structure of the vegetation in each of the sampled areas are described by KILCA (unpublished data).
Sampling design
The decision on which areas should be sampled were based on the recommendations of FRELICH (2002): interviews with landowners and old dwellers (to know the kind of disturbance and the land use history), recent and old satellite imagery on the chosen areas (Google Earth and aerial photography from 1960 to 1970), floristic composition (presence of indicator species), and the vegetation structure (size). The four chronosequencies were represented by forests with different ages (5 up to > 100 years) that regenerated from the abandonment of field crops and maintained with no anthropic disturbances. Furthermore, forests with different ages were adjacent in each chronosequence and in similar positions in the SPE (Table 1). Therefore, the influences of different environmental variables were minimized in the sampling. After this, the results have less errors than a single random sample.
The identification of contacts between soils, saprolite and rock was done through the cutting shovel test (PEDRON et al., 2009). Given the pedologic variety in SPE environments, soils having at least 80% of their area in the same soil class were classified as belonging to the class.
In all the stands, 1000-m2 plots split in 10
sub-plots of 10m×10m were established. This plot size is enough to represent the vegetation features and to reduce the scale-dependence of the physic and biological variables of the study in both space and time scales (HUGGETT, 1998; FRELICH, 2002).
Inside each 10m×10m sub-plot three compound samples of top soil (0-15cm in depth) were collected to determine the chemical and grain size composition. The basic cations (Ca2+, Mg2+, K+, Na+),
the potential acidity (H+ + Al3+), the exchangeable
Al3+, N, pH, and the organic matter were determined.
The cation exchange capacity, the sum of bases, and the base saturation were calculated according to the method recommended by EMBRAPA (1997). The grain size composition was assessed through the pipette method, according to EMBRAPA (1997).
Statistic analyses
c) low correlation among variable (according to the Pearson’s correlation test), d) dat normality (Kolmogorov-Smirnov’s test), and the homogeneity of the covariance matrixes (test M of Box) (BROWN & WICKER, 2000). After applying these tests, the variables were not standardized to construct the discriminant model (MANLY, 2005).
The final data matrix was built with 250 cases (collections on the sub-units), 25 groups (ages of the forest soils), and 17 independent variables (soil features). The variable selection to be used in the model was determined by the test Wilk’s Lamda (λ) and the stepwise method to include variables in the model. The variable was included in the Fisher’s discriminant method when the F value had the significant level of P≤0.05 and when P>0.10 the variable was removed from the model (BROWN &
WICKER, 2000). The probability of a case to belong to a given group was calculated through the lowest value of the Mahalanobis’ distance (MANLY, 2005).
RESULTS
The four Fisher’s discriminant models (FDMs) had high eingenvalues and high accumulated variances, not only for the two discriminant functions (DFs) (Table 2), but for the three DFs (VF - 88%, PS - 96%, no QCSP - 91%, and IMBR - 100%, non-presented data). The FDMs also showed high canonic correlation values for each DF (Table 2).
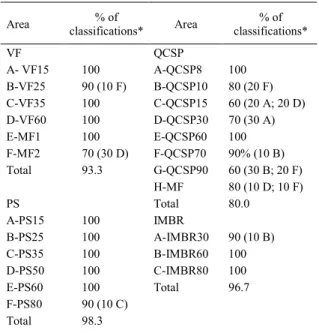
Three chronosequences (VF, PS, and IMBR) had high values (>90%) of correct classifications of the soil features in the forest ages, where QCSP had the lowest correct classification
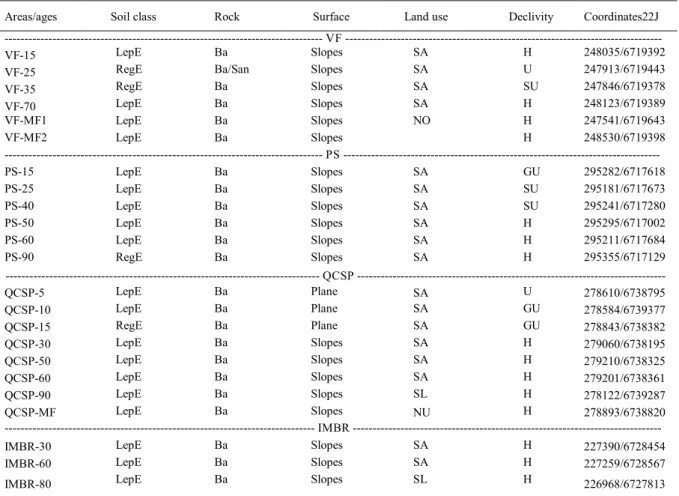
Table 1 - Forest chronosequences analyzed in the central region of southern plateau edge (SPE) in Rio Grande do Sul, South of Brazil.
Areas/ages Soil class Rock Surface Land use Declivity Coordinates22J
VF
---VF-15 LepE Ba Slopes SA H 248035/6719392
VF-25 RegE Ba/San Slopes SA U 247913/6719443
VF-35 RegE Ba Slopes SA SU 247846/6719378
VF-70 LepE Ba Slopes SA H 248123/6719389
VF-MF1 LepE Ba Slopes NO H 247541/6719643
VF-MF2 LepE Ba Slopes H 248530/6719398
PS
---PS-15 LepE Ba Slopes SA GU 295282/6717618
PS-25 LepE Ba Slopes SA SU 295181/6717673
PS-40 LepE Ba Slopes SA SU 295241/6717280
PS-50 LepE Ba Slopes SA H 295295/6717002
PS-60 LepE Ba Slopes SA H 295211/6717684
PS-90 RegE Ba Slopes SA H 295355/6717129
- QCSP
---QCSP-5 LepE Ba Plane SA U 278610/6738795
QCSP-10 LepE Ba Plane SA GU 278584/6739377
QCSP-15 RegE Ba Plane SA GU 278843/6738382
QCSP-30 LepE Ba Slopes SA H 279060/6738195
QCSP-50 LepE Ba Slopes SA H 279210/6738325
QCSP-60 LepE Ba Slopes SA H 279201/6738361
QCSP-90 LepE Ba Slopes SL H 278122/6739287
QCSP-MF LepE Ba Slopes NU H 278893/6738820
IMBR
---IMBR-30 LepE Ba Slopes SA H 227390/6728454
IMBR-60 LepE Ba Slopes SA H 227259/6728567
IMBR-80 LepE Ba Slopes SL H 226968/6727813
(80%) (Table 3). Sixteen forest soils presented specific features related to a given forest age (100% of the cases correctly classified). Most of the plots had a strong correspondence with forest age versus soil features (from 80 to 90% of the sub-plots correctly classified) and a few areas with divergencies (60 and 70% sub-units correctly classified) (Table 3).
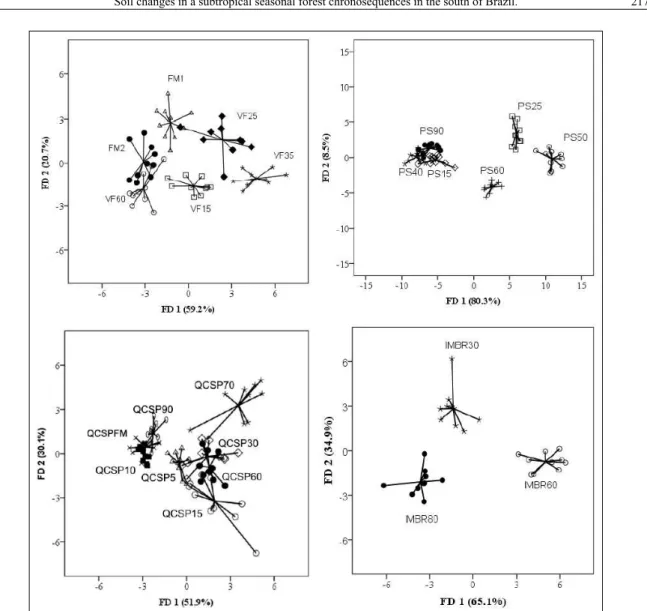
Not all the 14 variables included in the FDMs were able to distinguish soils of different forest ages. The models suggested different numbers of soil variables for each chronosequence (VF and PS - nine, QCSP - eight, and IMBR- four) to distinguish forest ages (Table 2). Weight correlations of each variable in each FDM (Table 2) showed the soil features that could be considered as good indicators of soil changes towards the forest succession. Two variables (N% and clay %) were presented in the four chronosequences and the variables of grain size had the largest contribution for the FDMs (except in QCSP) (Table 2). The two-dimensional maps of the four FDMs showed a non-regular distribution of the forest ages towards the two ordination axes, with no trends of linear changes of the soil features through the succession (Figure 1 A-D).
Table 2 - Results of the four Fisher’s discriminant models for the soil features in four forests chronosequences of the southern edge plateau, state of Rio Grande do Sul, Brazil.
VF PS QCSP IMBR
Discriminant Functions
---Variables 1 2 1 2 1 2 1 2
Eingenvalues 9.0 3.1 53.3 5.6 5.8 3.4 5.1 2.7
% variation 59.2 20.7 80.3 8.5 51.9 30.1 65.1 34.9
% acum. var. 59.2 79.9 80.3 88.9 51.9 82.0 65.1 100.0
Can. cor. 0.94 0.87 88.9 0.92 0.92 0.88 0.91 0.85
Features 1 2 1 2 1 2 1 2
Ca -0.23 -0.03 - - -
-Mg - - 0.02 -0.13 0.09 0.02 -
-K 0.22 0.40 0.06 -0.26 0.73 0.03 -
-H+Al 0.02 0.34 - - 0.26 -0.55 -
-N (%) - - -0.05 0.19 0.32 0.39 -0.21 0.04
C (%) - - -0.04 0.20 - - -0.22 0.10
CECef - - 0.01 -0.35 - - -
-CECpot - - 0.04 -0.40 - - -
-V (%) - - -0.02 -0.12 0.15 0.43 -
-SB -0.18 0.03 - - 0.33 -0.01 -
-Sand 0.77 -0.01 - - - - -0.60 0.20
Clay -0.15 0.74 0.07 0.45 0.37 -0.40 0.87 0.38
Silt - - 0.75 -0.09 -0.46 -0.01 -
-Chronosequencies: VF- Silveira Martins; PS- Paraíso do Sul; QCSP-State Park of Quarta Colônia; BRIM–Biological Reserve of Ibicuí Mirim.% acum. var.- Percentage of the accumulated variation; Can. cor.- Canonic correlation; CTCef. - Effective CEC; CTCpot.-Potential CEC.
Table 3 - Classification of the soil features of four forests chronosequences of the southern edge plateau, through the Fisher’s discriminant analysis.
Area classifications*% of Area classifications*% of
VF QCSP
A- VF15 100 A-QCSP8 100
B-VF25 90 (10 F) B-QCSP10 80 (20 F)
C-VF35 100 C-QCSP15 60 (20 A; 20 D)
D-VF60 100 D-QCSP30 70 (30 A)
E-MF1 100 E-QCSP60 100
F-MF2 70 (30 D) F-QCSP70 90% (10 B) Total 93.3 G-QCSP90 60 (30 B; 20 F)
H-MF 80 (10 D; 10 F)
PS Total 80.0
A-PS15 100 IMBR
B-PS25 100 A-IMBR30 90 (10 B)
C-PS35 100 B-IMBR60 100
D-PS50 100 C-IMBR80 100
E-PS60 100 Total 96.7
F-PS80 90 (10 C)
Total 98.3
DISCUSSION
The FDMs showed that different soil chemical and grain size features were sufficient to distinguish significantly the forest soil ages in the four chronosequences of the SPE. The efficiency of the FDMs was similar to studies using the same statistic technique to differing chemical and physical properties of the soil in different environmental conditions (ZHANG et al., 2006; ASTEL, 2008; YE & WRIGHT, 2010). The biggest soil classification errors in the different forest ages were observed in the QCSP forests, in the region with the longest time of intensive and diversified soil use (>40 years alternating pastures and agriculture) in relation to other chronosequencies.The intensive soil use alters the soil properties, including its capacity to retain mineral nutrients (BARNES et al., 2008).
The FDMs of this study mostly showed that fertile Leptosols and Regosols can change their characteristics along time with the vegetation succession. Attributes related to soil fertility (basic
cations - Ca, Mg, and K and N%, C%) and the soil
grain size (clay, silt, and sand) characterized the forest soils ages. Attributes of the soil fertility are strongly altered under agricultural use of soils, they are good indicators of the soil quality (SCHOEBENHOLTZ
et al., 2000; NORTCLIFF, 2002; AN et al., 2008). In
the SPE, secondary forests over slopes with ages of 35, 55, and 90 years showed an increasing nutrients accumulation on the soil through litter (N>Ca>K>Mg) (BRUN et al., 2011). This natural condition of nutrients increasing and the great floristic variability in different forest ages (KILCA, unpublished data) shows how difficult is to rank soil indicators in
common for all chronosequences. Moreover, less evident factors that also interfere on the soil chemical and grain size changes through the forest succession need to be considered in the analyses. They can be related to mineralogical variations of the volcanic rocks in the relief (PEDRON et al., 2009; 2010) and the historical soil use of each site (BARNES et al., 1998) as well as small scale natural variability of the soils (NORTCLIFF, 2002). The variables pH, Na, Al e Al% were not firstly included in the FDMs due to their low variabillity in the ANOVA tests and their weak importance on differing leptosols and regosols. A few features evaluated separately showed the tendency of increasing towards the increase of abandonment time (KILCA, unpublished data).
The study method of chronosequences has been efficient to describe the pedogenetic evolution of the soil in time scales from a few to thousands of years. This study, however, did not show the soil evolutionary direction during decades of vegetation development. So, it is not in accordance with the more traditional theory on the soil formation, where the soil evolves up to reach a balance with the environmental conditions (HUGGETT, 1998). The results of this study better fit in the theory of a pedogenetic evolution, where random environmental events promote an unpredictable sequence of soil development. Non-linearity of the process is related to the environmental conditions (due to exchanges, permanent additions, losses, tranfers, and changes in the enviromental substances).
This study showed that eutrophic’s leptosols and regosols can present features significantly different towards one decade of forest development. However the soils features change in a non-linear way through the forest succession. This turns more difficult predictions of specific indicators shared by different soils due to the structure and floristic variation during the vegetation dynamics and other scale-dependent factors. Permanent studies on soil dynamics in the same forest area could improve the predictability of the changes in indicators just in a small scale.
ACKNOWLEDGEMENTS
This study was part of the PhD thesis of the first author. The research activities were funded by the “Programa Universal” of Conselho Nacional de Desenvolvimento Científico e Tecnológico (CNPq) (n. 477409/2010-5) while his fellowship was granted by Coordenação de Aperfeiçoamento de Pessoal de Nível Superior (CAPES). The authors are very grateful to SEMA-RS (Dra. Suzane B. Marcuzzo and Felipe K. Rangel), COSEMA-RSAN- CORSAN-RS (Mr. Roberto B. Cavalheiro), and Mr. Vanderlei Mezzomo (┼) to permit data collection in their properties. The authors also acknowledge the very useful suggestions given by three reviewers.
REFERENCES
AN, S. et al. Soil quality degradation processes along a deforestation chronosequence in the Ziwuling area, China. Catena, v.75,
p.248-256, 2008. Available from: <http://naldc.nal.usda.gov/naldc/ download.xhtml?id=27011&content=PDF>. Accessed: Nov. 14, 2013. doi: 10.1016/j.catena.2008.07.003.
ASTEL, A., et al. Effect of environmental conditions on chemical profile of stream water in sanctuary forest area. Water, Air and Soil Pollution, v.195, p.137-149, 2008. Available from: <http://
link.springer.com/article/10.1007%2Fs11270-008-9733-9>.
Accessed: Jan. 14, 2012. doi: 10.1007/S11270-008-9733-9.
BARNES, B.V. et al. Forest ecology. 4.ed. New York: John Wiley & Sons, 1998. 774p.
BROWN, M.T.; WICKER, L.R. Discriminant analysis. In: TINSLEY H.E.A.; BROWN, S.D. (Eds.). Handbook of applied multivariate statistics and mathematical modelin. San Diego:
Academic, 2000. p.209-234.
BRUN, E.J. et al. Aspecto da ciclagem do material orgânico e nutrientes da serapilheira. In: SCHUMACHER, M.V. et al. (Orgs.). A
floresta estacional subtropical: caracterização e ecologia no rebordo
do Planalto Meridional. Santa Maria: Palloti, 2011. p.195-213.
CORDEIRO, J.L.P.; HASENACK, H. Cobertura vegetal atual do Rio Grande do Sul. In: PILLAR, V.D. et al. (Eds.). Campos sulinos: conservação e uso sustentável da biodiversidade. Brasilia:
Ministério do Meio Ambiente, 2009. p.285-299.
EMBRAPA (EMPRESA BRASILEIRA DE PESQUISA
AGROPECUÁRIA). Manual de métodos de análises de solo.
2.ed. Rio de Janeiro: Ministério da Agricultura e do Abastecimento,
1997. 212p.
FRELICH, L.E. Forest dynamics and disturbance regimes:
studies from temperate evergreen-deciduous forest. Cambridge: Cambridge University, 2002. 280p.
GUARIGUATA, M.R.; OSTERTAG, R. Neotropical secondary forest succession: chances in structural and functional
characteristics. Forest Ecology and Management, v.148,
p.185-206, 2001. Available from: <http://lerf.eco.br/img/ publicacoes/2001_3011%20Neotropical%20secondary%20 forest%20succesion.pdf>. Accessed: Dec. 14, 2010. PII:
S0378-1127(00) 00535-1.
HUGGETT, R.J. Soil chronosequences, soil development, and soil evolution: a critical review. Catena, v.32, p.155-172, 1998.
Available from: <http://www.sciencedirect.com/ science/article/ pii/S0341816298000538>. Accessed: Dec. 15, 2010. PII:
S0341-8162(98)000 53-8.
INMET (INSTITUTO NACIONAL DE METEOROLOGIA). Normais climatológicas do Brasil 1961-1990. RAMOS, A.M. et al. (Orgs.) Brasília, DF: INMET, 2009. 465p.
MANLY, B.F.J. Multivariate statistical methods: a Primer. 3.ed.
Boca Raton: Chapman & Hall, 2005. 214p.
MOJIRI, A. et al. Effects of land use changes on soil quality attributes (a review). Research Journal of Agriculture and Biological Sciences,
NORTCLIFF, S. Standardization of soil quality attributes.
Agriculture, Ecosystems and Environment, v.88. p. 161-168,
2002. Available from: <http://www.researchgate.net/profile/ Stephen_Nortcliff/publication/223516232_Standardisation_of_ soil_quality_attributes/links/0912f5063127801b7a000000.pdf>. Accessed: Dec. 06, 2013. PII: S0167-8809(01)00253-5.
PEDRON, F. de A. et al. Morfologia e classificação taxonômica de Neossolos e saprolitos derivados de rochas vulcânicas da Formação Serra Geral no Rio Grande no Sul. Revista Brasileira de Ciência do Solo, v.33, p.119-128, 2009. Available from:
<http://www.scielo.br/readcube/epdf.php?doi=10.1590/S0100-06832009000100013&pid=S0100-06832009000100013&pdf_ path=rbcs/v33n1/13.pdf>. Accessed: Nov. 10, 2013. doi: 10.1590/
S0100-06832009000100013.
PEDRON, F. de A. et al. Morfologia dos contatos entre solo-saprolito-rocha em Neossolos derivados de arenitos da Formação
Caturrita no Rio Grande do Sul. Revista Brasileira de Ciência do Solo, v.34, p.1941-1950, 2010. Available from: <http://www.scielo.
br/scielo.php?pid=S0100-06832010000600019&script=sci_ arttext>. Accessed: Nov. 10, 2013. doi:
10.1590/S0100-06832010000600019.
SCHOENHOLTZ, S.H. A review of chemical and physical properties as indicators of forest soil quality: challenges and
opportunities. Forest Ecology and Management, v.138,
p.335-356, 2000. Available from: <http://soilslab.cfr.washington.edu/
ESRM410/WhatIf3/ Schoenholtz-etal-2000.pdf>. Accessed: Nov.
10, 2013. PII: S 0378-1127(00)00423-0.
SPICHIGER, R. et al. Geographical zonation in the Neotropical of tree species characteristic of the Paraguay-Paraná basin. Journal of Biogeography, v.31, p.1489-1501, 2000. Available from: <http://
onlinelibrary.wiley.com/doi/10.1111/j.1365-2699.2004.01071.x/ full>. Accessed: Oct. 10, 2010. doi:
10.1111/j.1365-2699.2004.01071.x
YEMEFACK, M. et al. Empirical modelling of soil dynamics along a chronosequence of shifting cultivation systems in southern Cameroon. Geoderma, v.133, p.380-397, 2006. Available from:
<http://www.sciencedirect.com/science/journal/00167061/133>. Accessed: Oct. 10, 2010. doi: 10.1016/jgeoderma.2005.08.003.
YE, R.; WRIGHT, A.L. Multivariate analysis of chemical and microbial properties in histosols as influenced by land-use types.
Soil & Tillage Research, v.110, p.94-100, 2010. Available from:
<http://www.sciencedirect.com/science/journal/01671987/110/1>. Accessed: Sep. 13, 2013. doi: 10.1016/j.still.2010.06.013.
ZHANG, C.B. et al. Characterization of soil physico-chemical and microbial parameters after vegetation near ShaoguanPb/Zn Smelter, Guangdong, p.r. China. Water, Air, and Soil Pollution,
v.177, p. 81-101, 2006. Available from: <http://link.springer.com/ article/10.1007/s11270-006-9096-z>. Accessed: Sep. 13, 2013.