Acta Scientiarum
http://www.uem.br/acta ISSN printed: 1806-2636 ISSN on-line: 1807-8672
Doi: 10.4025/actascianimsci.v36i4.24446
The impact of dietary dry yeast on lactation curves of primiparous
and multiparous Saanen goats
Ludmila Couto Gomes*, Claudete Regina Alcalde, Rodrigo de Souza, Bruna Susan de Labio
Molina, Daniela Andressa de Lino Lourenço and Elias Nunes Martins
Departamento de Zootecnia, Universidade Estadual de Maringá, Av. Colombo, 5790, 87020-900. Maringá, Paraná, Brazil. *Author for Correspondence. E-mail: [email protected]
ABSTRACT. Twenty-four Saanen goats (fifteen multiparous and nine primiparous) during their lactation period were used, from the kidding until the 200th day of lactation; and were distributed in a completely randomized design and in a factorial arrangement (3 diets x 2 parity orders). The diets were composed of either soybean meal (SBM), soybean meal plus inactive dry yeast (SMDY) or inactive dry yeast (DY) used as the protein source. The analyses of milk yield, body weight and dry matter intake (DMI) were made through the Bayesian methodology. For construct the lactation curves were used the Wood’s nonlinear model. The inclusion of inactive dry yeast in the diets reduced the rate of yield increase until the lactation peak for primiparous goats, but for multiparous goats the reverse was noted. The SMDY diet reduced the rate of yield decline after peak for primiparous goats, whereas for multiparous goats the inclusion of inactive dry yeast in the diet increased the decline of the rate of yield during this period. It was observed that inactive dry yeast can be used to replace soybean meal in diets used for multiparous Saanen goats. Keywords: bayesian methodology, milk productivity, Wood’s nonlinear model, Saccharomyces cerevisiae.
O impacto de dietas com levedura seca nas curvas de lactação de cabras Saanen primíparas
e multíparas
RESUMO. Foram utilizadas 24 cabras Saanen em lactação (15 multíparas e nove primíparas) do parto até 200 dias de lactação, distribuídas no delineamento inteiramente casualizado em arranjo fatorial (3 rações x 2 ordens de parto). As rações foram constituídas por farelo de soja (FS), farelo de soja + levedura seca (FSLV) ou levedura seca (LV) como fonte de proteína. Para análise da produção de leite, do peso corporal e da ingestão de matéria seca foi utilizada a metodologia Bayesiana. E, para construir as curvas de lactação foi utilizada o modelo não-linear de Wood. A inclusão de levedura seca nas rações diminuiu a taxa de acréscimo da produção de leite até o pico de lactação para as primíparas, porém para as multíparas foi observado efeito inverso. Para as cabras primíparas, a ração FSLV diminuiu a taxa de decréscimo da produção após o pico, embora para as multíparas a inclusão de levedura seca nas rações aumentou a taxa de decréscimo da produção após o pico. A levedura seca pode ser utilizada em substituição ao farelo de soja em rações para cabras Saanen multíparas em lactação.
Palavras-chave: metodologia Bayesiana, produção de leite, modelo não-linear de Wood, Saccharomyces cerevisiae.
Introduction
The control of lactating is a determining factor for the success of goat milk production systems. Through the knowledge about the lactation curve helps to plan the nutrition management, in order to maximize the milk yield and quality. It also estimates the lactation persistency, the time of the peak yield, the duration of the peak and the highest production, all of which are tools used by breeders to select their animals.
There are different models for the study of lactation curves. However, the parameters used in these models are not adequate for some situations, because some events, like parity number, breed, female age and feeding, can have undesired effects on the milk
yield estimation (ZAMBOM et al., 2005; RODRIGUES et al., 2006). The Wood’s model has been adopted in the majority of lactation curve studies because it allows for the estimation of basic curve features, such as the highest milk production, the time to reach this level of production and its persistency, using only three parameters (WOOD, 1967).
A considerable amount of physiological adaptations happen to the dairy goats during the lactation period, such as the increase in the dry matter intake, milk production and loss of body weight due to the lack of nutrients needed to support the milk production from early lactation to the peak. From the peak to the end of lactation, the intake returns to the normal levels, the production decreases and a recovery of body weight takes place.
The commercialization of coproducts is a profitable alternative to minimize the environmental impact of sugar and alcohol industries. The dry yeast which is composed of inactive cells of Saccharomyces
cerevisae, is one of these coproducts; therefore, it is an
alternative feed used for livestock. This is a good source of nutrients such as protein, vitamins (B vitamins, especially), minerals (iron, zinc and selenium) carbohydrates that make up cell wall (20 to 40%), and a significant amount of nucleotides (VALADARES FILHO et al., 2010).
This study hypothesized that inactive dry yeast could partially or totally replace soybean meal in primiparous or multiparous dairy goats without detrimental effects on dry matter intake, milking production and body weights during the lactation period. Thus, the purpose of this research was to evaluate the dry matter intake, the lactation curves and the body weights of primiparous and multiparous Saanen goats receiving diets with inactive dry yeast.
Material and methods
Goats and experiment treatments
This research was conducted in the dairy goats sector at the Iguatemi Experimental Farm, and in the Laboratory of Food Analysis and Animal Nutrition belonging to State University of Maringá, Paraná State. Twenty-four Saanen goats were used during lactation, wherein fifteen multiparous and nine primiparous were chosen for this study. They were distributed in a completely randomized design with a factorial arrangement (3 diets x 2 parity orders). The criteria used to put the animals in the treatments were body weight, milk yield and age for multiparous goats and body weight for primiparous goats. The multiparous goats were between three and four years of age and were in the third lactation, whereas the primiparous goats had their first kidding at two years old.
The goats were allocated individually in suspended stalls with a feeder, and a trough for water and mineral supplement, and all goats were kept in feedlots with access to the solarium after the first milking of the day. No goats were mated during
the experiment and the male goat was allocated at more than 100 meters from the feedlot where the goats were allocated.
After kidding, goats and their kids were weighed weekly until the 60th day of lactation. Thereafter they
were weighed biweekly until the 200th lactation day.
The measurements were always taken after the first milking of the day and before the morning feed. The daily control of milk yield was realized twice a day, at 7:30 a.m. and 3:00 p.m., and the goats were always fed after milking at 9:30 a.m. and 4:00 p.m. The diets were composed of soybean meal (SBM), soybean meal plus inactive dry yeast (SBDY) or inactive dry yeast (DY) alone as the source of protein. The inactive dry yeast
(Saccharomyces cerevisiae) was 95.0% dry matter and
40.4% crude protein, whereas the other ingredients in the concentrate were: ground corn, mineral-vitamin mixture, limestone and corn silage (27.6% of dry matter, 7.4% of crude protein and 56.7% of neutral detergent fibre) with a roughage:concentrate ratio of 40:60 (Table 1).
Table 1. Formulation and chemical composition of diets.
Item, %
Diet1
SBM SBDY DY
Corn silage 40.00 40.00 40.00
Ground corn 42.53 39.73 35.79
Soybean meal 16.60 9.72
Inactive inactive dry yeast 9.72 23.41
Limestone 0.37 0.34 0.30
Mineral-vitamin supplement2 0.50 0.50 0.50
Dry matter, % 65.40 65.50 65.09
Organic matter, % DM 96.11 96.38 96.73
Ash, % DM 3.89 3.62 3.27
Crude protein, %DM 16.01 15.56 15.66
Rumen degradable protein, % CP3
59.91 65.67 70.82
Ether extract, % DM 3.39 2.79 2.46
Neutral detergent fiber, % DM 31.10 29.84 27.71
Acid detergent fiber, % DM 15.35 14.72 13.81
Total carbohydrate, % DM 76.81 78.04 78.64
1SBM: soybean meal; SBDY: soybean meal + inactive dry yeast and DY: inactive dry yeast.
2Chemical composition (per kg of product) of commercial mixture®: Ca 240.0 g; P 71.0 g; F
710.0 mg (Max); Mg 20.0 g; K 28.2 g; S 20.0 g S; Fe 2,500 mg; Cu 400 mg; Mn 1,350 mg; Zn 1,700 mg; Co 30 mg; I 40 mg; Se 15 mg; Cr 10 mg; Vitamin A 135,000 IU; Vitamin D3 68,000
IU; Vitamin E 450 IU. 3Estimated from values of rumen-degradable protein (NRC, 2007).
The diets were calculated to attend to the nutritional requirements of Saanen goats with body weights of 60 kg, and a milk yield of 3.0 kg per day. According to the NRC (2007), it is 77% of total digestible nutrients, 16% of the crude protein, 0.45% of the calcium and 0.32% of the phosphorus related to the dry matter.
The diets were offered according to the body weight and daily control of orts, which was around 10%. The intake was determined by the difference between the quantity offered and the daily orts.
Samples collection and analyses
with one composed sample also taken each time. The samples were stored in a freezer and were pre-dried using forced ventilation, at a temperature of 55oC, over 72 hours. Finally, the samples were
powdered by a Wiley type mill, using a 1 mm sieve. The content of dry matter was determined in the samples. The contents of dry matter (DM), ash, crude protein (CP) and ether extract (EE) were determined in the diet samples following the techniques described by the AOAC (1998), while the organic matter (OM) was estimated by the difference between the ash and the dry matter. The neutral detergent fibre (NDF) was determined following the methodology of Van Soest et al. (1991), and the acid detergent fibre (ADF) was determined using the methodology of Goering and Van Soest (1970). The total carbohydrate (TC) levels were estimated according to Sniffen et al. (1992), using the following equation:
TC (%) = 100 – (%CP + %EE + %ash).
The content of rumen-degradable protein (RDP) from the diets was estimated according to the content of RDP from the NRC (2007) as follows: 72.5, 42.2, and 64.4% of crude protein for the corn silage, ground corn and soybean meal, respectively. For the inactive dry yeast the RDP of 80% of the crude protein was adopted, considering 20% of the nitrogen from the protein in the form of nucleic acids (YAMADA et al., 2003).
The milk yield was corrected to 3.5% of fat, according to the Gravert equation (MAVROGENIS; PAPACHRISTOFOROU, 1988):
FCM (3.5%) = 0.4337MY + 16.218 FY;
where:
FCM: fat corrected milk (kg day-1);
MY: milk yield (kg day-1);
FY: fat yield (kg day-1).
Statistical analysis
The analyses of the trend of milk yield, body weight and dry matter intake were made through the Bayesian methodology, using the software BUGS 0.5 (SPIEGELHALTER et al., 1996) and the software R (R DEVELOPMENT CORE TEAM, 2009).
In order to obtain the trend of milk yield, the Wood’s nonlinear model was assumed, according to the equation:
Y = AnBexp(-Cn);
where:
Y = milk yield (kg) in the time n (days in lactation);
A is the initial milk yield (kg),
B is the increase rate of yield until lactation peak, C is the decline rate of yield in the after lactation peak and expis the base of the natural logarithm.
Among the treatments, the parameters from the lactation curve, the average daily milk yield and the total milk yield during the research period were compared. From the parameters of the model, the time of peak yield (P), and the milk yield in the peak (PP) were calculated; where P = B/C and PP = A (B/C)B Exp(-B).
Non-informative Priors were considered for the parameters of the model. A gamma distribution was assumed for parameter A, and a uniform distribution for parameters B and C.
For body weight and dry matter intake, a cubic regression model was adopted:
Y = b0 + b1n + b2n² + b3n³;
where:
Y is the body weight (kg) or dry matter intake (kg day-1) in the period n (days),
b0, b1, b2, and b3 are the regression coefficients.
A non-informative normal distribution was considered as priors for the parameters b0, b1, b2, and
b3 of the regression equation.
For each parameter, 20,000 values were generated in an MCMC (Monte Carlo Markov Chain)process, considering a sample discard period of 2,000 initial values. The final sample was taken with steps of 20, which means that for every 20 values taken, one was included in the sample, with 900 values generated. The multiple comparisons procedure was based on the a posteriori samples of the estimates of the parameters. Significant differences were considered at the level of 5% among the treatments if the zero value was not contained in the credibility interval of the desired contrast. The convergence of the final chains was checked using the test described by Heidelberger and Welch (1983).
Results and discussion
The dry matter intake increased gradually during early lactation. The maximum dry matter intake occurred between the 64th and 81st day of lactation
for the multiparous goats receiving the SBDY and DY diets, respectively, and occurred on the 78th
yeast until the 51st lactation day with 1.13 kg day-1
being the smallest intake. Conversely, the primiparous goats receiving the SBM diet revealed an increase in their intake until the end of the lactation period (Figure 1).
Figure 1. Dry matter intake of primiparous and multiparous Saanen goats receiving diets containing inactive dry yeast.
The dry matter intake of the multiparous goats showed similar behaviour among the diets. However, after the 100th lactation day a decline in
the intake was observed for the multiparous does that received the DY diet. The multiparous goats had an early dry matter intake (b0) of 0.29 kg
(26.1%), which was higher than that of the primiparous goats (Table 2).
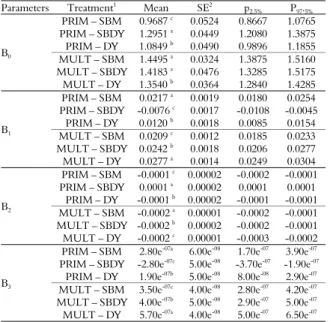
Table 2. Values of regression coefficients for dry matter intake, with their credibility intervals (p2.5% - p97.5%), in level of 95%, for primiparous and multiparous Saanen goats receiving diets with inactive dry yeast.
Parameters Treatment1 Mean SE2 p
2.5% P97.5%
B0
PRIM – SBM 0.9687 c 0.0524 0.8667 1.0765
PRIM – SBDY 1.2951 a
0.0449 1.2080 1.3875
PRIM – DY 1.0849 b 0.0490 0.9896 1.1855
MULT – SBM 1.4495 a 0.0324 1.3875 1.5160
MULT – SBDY 1.4183 a 0.0476 1.3285 1.5175
MULT – DY 1.3540 b
0.0364 1.2840 1.4285
B1
PRIM – SBM 0.0217 a 0.0019 0.0180 0.0254
PRIM – SBDY -0.0076 c
0.0017 -0.0108 -0.0045
PRIM – DY 0.0120 b 0.0018 0.0085 0.0154
MULT – SBM 0.0209 c 0.0012 0.0185 0.0233
MULT – SBDY 0.0242 b
0.0018 0.0206 0.0277
MULT – DY 0.0277 a 0.0014 0.0249 0.0304
B2
PRIM – SBM -0.0001 c
0.00002 -0.0002 -0.0001
PRIM – SBDY 0.0001 a 0.00002 0.0001 0.0001
PRIM – DY -0.0001 b 0.00002 -0.0001 -0.0001
MULT – SBM -0.0002 a 0.00001 -0.0002 -0.0001
MULT – SBDY -0.0002 b 0.00002 -0.0002 -0.0001
MULT – DY -0.0002 c 0.00001 -0.0003 -0.0002
B3
PRIM – SBM 2.80e-07a 6.00e-08 1.70e-07 3.90e-07
PRIM – SBDY -2.80e-07c 5.00e-08 -3.70e-07 -1.90e-07
PRIM – DY 1.90e-07b
5.00e-08
8.00e-08
2.90e-07
MULT – SBM 3.50e-07c
4.00e-08
2.80e-07
4.20e-07
MULT – SBDY 4.00e-07b 5.00e-08 2.90e-07 5.00e-07
MULT – DY 5.70e-07a
4.00e-08
5.00e-07
6.50e-07
1SBM: soybean meal; SBDY: soybean meal + inactive dry yeast; DY: inactive dry
yeast PRIM: primiparous; MULT: multiparous. 2 SE: standard error of the mean.
3Different letters among diets indicate differences for means.
The goats have the ability to select foods according to palatability and may reject some foods
partially or fully concentrated. How dry yeast has specific flavor, which is dependent on the substrate on which it was grown, in this case the cane sugar, this factor may have contributed to the decrease in intake primiparous goats that received rations where the soybean meal was replaced by full or partial dry yeast.
There was an influence of inclusion of the inactive dry yeast in the diets, revealed by the values from milk production, with different trends seen for primiparous and multiparous goats (Figure 2).
Figure 2. Lactation curves of primiparous and multiparous Saanen goats receiving diets containing inactive dry yeast.
The inclusion of inactive dry yeast in the SBDY and DY diets improved the initial milk yield (parameter A) for the primiparous goats, and the SBDY diet enabled the maximum value (Table 3). However, for the multiparous goats, the inclusion of inactive dry yeast in their diets (SBDY and DY) resulted in smaller values for initial milk yield when compared to those on the SB diet.
Table 3. Values of Wood's nonlinear model parameters, with their credibility intervals (p2.5%- p97.5%), in level of 95%, for primiparous and multiparous Saanen goats receiving diets with inactive dry yeast
Parameter1 Treatment2 Mean SE3 p
2.5% P97.5%
A
PRIM – SBM 1.3930 c 0.0929 1.2085 1.5610
PRIM – SBDY 1.8811 a 0.1279 1.6368 2.1231
PRIM – DY 1.6958 b
0.1970 1.3049 2.0985
MULT – SBM 3.1632 a
0.1123 2.9305 3.3761
MULT – SBDY 2.7477 b 0.1695 2.4329 3.0935
MULT – DY 2.7070 b 0.1082 2.4965 2.9076
B
PRIM – SBM 0.2707 a 0.0210 0.2342 0.3159
PRIM – SBDY 0.0517 c 0.0218 0.0126 0.0973
PRIM – DY 0.1190 b 0.0386 0.0450 0.2027
MULT – SBM 0.0301 c 0.0118 0.0084 0.0553
MULT – SBDY 0.1174 b 0.0207 0.0760 0.1559
MULT – DY 0.1312 a
0.0134 0.1069 0.1573
C
PRIM – SBM 0.0031 a 0.0003 0.0025 0.0036
PRIM – SBDY 0.0007 b
0.0003 0.0001 0.0013
PRIM – DY 0.0025 a 0.0006 0.0001 0.0037
MULT – SBM 0.0005 b 0.0002 0.0002 0.0009
MULT – SBDY 0.0028 a
0.0003 0.0021 0.0034
MULT – DY 0.0026 a 0.0002 0.0021 0.0030
1A: initial milk yield; B: increase rate of yield until lactation peak; C: decline rate
of yield in the after lactation peak. 2SBM: soybean meal; SBDY: soybean meal +
inactive dry yeast; DY: inactive dry yeast PRIM: primiparous; MULT:
multiparous. 3SE: standard error of the mean. 4Different letters among diets
The increased rate of yield until the lactation peak (parameter B) was influenced by the inclusion of inactive dry yeast in the diets. For the primiparous goats, the increased rate of yield until the lactation peak decreased. However, the inverse was seen in the multiparous goats, and the DY diet caused the highest increase in the rate of yield until the lactation peak.
The mixture between inactive dry yeast and soybean meal reduced the decline in the rate of yield after peak (parameter C) for primiparous goats. Therefore, for multiparous goats, this rate increased with the inclusion of inactive dry yeast in the diets.
The primiparous goats receiving diets where the inactive dry yeast was partially replaced by soybean meal (PRIM-SBDY) and the multiparous goats receiving diets without inactive dry yeast (MULT-SB) represented smaller values of the declined rate of yield after the peak, and, consequently, a higher persistency in the lactation and a less notable peak (Table 4).
The primiparous goats receiving SB showed the highest average daily milk yield. However, multiparous goats that were fed diets where the inactive dry yeast totally replaced the soybean meal (DY) showed the highest average daily milk yield (Table 4).
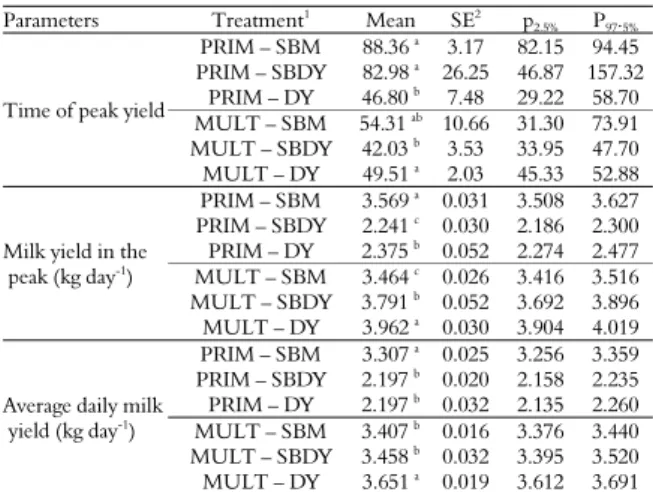
Table 4. Time of peak yield (P), milk yield in the peak (PP) and average daily milk yield (200 days); calculated from the Wood's nonlinear model parameters, with their credibility intervals (p2.5% - p97.5%), in level of 95%, for primiparous and multiparous Saanen goats receiving diets with inactive dry yeast
Parameters Treatment1 Mean SE2 p
2.5% P97.5%
Time of peak yield
PRIM – SBM 88.36 a
3.17 82.15 94.45 PRIM – SBDY 82.98 a 26.25 46.87 157.32
PRIM – DY 46.80 b 7.48 29.22 58.70
MULT – SBM 54.31 ab 10.66 31.30 73.91
MULT – SBDY 42.03 b 3.53 33.95 47.70
MULT – DY 49.51 a 2.03 45.33 52.88
Milk yield in the peak (kg day-1)
PRIM – SBM 3.569 a 0.031 3.508 3.627
PRIM – SBDY 2.241 c 0.030 2.186 2.300
PRIM – DY 2.375 b
0.052 2.274 2.477
MULT – SBM 3.464 c
0.026 3.416 3.516
MULT – SBDY 3.791 b 0.052 3.692 3.896
MULT – DY 3.962 a
0.030 3.904 4.019
Average daily milk yield (kg day-1)
PRIM – SBM 3.307 a 0.025 3.256 3.359
PRIM – SBDY 2.197 b
0.020 2.158 2.235
PRIM – DY 2.197 b 0.032 2.135 2.260
MULT – SBM 3.407 b
0.016 3.376 3.440
MULT – SBDY 3.458 b 0.032 3.395 3.520
MULT – DY 3.651 a 0.019 3.612 3.691
1SBM: soybean meal; SBDY: soybean meal + inactive dry yeast; DY: inactive dry yeast
PRIM: primiparous; MULT: multiparous. 2SE: standard error of the mean. 3Different
letters among diets indicate differences for means.
The lower milk production of the primiparous goats receiving diets including inactive dry yeast can be explained by the possible differences in the metabolizable protein in the diets. According to NRC (2001) the rumen-undegradable protein (RPU) shows an efficiency of 80% with regards to the use of protein, whereas the rumen-degradable
protein (RPD), bacterial protein, has 64% of efficiency use. Therefore, the inclusion of inactive dry yeast increased the RPD from the diet (Table 2) and, as a consequence, the total of metabolized protein from the diet decreased. The primiparous goats were in the growth stage, meaning that they had a higher demand of amino acids, and that the decline of metabolizable protein by the inclusion of inactive dry yeast possibly did not attend to their nutritional requirements.
Zambom et al. (2005) studied lactation curves in Saanen goats using Wood’s nonlinear model, and observed values for the increasing yield rate ranging from 0.10 to 0.27. Takma et al. (2009) found that the increasing rate of yield was 0.13 when analyzing Saanen goats using the Wood’s model.
The milk production is directly related to the dry matter intake. Thus, a reduction in the dry matter intake was noticed for the primiparous goats receiving the SBDY treatment (PRIM-SBDY), and, as a consequence, the increased rate of yield until the lactation peak was smaller, leading to a decreased production during the peak, despite the higher initial milk yield compared to other treatments.
The primiparous goats had a peak day of production later than the multiparous goats, reflecting differences in productive ability between the two parity orders. The goats that took more time to reach the peak had the highest milk production during the peak (PP).
The observed values of average daily milk yield ranged from 2.20 to 3.65 kg day-1. Zambom et al.
(2005) used Saanen goats from the early lactation to the 152 days in milking, and observed average daily milk yields ranging from 1.87 to 3.41 kg day-1,
and when roughage was used as a function of reason, the highest observed production was from the goats that received diets with 40% of roughage.
The goats lost weight until the 78th day after
the kidding, with the smallest weight lost being 47.0 kg in primiparous goats and 61.7 kg in multiparous goats. The primiparous goats that received the SBDY diet showed more marked weight loss, until the 84th day after lactation
(Figure 3). The primiparous goats receiving the SBDY diet showed the highest initial body weight (b0) (Table 5), however, their intermediate body
Figure 3. Body weight of primiparous and multiparous Saanen goats receiving diets containing inactiv e dry yeast.
The inclusion of inactive dry yeast in the SBDY and DY diets caused a decrease in the dry matter intake for primiparous goats. However, the multiparous goats showed the highest dry matter intake when they received the SBDY diet (Table 5).
The weight loss in the early lactation period occurred because of the negative energetic balance, in other words, the goats could not ingest the nutrient amounts necessary for corporal maintenance and milk production, which results in the mobilization of the energetic reserves. This is natural in the early phase of milk production in ruminants, when metabolism acquires energy through gluconeogenesis.
Table 5. Values of regression coefficients for body weight, with their credibility intervals (p2.5% - p97.5%), in level of 95%, for primiparous and multiparous Saanen goats receiving diets with inactive dry yeast
Parameters Treatment1 Mean SE2 p
2.5% P97.5%
B0
PRIM – SBM 58.2975 b 2.7028 52.8303 63.4425
PRIM – SBDY 60.3195 a 2.2590 55.7508 64.6173
PRIM – DY 59.2861 b 2.0364 55.1613 63.1620
MULT – SBM 77.3792 ab 3.9230 77.1980 85.3605
MULT – SBDY 77.9683 a
2.6249 73.1638 83.3105 MULT – DY 76.3316 b 2.3268 72.0738 81.0553
B1
PRIM – SBM -0.3114 a
0.1151 0.5435 -0.0832 PRIM – SBDY -0.4529 b 0.0962 -0.6468 -0.2621
PRIM – DY -0.3060 a
0.0868 -0.4808 -0.1339 MULT – SBM -0.4823 ab
0.1620 -0.8121 -0.1695 MULT – SBDY -0.3830 a 0.1094 -0.6037 -0.1737
MULT – DY -0.4931 b 0.0961 -0.6887 -0.3076
B2
PRIM – SBM 0.0029 b 0.0013 0.0003 0.0055
PRIM – SBDY 0.0037 a 0.0010 0.0016 0.0059
PRIM – DY 0.0029 b
0.0010 0.0010 0.0059
MULT – SBM 0.0044 ab
0.0018 0.0009 0.0080
MULT – SBDY 0.0034 b 0.0012 0.0010 0.0058
MULT – DY 0.0043 a
0.0011 0.0022 0.0064
B3
PRIM – SBM -6.87e-06a 3.92e-06 -1.50e-05 9.80e-07
PRIM – SBDY -7.79e-06a
3.28e-06
-1.45e-05
-1.23e-06
PRIM – DY -7.49e-06a 2.96e-06 -1.36e-05 -1.58e-06
MULT – SBM -1.09e-05ab 5.67e-06 -2.25e-05 -2.80e-07
MULT – SBDY -7.95e-06 a 3.79e-06 -1.55e-05 -8.40e-07
MULT – DY -1.03e-05b 3.36e-06 -1.70e-05 -4.03e-06
1SBM: soybean meal; SBDY: soybean meal + inactive dry yeast; DY: inactive dry
yeast PRIM: primiparous; MULT: multiparous. 2SE: standard error of the mean.
3Different letters among diets indicate differences for means.
After the period of negative energetic balance that occurred in the early lactation, the goats
regained weight, as a result of the equilibrium between dry matter intake and milk production. The primiparous goats fed the SBDY diet showed the highest rate of body weight recovery (b2), while multiparous goats ingesting the same diet had the lowest rate.
Table 6. Average body weight and average dry matter intake with their credibility intervals (p2.5% - p97.5%), in level of 95%, for primiparous and multiparous Saanen goats receiving diets with inactive dry yeast.
Parameters Treatment1 Mean SE2 p
2.5% P97.5%
Average body weight (kg)
PRIM – SBM 52.0400 ab 0.9067 50.2400 53.7500
PRIM – SBDY 49.7100 b 0.9454 47.7800 51.5900
PRIM – DY 52.2400 a
0.7121 50.8900 53.6500 MULT – SBM 66.4200 ab
1.2340 63.9200 68.7000 MULT – SBDY 68.8400 a 0.8738 67.1500 70.4600
MULT – DY 63.7900 b 0.8250 62.2500 65.4100
Average dry matter intake (kg day-1
)
PRIM – SBM 1.9400 a 0.0181 1.9050 1.9730
PRIM – SBDY 1.5450 b 0.0163 1.5130 1.5770
PRIM – DY 1.4360 c 0.0122 1.4120 1.4610
MULT – SBM 2.1520 b 0.0102 2.1320 2.1720
MULT – SBDY 2.1950 a 0.0137 2.1690 2.2220
MULT – DY 2.0320 c
0.0110 2.0110 2.0550 1
SBM: soybean meal; SBDY: soybean meal + inactive dry yeast; DY: inactive dry yeast
PRIM: primiparous; MULT: multiparous. 2SE: standard error of the mean. 3Different
letters among diets indicate differences for means
Among the multiparous goats, those that received the DY diet presented with the smallest average body weight and the smallest average dry matter intake (Table 6). However, these goats also provided the highest average daily milk yield (Table 4), which highlights the productive potential of these goats. The primiparous goats receiving the SBM diet, presented the smallest dry matter intake (b0) in the early lactation period (Table 2), but the average of dry matter intake (kg day-1) was higher
when compared to primiparous goats receiving the SBDY and DY diets. This is because of the increased dry matter intake (b1) for these goats after kidding (Table 2).
Conclusion
The inactive dry yeast could be used to replace the soybean meal in diets provided to multiparous Saanen goats during lactation because changes were not observed in the parameters of the lactation curve, or in the dry matter intake and body weight. However, this replaced diet should be used carefully in primiparous goats, since losses in milk production were observed.
References
AOAC-Association of Official Analytical Chemists. Official methods of analysis. 16th ed. Gaithersburg: AOAC, 1998.
GOERING, H. K.; VAN SOEST, P. J. Forage fiber analyses (apparatus, reagents, procedures, and some applications). Washington, D.C.: ARS/USDA Agriculture Handbook, 1970.
HEIDELBERGER, P.; WELCH, P. D. Simulation run length control in the presence of animal transient. Operations Research,v. 31, n. 6, p. 1109-1144, 1983. MAVROGENIS, A. P.; PAPACHRISTOFOROU, C. Estimation of the energy value of milk and prediction of fat-corrected milk yield in sheep and goats. Small Ruminant Research,v. 1, n. 3, p. 229-236, 1988. NRC-National Research Concil. Nutrient requirements of dairy cattle. 7th ed. Washingnyon, D.C.: National Academies Press, 2001.
NRC-National Research Council. Nutrient requirements of small ruminants. Washington, D.C.: National Academies Press, 2007.
R DEVELOPMENT CORE TEAM. R: A language and environment for statistical computing. Vienna: R Foundation for Statistical Computing, 2009.
RODRIGUES, L.; SPINA, J. R.; TEIXEIRA, I. A. M. A.; DIAS, Â. C.; SANCHES, A.; RESENDE, K. T. D. Produção, composição do leite e exigências nutricionais de cabras Saanen em diferentes ordens de lactação. Acta Scientiarum. Animal Sciences, v. 28, n. 4, p. 447-452, 2006.
SILVA, F. F.; MUNIZ, J. A.; AQUINO, L. H.; SÁFADI, T. Abordagem Bayesiana da curva de lactação de cabras Saanen de primeira e segunda ordem de parto. Pesquisa Agropecuária Brasileira,v. 40, n. 1, p. 27-33, 2005. SNIFFEN, C.; O'CONNOR, J.; VAN SOEST, P.; FOX, D.; RUSSELL, J. A net carbohydrate and protein system for evaluating cattle diets: II. Carbohydrate and protein availability. Journal of Animal Science,v. 70, n. 11, p. 3562-3577, 1992.
SPIEGELHALTER, D.; THOMAS, A.; BEST, N.; GILKS, W. BUGS 0.5:Bayesian inference using Gibbs
sampling manual (version II). Cambridge: MRC Biostatistics Unit/Institute of Public Health, 1996.
TAKMA, C.; AKBAŞ, Y.; TASKIN, T. Modeling lactation curves of Turkish Saanen and Bornova goats. Asian Journal of Animal and Veterinary Advances, v. 4, n. 3, p. 122-129, 2009.
VAN SOEST, P. J.; ROBERTSON, J. B.; LEWIS, B. A. Methods for dietary fiber, neutral detergent fiber, and nonstarch polysaccharides in relation to animal nutrition. Journal of Dairy Science, v. 74, n. 10, p. 3583-3597, 1991.
VALADARES FILHO, S. C.; MACHADO, P. A. S.; CHIZZOTTI, M. L.; AMARAL, H. F.; MAGALHÃES, K. A.; ROCHA JUNIOR, V. R.; CAPPELE, E. R. Tabelas brasileiras de composição de alimentos para bovinos - CQBAL 3.0. 3. ed. Viçosa: UFV, 2010.
WOOD, P. D. P. Algebraic model of the lactation curve in cattle. Nature,v. 206, p. 164-165, 1967.
YAMADA, E. A.; ALVIM, I. D.; SANTUCCI, M. C. C.; SGARBIERI, V. C. Composição centesimal e valor protéico de levedura residual da fermentação etanólica e de seus derivados. Revista de Nutrição,v. 16, n. 4, p. 423-432, 2003.
ZAMBOM, M. A.; ALCALDE, C. R.; MARTINS, E. N.; SANTOS, G. T. D.; MACEDO, F. D. A. F. D.; HORST, J. A.; VEIGA, D. R. D. Curva de lactação e qualidade do leite de cabras Saanen recebendo rações com diferentes relações volumoso: concentrado. Revista Brasileira de Zootecnia, v. 34, n. 6, p. 2515-2521, 2005.
Received on July 15, 2014. Accepted on July 24, 2014.