Genetic evaluation of Pinus taeda clones from somatic embryogenesis and their genotype x environment interaction
55
Crop Breeding and Applied Biotechnology - 18: 55-64, 2018
Genetic evaluation of
Pinus taeda
clones from
somatic embryogenesis and their genotype x
environment interaction
Poliana Coqueiro Dias
1*, Aloizio Xavier
2, Marcos Deon Vilela de
Resende
2, Márcio Henrique Pereira Barbosa
3, Fabrício Antonio
Biernaski
4and Regiane Abjaud Estopa
4Abstract: The objective of this study was to evaluate the genotype x environment interaction and to estimate the genetic components of variance and mean us
-ing mixed models in early selection of 238 clones of Pinus taeda propagated by
somatic embryogenesis. The experiment consisted of a complete blocks design, with 12 replications, with one plant per plot, in four environments, at 1, 3, and 4 years of age. Estimates of heritability and of genetic gains in the evaluated environments showed good prospects for selection of superior genotypes. The effect of genotype x environment interaction was pronounced for all traits in
-vestigated. With the simultaneous selection for stability and adaptability, 10% genetic gain was obtained in relation to the mean of the commercial controls. This estimated gain indicates that the somatic embryogenesis technique has been effective in propagation of clones with good productive potential.
Key words:Forestry improvement, clonal silviculture, genetic selection, early
selection.
Crop Breeding and Applied Biotechnology 18: 55-64, 2018 Brazilian Society of Plant Breeding. Printed in Brazil http://dx.doi.org/10.1590/1984-70332018v18n1a8 ARTICLE
*Corresponding author:
E-mail: [email protected]
Received: 01 December 2016 Accepted: 27 March 2017
1 Universidade Federal Rural do
Semi-árido (UFERSA), Departamento de Ciências Agronômicas e Florestais, 59.625-900, Mos-soró, RN, Brazil 2 Universidade Federal de Viçosa (UFV), De-partamento de Engenharia Florestal, 36.571-000, Viçosa, MG, Brazil 3 Universidade Federal de Viçosa, Departa-mento de Fitotecnia 4 Klabin do Paraná Produtos Florestais (KPPF),
84.279-000, Telêmaco Borba, PR, Brazil
INTRODUCTION
In Brazil, Pinus taeda has presented better development in the South and
Southeast regions (Martinez et al. 2012). The increase in yield observed in Pinus taeda plantations is mainly due to the use of genetically superior material derived
from breeding programs (Mckeand et al. 2006, Martinez et al. 2012). In view of the positive impacts of Pinus breeding programs on the production of raw
material suitable for the manufacturing of long fiber cellulose (Mckeand et al. 2006, Martinez et al. 2012), their implementation in agricultural corporations is fundamental for yield increase. Considering the limitations of genetic gains in programs traditionally developed by seminiferous propagation, cloning tends to play important role in the consolidation of the competence of Brazilian industries in this market.
The negative effects of ontogeny have led to difficulties in clonal propagation and have consequently made the use of Pinus taeda clones on a commercial
scale unviable (Pullman and Bucalo 2011). The cuttings collected from adult
Pinus taeda trees are difficult to root (Alcantara et al. 2007, 2008), and the
taeda cloning programs (Pullman et al. 2006, Alcantara et al. 2008, Andrejow et al. 2009, Pullman and Bucalo 2011). This
way, plant yield can be significantly improved due to the multiplication of desirable genotypes derived from breeding programs (McKeand et al. 2008). Thus, somatic embryogenesis should be used in breeding programs of Pinus taeda
as long as the genotype x environment interaction comes from immature zygotic embryos, given the effects related to ontogenetic age in Pinus taeda (Pullman et al. 2006, Pullman et al. 2011).
In a forestry-breeding program, genetic evaluation of individuals and their relations with the planting environments is a fundamental step. Due to environmental variations, phenotype variations also occur in function of the genotype x environment interaction, being one of the greatest problems of breeding programs of any species, whether at the stages of selection or recommendation of cultivars. Nevertheless, analyses of phenotypic adaptability and stability can be used, which identify cultivars responsive to environmental variations and with foreseeable behavior (Cruz et al. 2004, Resende 2007, Rosado et al. 2012). In this context, the mixed models method (REML/BLUP) is considered as more accurate (Resende 2007), since it provides better experimental accuracy, and is more efficient than analysis of variance, especially in cases with unbalanced data. Moreover, the predicted genetic values can be used to estimate the adaptability and stability of genotypes using the harmonic mean of the relative performance of genetic values (HMRPGV), which allows estimating adaptability and stability simultaneously in a single parameter (Resende 2007).
In general, forestry-breeding programs consider the results of juvenile-mature correlation analyses to carry out early selection, due to the long crop rotation cycle. In the case of Pinus taeda, studies have presented good results
with early selection (Paludzyszyn Filho et al. 2001, 2002, 2003, Isik et al. 2005, Mckeand et al. 2006, Martinez et al. 2012). The objective of this study was to evaluate the genotype x environment interaction and to estimate the genetic components of variance and mean using the mixed models (REML/BLUP) in early selection of Pinus taeda individuals
propagated by somatic embryogenesis.
MATERIAL AND METHODS
The study was carried out by genetic-statistical analysis of part of the experimental network of Pinus taeda of the Klabin
S.A. Corporation, which is composed of 238 clones propagated by somatic embryogenesis, using megapethophytes from immature seeds of matrices selected in the company. Somatic embryos were obtained by the methodology described in the U.S. Pat. N. 5506136 A (BECWAR et al., 1996). Clonal tests were set up in the states of Parana and Santa Catarina, in 2007, using seedlings at 10 months of age (propagated by somatic embryogenesis). Seedlings were produced in 55 cm³ tubes, using decomposed pine bark as substrate, with periodic fertilizations of NPK and micronutrients solution. Subsoiling was carried out at 50 cm depth. In the field, weed control was performed with herbicide (glyphosate) in the total area, one month before planting, and 4, 12, 18, 24 and 36 months after planting. Leaf-cutting ants control was carried out using formicide baits. The experimental consisted of a complete blocks design, with twelve replications, spaced 3 m x 2 m between plants, with one plant per plot, in four environments, two in Santa Catarina and two in Parana. Three lots of commercial seeds were used as controls.
According to the Köppen climate classification, environments 1 and 2, in the state of Santa Catarina, are characterized as Cfb; and environments 3 and 4, in the state of Parana, are located in a transitional climate region between Cfa and Cfb. Environments 1 and 2 have lower average temperatures and a greater number of frosts than environments 3 and 4. The soil of environment 1 is classified as Inceptisol, with clayey texture, and slightly rolling to rolling relief. The soil of environment 2 is classified as Oxisol, with clayey texture, and slightly rolling to rolling relief. Finally, the soil of environment 3 is classified as Ochrept or Umbrept, with medium texture, with rolling to steeply rolling relief. Environment 4 is classified as Psamment, with sandy and medium light texture, and rolling to steeply rolling relief.
Diameter – DBH (in cm, measured at 1.30 m from the soil surface), total height – Ht (in m), volume – Vol (m3), and survival
rate at 1, 3, and 4 years of age of Pinus taeda clones were measured. DBH was measured using a diameter tape, and height
was obtained using a relascope. For volume calculation, the following formula was used: Vol =
(
3.1416 × DBH2Genetic evaluation of Pinus taeda clones from somatic embryogenesis and their genotype x environment interaction
57
Crop Breeding and Applied Biotechnology - 18: 55-64, 2018
Analyses were carried out by the estimate of variance components (Reml) and by the genetic value prediction (Blup), using the software Selegen-Reml/Blup (RESENDE 2002b). Variables were evaluated individually per environment, and in combination of environments. In evaluation of the individuals within each environment, the variables were analyzed using the univariate linear mixed model of the software Selegen-Reml/Blup, presented by Resende (2002a), according to the model: y = Xr + Zg + Wb + e, in which: y = data vector; r = replication effect vector (assumed as fixed) added to the overall mean; g = genotypic effect vector (assumed as random); b = block effect vector (assumed as random); and e = error or residue value (assumed as random). Uppercase letters represent the incidence matrices for the respective effects. The statistical model for the analysis of this experimental network in several environments, considering one observation per plot, is given by: y = Xr + Zg + Wb + Tge + e, in which: y = data vector; r = replication effect vector (assumed as fixed) added to the overall mean; g = genotypic effect vector (assumed as random); ge = genotype x environment interaction effect vector (assumed as random); b = block effect vector (assumed as random); and e = error or residue value (assumed as random). Uppercase letters represent the incidence matrices for the respective effects.
Stability and adaptability were simultaneously evaluated by the harmonic mean of relative performance of genetic values (HMRPGV), according to Resende (2007). All analyses were carried out using the software Selegen-Reml/Blup. With the predicted genetic values, genetic correlations were obtained between the traits evaluated in combined analysis with the environments.
RESULTS AND DISCUSSION
Evaluation in each location
Considering the evaluations in the third and in the fourth years, heritability values for clones means in relation to the traits height, DBH, and volume were of high magnitude (from 60% to 82%), and significant by the likelihood ratio test
at 5% significance. This fact results in high accuracies in the selection of clones propagated by somatic embryogenesis, indicating expressive genetic control for these traits in Pinus taeda clones (Table 1). These estimates are in agreement
with those reported for Pinus taeda by Isik et al. (2003) for volume (0.70), and by Isik et al. (2005) for growth traits
(0.50 to 0.75). Since the family structure is considerably different between these studies, it is inferred that growth traits in Pinus taeda are under moderate to strong genetic control, and that the somatic embryogenesis technique did not
affect the expression of these traits.
The estimates of broad-sense individual heritability were lower than those obtained at the mean level of the clone, and varied according to the environment and year of evaluation (Table 1). Heritability estimates of low to moderate magnitude have been observed in other species propagated by somatic embryogenesis, such as in Pseudotsuga menziesii at five and a half years after planting (height = 0.25 ± 0.01; DBH = 0.21 ± 0.01; and volume = 0.20 ± 0.01) (Dean 2008);
and in Picea glauca at four years after planting (height = 0.137 ± 0.041) (Wahid et al. 2012).
The lowest values for heritability, accuracy, and coefficient of genotypic variation at all the ages were observed in environment 1, in Santa Catarina (Table 1). The other environments presented better conditions for the development and expression of the genetic potential of clones, providing, in these cases, better conditions to detect existing variation and, consequently, greater possibilities of genetic gains with selection. Environment 1 presented edaphic traits inferior to those of the other environments, and this may have influenced gene expression of the clones propagated by somatic embryogenesis, which negatively reflected in the genetic parameters evaluated in this study.
The coefficient of genotypic variation (CVgi) of the traits evaluated in this study had little variation, considering the three ages of study and the four environments. Environment 1 in Santa Catarina had the lowest coefficients of genotypic variation at the three ages of evaluation (ranging from 6.2 % to 10.5 % for height; 9.2% to 11.7 % for DBH;
0.6% to 5.5% for survival rate; and 21.8% to 28.8% for volume), as observed in Table 1. Of the traits evaluated, volume had the greatest coefficients of genotypic variation at all ages (greater than 20%). The presence of considerable genetic variability, as observed in this study, indicates the possibility of practicing selection among clones, especially for volume (Resende 2007). Thus, it is possible to obtain genetically significant gains in selection of Pinus taeda clones propagated
by somatic embryogenesis.
Cr
op Br
eeding and Applied Biot
echnology -
18: 55-64, 2018
t al.
the clone s in sur viv ing unde r the conditions in w hic h the expe rim w er e de ve lope d. Sur viv al ra te al l th e exp eri men ts w as high , n 100%; this is pr obably be cause ma trice s se le ct ed for cloning by soma emb ry og en esi s w er e ad ap ted the e nv ir onme nt al conditions th e exp eri men ts. Fo r th is reaso th er e w as not en ough vari ab ility se le ction in this tr ait. The se re sults indic ate the st abilit y of the clone pro pag ated by so ma tic emb ryog en in rela tion to sur viv al ability in diff er en vir onmen ts. The high sur viv al rat for P inus t ae da clone s con fir m tha the clone s pr opag ate d by som embr yog enesis ma y be es tablish ed diff ere nt en vir onme nts. In addition, resu lt d emon str ates th at th e cl on ing Pi nus t aeda by soma tic embr yog enesi is viable, pr oducing gene tic ally stable indiv iduals with good de ve lopmein the field.
Combined analy sis of en vir onmen ts The he rit abilit y e stim ate s re por in the combine d analy sis le ad expr essiv e se le ctiv e accur acie s the studie d tr aits, e spe cially volume (T able 2). Ne vertheless, these herit ability es tima tes w er e lo w when compar ed with those found in indiv idual analy sis pe r e nv ironm (T able 1). This indic ate s tha t individuals should be select ed. The rela tiv ely es tima tes for herit ability in the traits ev alua te d in the combine d analy of en vi ronmen ts (T abl e 2) sug th at oth er fact ors, besi des gen etics, str on gl y a ffect th ese trai ts, su ch as en vir onmen tal eff ects of sit es and
genotype x en
vir onmen t in ter action. Corr ob or ating the da ta ob tai ned this study , Xiang et al. (2003) ob se rve in ful l-si b fami lies of Pi nus t aeda tha t the ideal ag e for early selection, consideri ng vol ume and the DBH, from 4 to 5 year s. Gw az e et al. (2001)
clones propagated by somatic embryogenesis, at one, three, and four years of age, for the four clonal tests.
Parameter Year
Santa Catarina Paraná
Site 1 Site 2 Site 3 Site 4
Ht DBH sur vol Ht DBH sur vol Ht DBH sur vol Ht DBH sur vol
h2g
1 0.095 0.058 0.004 0.067 0.311 0.228 0.004 0.274 0.332 0.234 0.025 0.289 0.274 0.225 0.004 0.247
3 0.241 0.183 0.145 0.177 0.364 0.314 0.004 0.340 0.305 0.421 0.027 0.417 0.269 0.314 0.031 0.331
4 0.224 0.201 0.193 0.192 0.231 0.366 0.004 0.375 0.134 0.255 0.012 0.336 0.321 0.271 0.008 0.326
c2bloc
1 0.056 0.046 0.001 0.033 0.001 0.024 0.000 0.007 0.005 0.063 0.009 0.035 0.016 0.037 0.030 0.027
3 0.042 0.064 0.002 0.066 0.006 0.008 0.001 0.009 0.132 0.004 0.014 0.019 0.060 0.034 0.021 0.024
4 0.025 0.040 0.000 0.032 0.022 0.003 0.000 0.002 0.425 0.279 0.076 0.081 0.058 0.125 0.022 0.058
h2mc
1 0.438* 0.311* 0.027 0.341* 0.720* 0.637 0.022 0.685* 0.763* 0.685* 0.172 0.733* 0.669* 0.617* 0.024 0.642* 3 0.681* 0.608* 0.029 0.599* 0.764* 0.724 0.023 0.746* 0.774* 0.820* 0.173 0.822* 0.656* 0.695* 0.173 0.822* 4 0.667* 0.640* 0.062 0.625* 0.640* 0.765 0.022 0.771* 0.706* 0.808* 0.118 0.818* 0.722* 0.692* 0.051 0.771*
Acclon
1 0.654 0.581 0.164 0.600 0.830 0.785 0.148 0.810 0.841 0.795 0.415 0.823 0.812 0.785 0.155 0.797
3 0.796 0.757 0.170 0.752 0.855 0.832 0.152 0.846 0.849 0.878 0.416 0.879 0.817 0.837 0.416 0.844
4 0.782 0.767 0.249 0.758 0.786 0.856 0.148 0.860 0.781 0.850 0.344 0.856 0.844 0.829 0.226 0.847
Overall mean
1 0.805 1.828 0.993 0.083 0.873 1.905 0.991 0.083 1.172 2.679 0.952 0.083 1.176 2.545 0.853 0.083
3 3.855 5.925 0.982 3.333 3.946 6.103 0.991 3.611 4.086 7.247 0.943 5.833 5.570 5.782 0.839 4.444
4 5.145 9.753 0.981 8.750 5.253 10.423 0.991 10.208 6.976 10.430 0.904 13.958 7.872 7.976 0.839 8.958
CVe (%)
1 31.302 36.039 8.513 105.646 21.294 19.993 11.314 60.404 22.435 23.128 20.546 78.949 22.910 24.711 39.101 61.176 3 15.599 23.769 10.795 54.799 13.225 21.073 11.309 46.125 16.493 20.120 22.386 56.055 22.747 19.488 39.811 49.734 4 11.379 19.372 11.280 43.742 9.905 16.722 11.868 35.710 18.788 18.662 31.007 42.612 20.433 19.235 41.319 44.924
CVgi (%)
1 10.471 9.165 0.553 28.801 14.302 11.044 0.738 37.259 15.866 13.345 3.463 51.534 14.231 13.666 2.537 35.680 3 9.042 11.737 4.446 26.514 10.044 14.336 0.739 33.324 12.134 17.221 3.789 48.210 14.416 13.535 7.190 35.675 4 6.222 9.979 5.513 21.766 5.511 12.738 0.757 27.684 10.231 13.813 3.492 32.391 14.675 12.897 3.846 32.699 h2g: Coefficients of broad-sense individual heritability, free of interaction; c2bloc: coefficient of determination of the block effects; h2mc: heritability of clone mean; Acclon: accuracy of selection of genotypes; CVe (%):
Genetic evaluation of Pinus taeda clones from somatic embryogenesis and their genotype x environment interaction
59
Crop Breeding and Applied Biotechnology - 18: 55-64, 2018
reported similar results when evaluating Pinus taeda families at 5 to 25 years of age. These results, once again, show that
1 year of age is not adequate for selection. This is because early selection does not reveal the presence of competition among plants, which is manifested in the evaluations at 3 and 4 years, in addition to the lower heritability.
Significant genetic variability is observed by the likelihood ratio test at 5% significance among the clones evaluated in the combined analysis in the state of Santa Catarina, Parana, and in all environments, as shown by the heritability estimates and their standard deviations (Table 2). The values of the coefficient of genotypic variation (CVgi) for DBH and
height in the three years of study were of approximately 7%; however, considering the combined analysis among the environments, the volume showed values greater than 22% in the three years of evaluation. The coefficient of genotypic variation for volume demonstrates that selection of genotypes is possible; this is because the CVgi is greater than 10%, which is enough to practice effective selection among clones (Resende 2002).
Genotypic correlation among the environments (rgloc) was moderate to high for almost all the traits evaluated in the first year of the study, ranging from 0.38 to 0.93. However, in the third and fourth years, genotypic correlation among the environments was of low to moderate magnitude for almost all the traits evaluated, ranging from 0.28 to 0.65 (Table 2). According to Table 2, the experiments revealed low coefficients of determination of the effects of the genotype x environment interaction at the ages evaluated.
Genotypic correlation greater than 0.67 are considered as high, and indicates that a single breeding program simultaneously and satisfactorily meets the demands of all the environments evaluated in the present work (Resende 2002a). In this study, the combined analysis of all environments was moderate, which requires differentiated selection for the different environments, indicating that some genotypes may have superior performance in one environment, Table 2. Estimates of genetic parameters for diameter (DBH), height (Ht) and volume (vol) of Pinus taeda clones propagated by somatic
embryogenesis, at four ages, in relation to the four clonal tests (two in Santa Catarina and two in Parana)
Parameter Year Santa Catarina (SC) Paraná (PR) Combined SC/PR
Ht DBH vol Ht DBH vol Ht DBH vol
h2g
1 0.064 0.077 0.080 0.171 0.100 0.121 0.099 0.074 0.076
3 0.114 0.100 0.086 0.087 0.133 0.161 0.079 0.119 0.133
4 0.154 0.116 0.106 0.088 0.126 0.144 0.067 0.124 0.132
c2int
1 0.076* 0.006 0.016 0.068* 0.063* 0.084* 0.115* 0.063* 0.125*
3 0.169* 0.125* 0.146* 0.109* 0.094* 0.129* 0.142* 0.118* 0.160* 4 0.074* 0.143* 0.156* 0.142* 0.105* 0.152* 0.174* 0.127* 0.173*
h2mg
1 0.336* 0.471* 0.463 * 0.615* 0.499* 0.504* 0.540* 0.533* 0.470* 3 0.384* 0.387* 0.335* 0.417* 0.551* 0.528* 0.479* 0.593* 0.528* 4 0.548* 0.411* 0.378* 0.387* 0.522* 0.484* 0.387* 0.527* 0.484*
Acgen
1 0.579 0.686 0.680 0.784 0.706 0.709 0.735 0.730 0.686
3 0.620 0.622 0.579 0.646 0.742 0.727 0.692 0.770 0.727
4 0.740 0.641 0.615 0.622 0.722 0.696 0.622 0.726 0.696
rgloc
1 0.455 0.927 0.837 0.715 0.615 0.590 0.463 0.540 0.378
3 0.403 0.445 0.371 0.444 0.588 0.555 0.358 0.502 0.455
4 0.657 0.448 0.404 0.388 0.547 0.487 0.278 0.494 0.433
Overall mean
1 0.847 1.883 0.083 1.238 2.761 0.083 1.040 2.314 0.083
3 3.913 6.024 3.611 4.959 6.757 5.556 4.441 6.399 4.722
4 5.224 10.106 9.583 6.993 9.842 12.708 6.108 9.956 11.042
CVge (%)
1 7.973 9.523 28.071 12.478 10.099 30.599 9.824 9.104 27.974
3 5.990 8.439 17.628 8.992 12.108 30.418 7.483 10.493 26.948
4 4.921 7.375 15.294 8.155 11.349 25.700 6.094 9.537 22.474
CVe (%)
1 27.482 30.859 89.212 21.429 22.576 64.290 24.071 26.131 76.953
3 14.686 22.718 50.877 19.169 19.803 50.780 17.888 21.138 52.364
4 10.826 18.242 39.647 17.325 18.745 44.366 15.694 18.534 43.398
but not in another (Cruz et al. 2004, Resende 2007). In general, clones are more unstable than families; thus, there is a tendency of lower genotype x environment correlation in clonal tests. Nunes et al.(2002) reported that the response correlated by selection in an environment and gain in another environment has always been lower than the gain from direct selection in the environments when significant interaction is observed.
Genetic correlation among the environments indicates that selection of specific clones for each environment is recommended. In addition, from these results, adaptabilities and stabilities of clones should be taken into account when selecting these clones (Resende 2007). For analyses of genetic gain, stability, and adaptability in each environment, only the volume data will be discussed, since this trait tends to be the most representative at the initial stage of clone selection (Mckeand et al. 2006, Santos et al. 2006, Beltrame et al. 2012), and is of great commercial interest.
Genetic gains
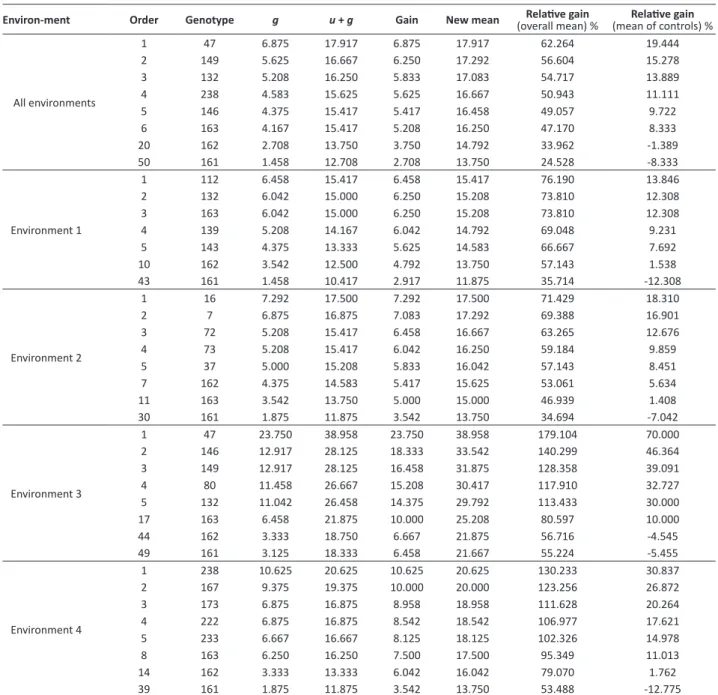
Genetic gain in relation to the overall mean of the experiment, using the five best clones according to the genotypic values, was of approximately 50% in selection in the combined analysis of environments; greater than 69% in environment 1; 57% in environment 2; and greater than 100% in environments 3 and 4, in the state of Parana (Table 3). However, when compared with the mean value of the controls (matrices 161, 162, and 163), the genetic gain using the same five best clones decreased to values from 9 to 19% in the combined analysis of environments; 7 to 13% in environment 1; 8 to 18% in environment 2; 30 to 70% in environment 3; and 15 to 30% in environment 4 (Table 3). Genetic gain, in relation to the overall mean of the experiment, indicates good possibility of gain with selection under these conditions, especially for the environments located in Parana. However, in relation to the controls, lower possibility of genetic gain was observed, when compared with the gain of the overall mean of all the clones of the experiments.
The data presented by Isik et al. (2005) corroborate those reported in this study. According to the authors, the volumes of Pinus taeda clones selected at four years of age in each environment were of 27% and 31% greater than the
mean volume of all the clones tested by Isik et al. (2005). Nevertheless, when the authors compared the gain with the families used as control, the former were around 4% to 13%. Pinus taeda breeding programs have increased volumetric
yield by 10-30% in relation to the sources not subjected to breeding (Mckeand et al. 2003, Mckeand et al. 2006). Table 3 shows the small difference between the genotypes used as controls (matrices 161, 162, and 163) and the best clones of the experiments. This indicates that these matrices have good performance in the mean of the environments, and may be considered as plastic and reasonably adapted to the different edaphic and climatic growing conditions.
The comparison of predicted genotypic gains in relation to the commercial control is essential, since the goal of a breeding program is to always improve the mean value of the genetic materials (clones) currently planted for commercial purposes, and not only to improve the mean of the population over time. Therefore, an important challenge is to develop genetic materials and selection criteria that maximize the genetic gain of new materials that surpass the mean value of the commercial control.
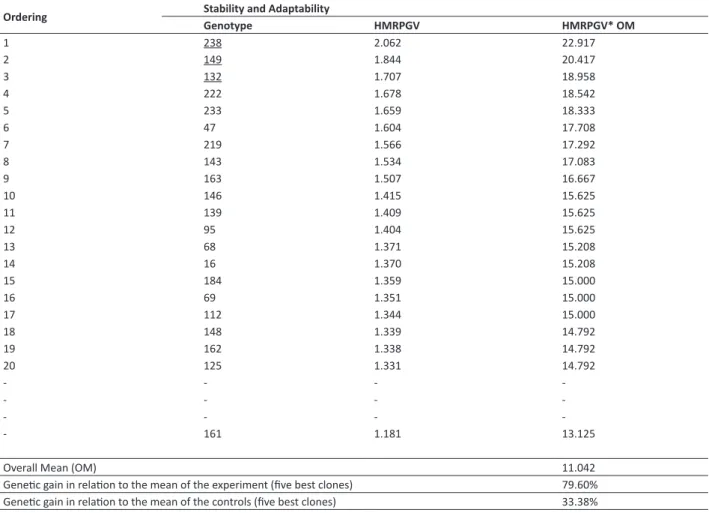
Stability and adaptability
The five best clones based on the HMRPGV (Table 4) do not totally coincide with the five best clones according to the order of genotypic values predicted by combined analysis of the environments (Table 3). Coincidence was of 80% among the five best clones, and the order among the coinciding clones was inverted. This lower estimate is associated with selection of the clones that show good performances in both environments, but which are not necessarily the best clones of each environment. The interaction reduces the correlation between the genotypic and phenotypic values, and also reduces the genetic gains with selection (Nunes 2002). This was expected, since the greatest gain is obtained with direct selection for the trait of interest and for the specific environment. The present results corroborate those reported by Martinez et al. (2012) in Pinus taeda families.
When comparing the gains obtained from HMRPGV in relation to the controls (matrices 161, 162, and 163), the mean superiority of these five genotypes was of 33.3% (Table 4).When compared with that predicted in the order of genotypic values of combined analysis of environments (Table 3), also in relation to the control, gain was of 10%.
Genetic evaluation of Pinus taeda clones from somatic embryogenesis and their genotype x environment interaction
61
Crop Breeding and Applied Biotechnology - 18: 55-64, 2018
values (HMRPGV), is advantageous for considering the three attributes (productivity, adaptability and stability) (Table 5), taking into account that these new attributes or selection criteria will lead to a more accurate selection (Resende 2007). Results show that simultaneous selection by adaptability and stability of the genotypic values (HMRPGV) generates 10% additional gain in relation to the control. According to Resende (2007), this occurs because simultaneous selection in the new genetic materials takes advantage of the gain from mean interaction between the environments, which does not occur with the genetic material used as control, since they go through many replications in the trials, and their heritability at mean level tends to be equal to 1.0 in each trial. According to Anputhas et al. (2011), the recommendation
Table 3. Ordering of Pinus taeda clones, propagated by somatic embryogenesis, according to their genotypic values and predicted
gains for volume (m3 ha-1 year-1), in combined analysis of environments and in each environment at four years of age
Environ-ment Order Genotype g u + g Gain New mean (overall mean) %Relative gain (mean of controls) %Relative gain
All environments
1 47 6.875 17.917 6.875 17.917 62.264 19.444
2 149 5.625 16.667 6.250 17.292 56.604 15.278
3 132 5.208 16.250 5.833 17.083 54.717 13.889
4 238 4.583 15.625 5.625 16.667 50.943 11.111
5 146 4.375 15.417 5.417 16.458 49.057 9.722
6 163 4.167 15.417 5.208 16.250 47.170 8.333
20 162 2.708 13.750 3.750 14.792 33.962 -1.389
50 161 1.458 12.708 2.708 13.750 24.528 -8.333
Environment 1
1 112 6.458 15.417 6.458 15.417 76.190 13.846
2 132 6.042 15.000 6.250 15.208 73.810 12.308
3 163 6.042 15.000 6.250 15.208 73.810 12.308
4 139 5.208 14.167 6.042 14.792 69.048 9.231
5 143 4.375 13.333 5.625 14.583 66.667 7.692
10 162 3.542 12.500 4.792 13.750 57.143 1.538
43 161 1.458 10.417 2.917 11.875 35.714 -12.308
Environment 2
1 16 7.292 17.500 7.292 17.500 71.429 18.310
2 7 6.875 16.875 7.083 17.292 69.388 16.901
3 72 5.208 15.417 6.458 16.667 63.265 12.676
4 73 5.208 15.417 6.042 16.250 59.184 9.859
5 37 5.000 15.208 5.833 16.042 57.143 8.451
7 162 4.375 14.583 5.417 15.625 53.061 5.634
11 163 3.542 13.750 5.000 15.000 46.939 1.408
30 161 1.875 11.875 3.542 13.750 34.694 -7.042
Environment 3
1 47 23.750 38.958 23.750 38.958 179.104 70.000
2 146 12.917 28.125 18.333 33.542 140.299 46.364
3 149 12.917 28.125 16.458 31.875 128.358 39.091
4 80 11.458 26.667 15.208 30.417 117.910 32.727
5 132 11.042 26.458 14.375 29.792 113.433 30.000
17 163 6.458 21.875 10.000 25.208 80.597 10.000
44 162 3.333 18.750 6.667 21.875 56.716 -4.545
49 161 3.125 18.333 6.458 21.667 55.224 -5.455
Environment 4
1 238 10.625 20.625 10.625 20.625 130.233 30.837
2 167 9.375 19.375 10.000 20.000 123.256 26.872
3 173 6.875 16.875 8.958 18.958 111.628 20.264
4 222 6.875 16.875 8.542 18.542 106.977 17.621
5 233 6.667 16.667 8.125 18.125 102.326 14.978
8 163 6.250 16.250 7.500 17.500 95.349 11.013
14 162 3.333 13.333 6.042 16.042 79.070 1.762
39 161 1.875 11.875 3.542 13.750 53.488 -12.775
of cultivars with broad adaptability and stability is essential for regions with different productive environments, or with distinct climatic seasons.
The selection of the 20 best Picea glauca clones based on height at four years after planting generated mean genetic gain of 4.3% (Wahid et al. 2012), which is lower than that obtained in the present study. According to the authors, this result is considered as important for selection, taking into account that the genetic gain is static and any increase generates gain in selection. Thus, for the present study, selection that considered simultaneously adaptability and stability generated gains close to 10%, and may be used for the recommendation of new clones within the breeding program of the company. Similar result was reported by Sun (2004) when evaluating the adaptability and stability of introduced families of Pinus taeda.
Results show that selection using the volume may be practiced from the fourth year after planting Pinus taeda
clones propagated through somatic embryogenesis. Due to the high magnitude of the “g x e” interaction involving Pinus taeda clones propagated by somatic embryogenesis in the two states, a single selection program cannot be adopted,
requiring selection of specific clones for the different environments, unless the attributes of adaptability and stability of the clones are used in their selection. Estimated gains confirm the efficiency of the somatic embryogenesis technique in propagation of clones with good yield, aggregating better results to Pinus breeding programs.
Table 4. Stability and adaptability of genotypic values (HMRPGV) predicted by the BLUP analysis for volume (m3 ha-1 year-1) at four
years of age
Ordering Stability and Adaptability
Genotype HMRPGV HMRPGV* OM
1 238 2.062 22.917
2 149 1.844 20.417
3 132 1.707 18.958
4 222 1.678 18.542
5 233 1.659 18.333
6 47 1.604 17.708
7 219 1.566 17.292
8 143 1.534 17.083
9 163 1.507 16.667
10 146 1.415 15.625
11 139 1.409 15.625
12 95 1.404 15.625
13 68 1.371 15.208
14 16 1.370 15.208
15 184 1.359 15.000
16 69 1.351 15.000
17 112 1.344 15.000
18 148 1.339 14.792
19 162 1.338 14.792
20 125 1.331 14.792
- - -
-- - -
-- - -
-- 161 1.181 13.125
Overall Mean (OM) 11.042
Genetic gain in relation to the mean of the experiment (five best clones) 79.60% Genetic gain in relation to the mean of the controls (five best clones) 33.38%
Genetic evaluation of Pinus taeda clones from somatic embryogenesis and their genotype x environment interaction
63
Crop Breeding and Applied Biotechnology - 18: 55-64, 2018
ACKNOWLEDGEMENTS
The authors thank Klabin S.A for providing the data for the research. This work was supported by Capes and CNPq.
REFERENCES
Alcantara GB, Ribas LLF, Higa AR and Ribas KCZ (2008) Efeitos do ácido indol-butírico (AIB) e da coleta de brotações em diferentes estações do ano no enraizamento de mini estacas de Pinus taeda L. Scientia
Forestalis36: 151-156.
Alcantara GB, Ribas LLF, Higa AR, Zuffellato-Ribas KC and Koehler HS (2007) Efeito da idade da muda e da estação do ano no enraizamento de miniestacas de Pinus taeda L. Revista Árvore 31: 399-404.
Andrejow GMP and Higa AR (2009) Potencial de enraizamento de miniestacas de Pinus Taeda L. provenientes de brotação apical de
mudasjovens. Floresta 39: 897-903.
Anputhas M, Samita S and Abeysiriwardena DSZ (2011) Stability and adaptability analysis of rice cultivars using environment-centered yield in two-way ANOVA model. Communications in Biometry and
Crop Science 6: 80-86.
Becwar MR, Chesick EE, Handley LW and Rutter MR (1996) Method for regeneration of coniferous plants by somatic embryogenesis. US n. 5506136 A, Apr. 9.
Beltrame R, Bisognin DA, Mattos BD, Cargnelutti A, Haselein CR, Gatto DA and Santos GA (2012) Desempenho silvicultural e seleção precoce de clones de híbridos de eucalipto. Pesquisa Agropecuária Brasileira 47: 791-796.
Cruz CD, Regazzi AJ and Carneiro PCS (2004) Modelos biométricos
aplicados ao melhoramento genético.Editora UFV, Viçosa, 480p.
Dean CA (2008) Genetic parameters of somatic clones of coastal douglas-fir at 5 1/2-years across Washington and Oregon, USA. Silvae Genetica
57: 269-275.
Gwaze DP, Bridgwater FE, Buram TD and Lowe WJ (2001) Genetic parameter estimates for growth and wood density in loblolly pine (Pinus taeda L.). Forest genetics 8: 47-55.
Isik F, Goldfarb B, Lebude A, Li B and McKeand S (2005) Predicted genetic gains and testing efficiency from two loblolly pine clonal trials.
Canadian Journal of Forest Research 35: 1754-1766.
Isik F, Li B and Frampton J (2003) Estimates of additive, dominance and epistatic genetic variances from a clonally replicated test of loblolly pine. Forest Science 49: 77-88.
Martinez DT, Resende MDV, Costa RB, Higa AR, Santos Gados and Fier ISN (2012) Estudo da interação genótipo x ambiente em progênies de
Pinus taeda por meio da análise de parâmetros genéticos. Floresta 42: 539-552.
McKeand S, Mullin T, Byram T and White T (2003) Deployment of genetically improved loblolly and slash pines in the South. Forestry 101: 32-37.
McKeand SE, Jokela EJ, Huber DA, Byram TD, Allen HL, Li B and Mullin TJ (2006) Performance of improved genotypes of loblolly pine across different soils, climates and silvicultural inputs. Forest Ecology Management 227: 178-184.
McKeand SE, Li B, Grissom JE, Isik F and Jayawickrama KJS (2008) genetic parameter estimates for growth traits from diallel tests of loblolly pine throughout the southeastern United States. Silvae Genetica
57: 101-110.
Nunes GHS, Rezende GDSP, Ramalho MAP and Santos JB (2002) Implicações da interação genótipos x ambientes na seleção de clones de eucalipto. Revista Cerne 8: 49-58.
Paludzyszyn Filho E, Fernandes JSC and Resende MDV (2002) Avaliação e seleção precoce para crescimento de Pinus taeda. Pesquisa Agropecuária Brasileira 37: 1719-1726.
Paludzyszyn Filho E, Mora AL and Maestri R (2001) Interação de genótipos de Pinus taeda L. com locais no sul-sudeste do Brasil. Revista Cerne 7: 90-100.
Paludzyszyn Filho E, Shimoyama VRS and Mora AL (2003) Seleção precoce para incremento simultâneo do crescimento e da qualidade da madeira em Pinus taeda L. Boletim de Pesquisa Florestal Embrapa Florestas 46: 31-46.
Pullman GS and Bucalo K (2011) Pine somatic embryogenesis using zygotic embryos as explants. Methods in Molecular Biology 710: 267-291. Pullman GS, Chopra R and Chase KM (2006) Loblolly pine (Pinus taeda
L.) somatic embryogenesis: improvements in embryogenic tissue initiation by supplementation of medium with organic acids, vitamins B12 and E. Plant Scince 170: 648-658.
Resende MDV (2002a) Genética biométrica e estatística no melhoramento
de plantas perenes. Editora Embrapa, Colombo, 975p.
Resende MDV (2002b) Software SELEGEN-REML/BLUP. Editora Embrapa, Colombo, 65p.
Resende MDV (2007) Selegen–Reml/Blup: sistema estatístico e seleção genética computadorizada via modelos lineares mistos. Editora Embrapa, Colombo, 359p.
Resende MDV and Duarte JB (2007) Precisão e controle de qualidade em experimentos de avaliação de cultivares. Pesquisa Agropecuária Tropical 37: 182-194.
Rosado AM (2012) Seleção simultânea de clones de eucalipto de acordo com produtividade, estabilidade e adaptabilidade. Pesquisa Agropecuária Brasileira 47: 964-971.
Santos GA, Xavier A and Leite HG (2006) Desempenho silvicultural de clones de Eucalyptus grandis em relação às árvores matrizes.Revista Árvore 30: 737-747.
families of Pinus taeda. Journal of Anhui Agricultural University 31: 63-367.
Wahid N, Rainville A, Lamhamedi MS, Margolis HA, Beaulieu J and Deblois J (2012) Genetic parameters and performance stability of
white spruce somatic seedlings in clonal tests. Forest Ecology and Management 270: 45-53.
Xiang L, Li B and Isik F (2003) Time trend of genetic parameters in growth traits of Pinus taeda. Silvae Genetica 52: 114-121.