CHARACTERISTICS FOR THE SELECTION OF PARENTS OF
Corymbia
citriodora
AIMING TO THE PRODUCTION OF WOOD AND ESSENTIAL OIL
1Otávio dos Santos Limeira Luz2*, Ana Beatriz Marques Honório3, Rodrigo Ribeiro Fidelis4, Ildon Rodrigues do Nascimento4, Cristiano Bueno de Moraes4 and Tarcísio Castro Alves de Barros Leal4
1 Received on 29.06.2016 accepted for publication on 14.12.2017.
2 Universidade Federal do Tocantins, Doutor em Produção Vegetal, Gurupi, TO-Brasil. E-mail: <[email protected]>. 3 Universidade Estadual Paulista Júlio de Mesquita Filho, Programa de Pós-Graduação em Ciências Biológicas, SP-Brasil.
E-mail: <[email protected]>.
4 Universidade Federal do Tocantins, Campus Universitário de Gurupi, Gurupi, TO-Brasil. E-mail:
<[email protected]>,<[email protected]>,<[email protected]> and <[email protected]>. *Corresponding author.
ABSTRACT – This study aimed to identify the most important characteristics for the selection of parent trees of Corymbia citriodora by estimating genetic dissimilarity and linear correlation degree for wood and essential oil production. This study was conducted in experimental areas of the company JAMP Florestal - located in Dueré-TO - and at Universidade Federal do Tocantins (Federal University of Tocantins), campus Gurupi, from January to April 2014, in 19 parent trees based on 19 characteristics. With the data, the following steps were performed: clustering through Tocher’s optimization method; calculation of genetic dissimilarity between parents; quantification of relative contribution; and verification of correlation degree existing among the characteristics evaluated through Pearson correlation using the program GENES. The characteristics essential oil yield and heartwood diameter presented the major contributions for genetic dissimilarity. Thus, it must be prioritized for wood production: trees with lower values in crown height and sapwood diameter; and trees with higher values in total height, commercial height, diameter at breast height and stump diameter. For essential oil production, it must be prioritized trees with lower values in leaf width, bark thickness and sapwood diameter; and trees with higher values in leaf nitrogen content, leaf potassium content, total green biomass and total dry biomass, essential oil yield, essential oil content and crown volume.
Keywords: Genetic divergence; Forest improvement; Superior trees.
CARACTERÍSTICAS PARA A SELEÇÃO DE MATRIZES DE Corymbia citriodora
VISANDO A PRODUÇÃO DE MADEIRA E ÓLEO ESSENCIAL
RESUMO – Objetivou-se com este trabalho identificar as características de maior importância para a seleção de matrizes de Corymbia citriodora para à produção de madeira e óleo essencial. O estudo foi realizado em áreas experimentais da empresa JAMP Florestal localizada em Dueré-TO e na Universidade Federal do Tocantins, Câmpus de Gurupi, entre janeiro e abril de 2014, em 19 matrizes baseado em 19 características. De posse dos dados foi realizado, o agrupamento pelo método de otimização de Tocher, calculado a dissimilaridade genética entre as matrizes, quantificado a contribuição relativa e verificado o grau de correlação existente entre as características avaliadas através da correlação de Pearson utilizando o programa GENES. As características rendimento de óleo essencial e diâmetro do cerne foram as que apresentaram as maiores contribuições para a dissimilaridade genética, devendo-se priorizar para a produção de madeira, árvores com menores valores em altura da copa e diâmetro do alburno, e árvores com maiores valores em altura total, altura comercial, diâmetro à altura do peito e diâmetro da cepa. Para a produção de óleo essencial, deve-se priorizar árvores com menores largura de folha, espessura da casca e diâmetro do alburno e árvores com maiores teor de nitrogênio foliar, teor de potássio foliar, biomassa verde e seca total, rendimento de óleo essencial, teor de óleo essencial e volume de copa.
1. INTRODUCTION
Among the most diverse forest species used in Brazil, Corymbia citriodora stands out, especially due to silvicultural and technological characteristics of the wood, such as good adaptation to the different Brazilian regions, high density, good volumetric increase, good form and sprouting capacity. Also standing out as producer of essential oil – found, mainly, at leaves – whose main component is citronellal (Boland et al., 1991; Vitti and Brito, 1999; Andrade and Gomes, 2000). Corymbia citriodora is one of the species that has been maintained sufficiently pure by not doing crosses with the majority of most commonly planted species, with genetic crosses restricted to C. torelliana and C. maculata (Pryor and Johnson, 1971).
Among the programs of genetic improvement of forest species in Brazil, few work with C. citriodora; and these are not concentrated in the regions Norte and Nordeste of Brazil. This scarcity stems from the fact that the utilization of this species is characterized for the use of few developed technologies - such as seminal seedlings planting, absence of vegetative propagation via cloning and absence of promising parents to generate superior hybrids, specific for the conditions of climate and soil of each planting site. According to Reis et al. (2013), this silvicultural relevance implies that big companies of the sector do not use this species for planting of extensive areas.
A viable strategy to explore the genetic potential of C. citriodora consists in selecting superior parent trees – and adapted to local soil and climate conditions. According to Moraes et al. (2015) one of the primary steps of an improvement program is related to the research for knowledge about the base population and its genetic variability. Thus, strategic solutions for the selection of promising genotypes for genetic improvement may be obtained through techniques that allow the simultaneous evaluation of different characteristics, using multivariate analysis. These techniques allow taking advantage of correlations between characteristics, considering a known level of significance (Caixeta et al., 2003).
In genetic improvement, the genetic dissimilarity has provided important contributions, highlighting the prediction of heterotic hybrids, through the crosses of populations with higher level of relative genetic divergence (DUDLEY et al., 1992) for the identification
of the best promising combinations, in order to generate superior hybrids. Thus, the objective of the present study was to identify the characteristics of greater importance for the selection of parents of C. citriodora through the estimation of genetic dissimilarity and the degree of linear correlation, aiming to the production of wood and essential oil.
2. MATERIAL AND METHODS
The study was conducted on February 2014, for the selection of parent trees of C. citriodora in experimental areas of the company JAMP Florestal in Duere-TO, located at latitude 11º 20' 38" South and longitude 49º 16' 14" West, altitude of 235 meters. Minimum temperature of 22,8 ºC and maximum temperature of 31,8 ºC, with average annual rainfall of 1.714 mm. 19 parents were selected based on recommendations proposed by Kageyama and Gandara (2000), Mori (2003) and Sebbenn (2003), regarding number of trees to be evaluated. The parents, aged seven years, were planted in 2008, through seminal seedlings from São Paulo and north of Minas Gerais. The planting spacing was 3 x 2 m with population of 1.667 trees per hectare. The soil was classified as dystrophic red latosol (Oxisol) (Empresa Brasileira de Pesquisa Agropecuária, 2006). For the study, the identification and location of trees on plots were performed using GPS; the cut was performed between March and April of 2014. The cut of trees were conducted at 10 cm of soil surface, evaluating, thus, for each parent, the following characteristics:
- Diameter at breast height (DBH), obtained by measurement of trunk circumference at 1,30 m height, using a tape measure, converting this measure into diameter through division by ;
- Total height (TH), in meters, measuring the length of the base of trunk – close to the ground – up to the end of crown, using a tape measure.
5 – very large, whose crown in width and height presented, respectively, among 5 and 10 meters).
- Stem height (SH), in meters, measuring the length of trunk base – close to the ground – up to the insertion of the first branch formed and constituted of living leaves, using a tape measure;
- Commercial height (CmH), in meters, measuring the length of trunk base – close to the ground – up to the diameter of 4 cm, with the help of a tape measure; - Crown height (CwH), in meters, obtained through the difference between Total Height and Stem Height; - Bark Thickness (BT), in centimeters, mean obtained after the cut of tree at 10 cm of soil surface, measuring with a graduated ruler the four quadrants of bark at stump;
- Heartwood diameter (HwD), in centimeters, mean obtained after the cut of tree at 10 cm of soil surface, measuring with a graduated ruler the two axes of the heartwood quadrant;
- Stump diameter (StD), in centimeters, average obtained after the cut of tree at 10 cm of soil surface, measuring with a graduated ruler both axes of the stump quadrant;
- Sapwood diameter (SwD), in centimeters, average obtained after the cut of tree at 10 cm of soil surface, measuring with a graduated ruler the four quadrants of sapwood at stump;
- Leaf length (LL), in centimeters, average obtained through measurement of 10 mature leaves of the tree; and - Leaf width, in centimeters, average obtained through measurement of 10 mature leaves of the tree.
After the evaluation of the characteristics described above, all leaves of each parent were removed and, then, weighed using a digital weighing scale. Posteriorly, the leaves were homogenized, with the selection of six samples in order to quantify content and yield in oil. For this, three of these samples were stored in a greenhouse at 65 ºC for 72 hours, in order to measure dry mass and nutritional content; and three samples were stored in a freezer at 4 ºC during the cut of all trees, until the beginning of extraction process, determining:
- Total leaf green biomass (TLGB), in kg, obtained after the removal of all leaves of the tree, weighed on digital weighing scale at the moment of the tree cut; and
- total leaf dry biomass (TLDB), in kg, average obtained after the removal of three samples of total green mass; drying at 65 ºC for 72 hours in forced air circulation greenhouse, then weighed on a digital weighing scale.
The drying tests, content analysis and oil yield were conducted at Laboratório de Ecofisiologia Vegetal of Universidade Federal do Tocantins (Plant Ecophysiology Laboratory of Tocantins Federal University), campus Gurupi. The essential oil extraction was performed by hydrodistillation at Clevenger appliance for an hour, in round bottomed flasks – 2000 mL capacity -, placing the chopped sample and 500 mL of distilled water into the flask. Before extraction, each sample was manually chopped into pieces of 0,25 cm2, identifying humidity content, through infra-red, in order to quantify content and yield of oil. After the extraction, the oil was collected and weighed. Subsequently, the essential oil content was determined, in % (EOC), calculating essential oil weight/sample dry mass weight and stored in Amber glass bottles. After extraction and collection of oil, the Clevenger appliance was washed with P.A hexane and, then, with distilled water for cleaning of oil remnants. Calculations of essential oil yield were performed, in kg ha-1 (EOY), obtained through oil content x total dry mass of leaves - estimated in ha, based on spacing of 3 x 2 m, with a population of 1.667 plants. For the analysis of nutrients content, in order to quantify and correlate them to the other characteristics, three samples were dried in greenhouses at 65 ºC for 72 hours; then they were ground at Wyllie type mill Star FT 48 with sieves of 0,5 mm to compose conditions of dry leaf biomass; so, the following characteristics were determined:
- Leaf Nitrogen content (LNC), in %, through the methodology of sulfur digestion, adapted from Tedesco et al. (1995);
- Leaf Phosphorus content (LPC), in %, through the methodology of sulfur digestion, adapted from Tedesco et al. (1995); and
- Leaf Potassium content (LKC), in %, through sulfur digestion methodology, adapted from Tedesco et al. (1995).
and Regazzi, 2001), through standardized Euclidean distance. The cluster analyses were carried out by Tocher’s optimization method through, according to Vasconcelos et al. (2007), UPGMA (Unweighted Pair-Group Method with Arithmetic Mean), known as “average link between groups” – which is indicated in order to evaluate the dissimilarity level between genotypes, being used in the formation of groups of genotypes with higher dissimilarity between each other.
Singh (1981) criterion was used for the quantification of relative contribution of these characteristics on genetic dissimilarity; and Pearson correlation analysis was used in order to verify the degree of correlation between the characteristics assessed.
The statistical analyses of data were performed using the computer program GENES version 2013.5.1 (CRUZ, 2008). Subsequently, the genotypes ranking was done, according to the averages of characteristics with higher importance on the study for wood and essential oil production.
3. RESULTS
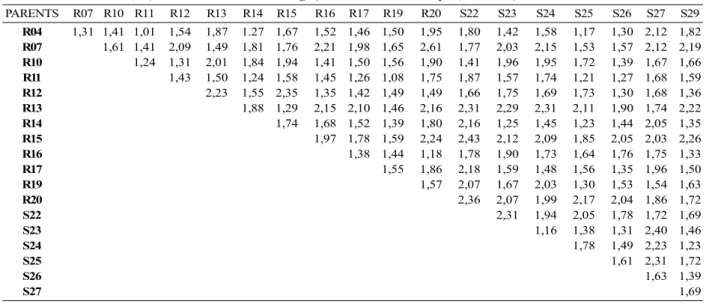
The Euclidean distance (dii), varied from 1,01 to 2,61, indicating the presence of genetic dissimilarity between parents. Among the different measures of distance between parents, it is observed that the highest dissimilarity
occurs between R07 and R20 (dii = 2,61) and the lowest between R04 and R11 (dii = 1,01) (Table 1).
The cluster analysis through Tocher’s method allowed separating the 19 parents into four dissimilar groups. Groups I and III formed four parents each, being considered similar within each group and dissimilar between groups and the others. Regarding groups II and IV, they formed, respectively, five and six parents (Table 2).
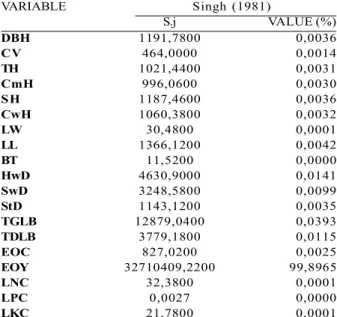
The relative contribution of characteristics for dissimilarity, according to method of Singh (1981), prioritizes the evaluation of the most important; decreasing, thus, costs and time in improvement programs for C. citriodora (Table 3).
It indicates the percentage value of contribution of each in the set of evaluations of the 19 characteristics. The highest value was obtained for essential oil yield; and the lowest was obtained by the characteristic bark width (Table 3).
The Pearson correlation, between average values of the 19 characteristics evaluated for 19 parents, varied from negative to positive values (Table 4).
4. DISCUSSION
For the different measures of distances analyzed between parents, it is observed that, since it is considered
PARENTS R07 R10 R11 R12 R13 R14 R15 R16 R17 R19 R20 S22 S23 S24 S25 S26 S27 S29
R04 1,31 1,41 1,01 1,54 1,87 1.27 1,67 1,52 1,46 1,50 1,95 1,80 1,42 1,58 1,17 1,30 2,12 1,82
R07 1,61 1,41 2,09 1,49 1,81 1,76 2,21 1,98 1,65 2,61 1,77 2,03 2,15 1,53 1,57 2,12 2,19
R10 1,24 1,31 2,01 1,84 1,94 1,41 1,50 1,56 1,90 1,41 1,96 1,95 1,72 1,39 1,67 1,66
R11 1,43 1,50 1,24 1,58 1,45 1,26 1,08 1,75 1,87 1,57 1,74 1,21 1,27 1,68 1,59
R12 2,23 1,55 2,35 1,35 1,42 1,49 1,49 1,66 1,75 1,69 1,73 1,30 1,68 1,36
R13 1,88 1,29 2,15 2,10 1,46 2,16 2,31 2,29 2,31 2,11 1,90 1,74 2,22
R14 1,74 1,68 1,52 1,39 1,80 2,16 1,25 1,45 1,23 1,44 2,05 1,35
R15 1,97 1,78 1,59 2,24 2,43 2,12 2,09 1,85 2,05 2,03 2,26
R16 1,38 1,44 1,18 1,78 1,90 1,73 1,64 1,76 1,75 1,33
R17 1,55 1,86 2,18 1,59 1,48 1,56 1,35 1,96 1,50
R19 1,57 2,07 1,67 2,03 1,30 1,53 1,54 1,63
R20 2,36 2,07 1,99 2,17 2,04 1,86 1,72
S22 2,31 1,94 2,05 1,78 1,72 1,69
S23 1,16 1,38 1,31 2,40 1,46
S24 1,78 1,49 2,23 1,23
S25 1,61 2,31 1,72
S26 1,63 1,39
S27 1,69
Table 1 – Dissimilarity measures between parents of C. citriodora regarding 19 characteristics, based on Euclidean distance
(dii) through Unweighted Pair-Group Method with Arithmetic Mean (UPGMA).
the highest dissimilarity, the cross between R07 and R20 is considered promising. The opposite is observed between R04 and R11, since it is the lowest dissimilarity existing.
The choice based on dissimilarity between the most divergent parents, as genitors for genetic cross, may promote the achievement of better progenies than the existing ones, justifying this study importance. To direct the choice of these parents, the cluster analysis through Tocher’s method allowed the formation of parents groups. Regarding group I, the four genetically similar parents represent 21,1% of total genotypes under study, indicating that the possible crosses of these parents between themselves reduce the possibility of obtainment of superior individuals. This possibility may be confirmed through progenies test, in order to identify the superiority/inferiority of these parents (genitors), based on the results of descendants.
It is also observed that there were no isolation of parents between groups; and groups I and III were the ones that clustered fewer parents. Santos et al. (2006) when evaluating the utilization of multivariate analysis techniques in the initial selection of 13 parents for cloning of Eucalyptus grandis, through characteristics as diameter at breast height (DBH), commercial height, superiority at DBH and superiority at height, verified the formation of three distinct groups;
not observing, also, any isolated genotype. The formation of these groups is essential, since the new hybrid combinations to be established must be based on the magnitude of dissimilarities and per se potential. The genotypes clustered in distant groups indicate being dissimilar, thus, being able to be considered as promising in directed crosses.
The distance of parents R11, R13, R15 and R19 from group I, regarding the others of group IV, suggests that these may promote high heterotic effect after hybridizations – which will need to be confirmed through methods such as test of progenies or diallel crosses between these genitors; and its respective evaluations of specific and general combining capacities. However, besides being dissimilar, it is necessary that genitors associate high average and variability in the characteristics under improvement.
Group Parent trees
I R11 R13 R15 R19
II R04 R07 R14 S23 S25
III R17 S24 S26 S29
IV R10 R12 R16 R20 S22 S27
Table 2 – Clustering of the 19 parent trees of C. citriodora,
in the municipality of Dueré-TO, based on characteristics DBH, CV, TH, CmH, SH, CwH, LW, LL, BT, HwD, SwD, StD, TLGB, TLDB, EOC, EOY, LNC, LPC and LKC through the average Euclidean distance and Tocher’s optimization method. Tabela 2 – Agrupamento das 19 árvores-matrizes de C. citriodora,
no município de Dueré-TO, como base nas características DAP, VC, ALT, ACm, AF, ACp, LF, CF, EC, DCn, DAlb, DCp, BFVT, BFST, TOE, ROE, TNF, TPF e TKF através da distância euclidiana média e o método de otimização de Tocher.
DBH-Diameter at breast height; CV- Crown volume; TH- Total height; CmH- Commercial height; SH- Stem height; CwH - Crown height; LW- Leaf width; LL- leaf lenght; BT - Bark thickness; HwD- Heartwood diameter; SwP - Sapwood diameter; StD- Stump diameter; TLGB - Total leaf green biomass; TLDB - Total leaf dry biomass; EOC - Essential oil content; EOY- Essential oil yield; LNC- Leaf nitrogen content; LPC- Leaf phosphorus content; LKC- Leaf potassium content.
VARIABLE Singh (1981)
S.j VALUE (%)
DBH 1191,7800 0,0036
CV 464,0000 0,0014
TH 1021,4400 0,0031
CmH 996,0600 0,0030
SH 1187,4600 0,0036
CwH 1060,3800 0,0032
LW 30,4800 0,0001
LL 1366,1200 0,0042
BT 11,5200 0,0000
HwD 4630,9000 0,0141
SwD 3248,5800 0,0099
StD 1143,1200 0,0035
TGLB 12879,0400 0,0393
TDLB 3779,1800 0,0115
EOC 827,0200 0,0025
EOY 32710409,2200 99,8965
LNC 32,3800 0,0001
LPC 0,0027 0,0000
LKC 21,7800 0,0001
Table 3 – Relative contribution of characteristics for genetic
dissimilarity based on the calculation performed with non-standard means for 19 parents of C. citriodora.
Tabela 3 – Contribuição relativa das características para dissimilaridade genética com base no cálculo feito com médias não padronizadas para 19 matrizes de C. citriodora.
Regarding the identification of characteristics that most contributed for genetic dissimilarity, it is verified through method of Singh (1981) that essential oil yield presented the highest contribution, with 99,9% for the 19 parents assessed; while the others had little contribution (<0,05%). These results show - for an improvement program aiming the selection of parents of C. citriodora, intended to the production of wood and essential oil – that EOY, TLGB and HwD must be prioritized for the choice of genitors.
Estimates of Pearson correlation coefficients between the characteristics studied presented significance among several of them, verifying the existence of resemblances between the distributions of variables scores - with the possibility for selection of superior parents, indirectly, through these characteristics, highlighting the importance of the individual evaluation of features.
According to Cohen (1988), values between 0,10 and 0,29 can be considered small; scores between 0,30 and 0,49 can be considered as medium; and values between 0,50 and 1 as large. In this sense, it was observed that the negative value of linear correlation coefficient, considered large, was obtained through the existing correlation between the following characteristics: LW x EOY; LW x EOC; LW x LNC; BT x EOC; BT x EOC; SH x CwH; with values of, respectively: -0,70; -0,65; -0,63; -0,60; -0,56; and -0,55; significant at 1% or 5% probability through t-test. The negative correlations considered as medium were obtained between the following characteristics: LW X LKC and SwD x EOC, both with values of -0,47, significant, respectively, at 1% and 5% by t-test. The only significant correlation considered small was obtained between characteristics DBH x LPC, with value of -0,10 at 5% probability by t-test.
DBH CV TH CmH SH CwH LW LL BT HwD SwD StD TGLB TDLB EOC EOY LNC LPC LKC
DBH 1
CV 0,19 1
TH 0,27 -0,25 1
CmH 0,24 -0,28 0,93** 1
SH 0,31 -0,31 0,52* 0,60** 1
CwH -0,06 0,08 0,43 0,27 -0,55* 1
LW -0,07 0,10 0,12 0,06 0,30 -0,20 1
LL -0,21 -0,10 0,08 0,07 0,17 -0,10 0,44 1
BT 0,30 0,18 -0,09 -0,04 0,20 -0,30 0,37 -0,02 1
HwD 0,38 -0,12 0,43 0,41 0,50 -0,11 0,02 -0,19 -0,01 1
SwD 0,51* 0,37 0,18 0,28 0,42* -0,26 0,14 0,14 0,44 0,39 1
StD 0,50* 0,23 0,26 0,22 0,08 0,18 -0,24 0,26 -0,03 0,27 0,47* 1
TGLB 0,32 0,60* -0,10 -0,26 -0,28 0,20 -0,13 0,07 -0,08 -0,17 0,27 0,40 1
TDLB 0,23 0,53* -0,09 -0,26 -0,28 0,21 -0,12 0,13 -0,11 -0,22 0,18 0,35 0,98** 1
EOC -0,21 -0,41 -0,02 0,08 -0,18 0,17 -0,65** -0,29 -0,56* 0,06 -0,47* -0,16 -0,25 -0,24 1
EOY -0,10 -0,06 -0,22 -0,24 -0,44 0,26 -0,70** -0,27 -0,60** -0,07 -0,36 0,02 0,35 0,35 0,79** 1
LNC 0,12 -0,07 0,21 0,18 0,12 0,07 -0,63** -0,01 -0,22 0,29 0,13 0,44 0,11 0,11 0,30 0,30 1
LPC -0,10* 0,01 -0,14 -0,13 -0,11 -0,02 -0,26 -0,22 0,18 0,24 0,02 0,02 -0,30 -0,35 0,10 -0,07 0,45 1
LKC 0,46 0,13 -0,05 -0,02 -0,03 -0,01 -0,47** -0,09 0,01 0,06 0,29 0,51* 0,42 0,34 0,12 0,35 0,35 0,10 1
Table 4 - Pearson correlation values among the 19 characteristics evaluated in 19 parents of C. citriodora, resulting on
the following characteristics: DBH-Diameter at breast height; CV- Crown volume; TH- Total height; CmH- Commercial height; SH- Stem height; CwH - Crown height; LW- Leaf width; LL- Leaf lenght; BT - Bark thickness; HwD-Heartwood diameter; SwP - Sapwood diameter; StD- Stump diameter; TLGB – Total leaf green biomass; TLDB - Total leaf dry biomass; EOC - Essential oil content; EOY- Essential oil yield; LNC- Leaf nitrogen content; LPC- Leaf phosphorus content; LKC- Leaf potassium content.
Tabela 4 - Valores de correlações de Pearson entre 19 caracteres avaliados em 19 matrizes de C. citriodora tendo como características, DAP-Diâmetro à Altura do Peito; VC- Volume de Copa; ALT- Altura Total; ACm- Altura Comercial; AF-Altura do Fuste; ACp- Altura da Copa; LF- Largura da Folha; CF- Comprimento da Folha; EC- Espessura da Casca; DCn- Diâmetro do Cerne; DAlb- Diâmetro do Alburno; DCp- Diâmetro da Cepa; BFVT- Biomassa Foliar Verde Total; BFST- Biomassa Foliar Seca Total; TOE- Teor de Óleo Essencial; ROE- Rendimento de Óleo Essencial; TNF- Teor de Nitrogênio Foliar; TPF- Teor de Fósforo Foliar; TKF- Teor de Potássio Foliar.
**; * Significant values at 1% and at 5% probability, respectively, through t-test.
Thereby, the increase in LW implies in decrease of EOY, EOC, LNC and LKF, and vice versa; also the increase in BT implies in decrease of EOY, EOC and CwH, and vice versa; and the increase in DBH implies in small decrease of LPC or vice versa.
The positive correlations considered as large were obtained between characteristics: TLGB X TLDB; TH x CmH; EOC x EOY; CmH x SH; CV x TLGB; CV X TLDB; TH x SH; DBH x SwD; StD x LKC; and DBH x StD; with values of, respectively: 0,98; 0,93; 0,79; 0,60; 0,60; 0,53; 0,52; 0,51; 0,51; and 0,50, significant at 1% or 5% probability by t-test. The positive correlations considered as medium were obtained between characteristics: SwD x StD and SH x SwD, with respective values of 0,47 and 0,42 at 5% probability by t-test. There was no significant value regarding small correlation for the other values.
Thus, increase in CV implies in increase of TLDB and TLGB, and vice versa; increase in SH implies in increase of CmH, TH and SwD and vice versa. Analogously, increase in DBH implies in increase of SwD and StD or vice versa; and, also, increase in StD promotes increase in LKC and SwD or vice versa; besides, the increase in TH and EOC imply, respectively, in increase of CmH and EOY.
Therefore, the positive and negative correlations obtained between the characteristics group, reveal that, for C. citriodora, trees with lower values for LW, BT and higher values for CV and EOC must be selected, in order to increase essential oil productivity. Regarding wood productivity, trees with higher values for TH, DBH and LKC must be chosen.
The degree of linear association of a characteristic in function of others allows the reduction of the number of assessed variables, costs and time, besides directing the evaluation of characteristics according to the objective of the genetic improvement program for the selection of genotypes.
For the selection of parents in forest improvement programs aiming to formation of genitors for this type of study, it must be taken into consideration not only the estimated genetic dissimilarities between individuals but also their average values for the silvicultural characteristics assessed.
5. CONCLUSION
The characteristics essential oil yield, total leaf green biomass and heartwood diameter contribute with
higher weight for genetic dissimilarity between parent trees.
The parents R07 and R20 are the most dissimilar; and R04 and R11 are the least dissimilar.
For wood production, it must be prioritized the selection of trees with lower values in crown height and sapwood diameter; and trees with higher values in total height, commercial height, diameter at breast height and stump diameter.
For essential oil production, it must be prioritized the selection of trees with lower values in leaf width, bark thickness and sapwood diameter; and trees with higher values in leaf nitrogen content, leaf potassium content, total green and total dry biomass, essential oil yield and crown volume.
6. ACKNOWLEDGEMENT
To the company JAMP Florestal for the experiment conduction and concession of results for publication.
7. REFERENCES
Andrade AM, Gomes SS. Influência de alguns fatores não genéticos sobre o teor de óleo essencial em folhas de Eucalyptus citriodora Hook. Floresta Ambient. 2000;7(1):181-9.
Boland DJ, Brophy JJ, House APN. Eucalyptus leaf oils: use, chemistry, destillation and marketing. Melbourne: Inkata Press; 1991. p. 11-28.
Caixeta RP, Trugilho PF, Rosado SCS, Lima JT. Propriedades e classificação da madeira aplicadas à seleção de genótipos de Eucalyptus. Rev Arvore. 2003;27(1):43-51. http://dx.doi.org/10.1590/ S0100-67622003000100006.
Cohen J. Statistical power analysis for the behavioral sciences. Hillsdale: Erlbaum; 1988.
Cruz CD. Programa Genes: diversidade genética. Viçosa: Editora UFV; 2008. 278 p.
Cruz CD, Regazzi AJ. Modelos biométricos aplicados ao melhoramento genético. 2. ed. Viçosa: Editora UFV; 2001. 390 p.
1992;32(2):301-4. http://dx.doi.org/10.2135/
cropsci1992.0011183X003200020002x.
Empresa Brasileira de Pesquisa Agropecuária. Centro Nacional de Pesquisa de Solos. Sistema brasileiro de classificação de solos. Rio de Janeiro: EMBRAPA; 2006. 306 p.
Kageyama PY, Gandara FB. Recuperação de áreas ciliares. In: Rodrigues RR, Leitão HF Fo. Matas ciliares: conservação e recuperação. São Paulo: EDUSP; 2000. p. 249-269.
Moraes CB, Carvalho EV, Zimback L, Luz OSL, Pieroni GB, Mori ES, et al. Variabilidade genética em progênies de meios-irmãos de eucaliptos para tolerância ao frio. Rev Arvore. 2015;39(6):1047-54. http://dx.doi.org/10.1590/0100-67622015000600007.
Mori ES. Genética de populações arbóreas: orientações básicas para seleção e marcação de matrizes. Rev. Inst. Florest. 2003;25:35-44.
Pryor LD, Johnson LAS. A classification of the Eucalypts. Canberra: ANU; 1971. 112 p.
Rao CR. Advanced statistical methods in biometric research. New York: John Wiley; 1952. 390 p.
Reis CAF, Assis TF, Santos AM, Paludzyszyn-Filho E. Corymbia citriodora: estado da arte de
pesquisas no Brasil. Colombo: Embrapa Florestas; 2013.
Santos GA, Xavier A, Leite HG. Desempenho silvicultural de clones de Eucalyptus grandis em relação às árvores matrizes. Rev Arvore.
2006;30(5):737-47. http://dx.doi.org/10.1590/S0100-67622006000500007.
Sebbenn AM. Tamanho amostral para conservação ex situ de espécies arbóreas com sistema misto de reprodução. Rev. Inst. Florest. 2003;15(2):147-62.
Singh D. The relative importance of characters affecting genetic divergence. Indian J. Genet. Plant Breed. 1981;41:237-45.
Tedesco MJ, Gianello C, Bissani CA, Bohnen H, Volkweiss SJ. Análise de solo, plantas e outros materiais. Porto Alegre: UFRGS, Departamento de Solos; 1995. 174 p. (Boletim Técnico; no. 5).
Vasconcelos ES, Cruz CD, Bhering LL, Resende-Junior MFR. Método alternativo para análise de agrupamento. Pesqui Agropecu Bras.
2007;42(10):1421-8. http://dx.doi.org/10.1590/S0100-204X2007001000008.
Vitti AMS, Brito OJ. Avaliação do rendimento e do teor de citronelal do óleo essencial de