Rev. Caatinga
DRY FOREST DEFORESTATION DYNAMICS IN BRAZIL’S PONTAL BASIN
1RODRIGO DE QUEIROGA MIRANDA2, JOSICLÊDA DOMICIANO GALVÍNCIO2*, YGOR CRISTIANO BRITO
MORAIS2, MAGNA SOELMA BESERRA DE MOURA3, CHARLES ALLAN JONES4, RAGHAVAN SRINIVASAN4
ABSTRACT - Reliable information on vegetation cover and its dynamics over time is essential for managing life, resources, and supporting policies. Although many related initiatives have been undertaken in Brazil since the 1980s, knowledge about its dry forests is still limited. In this study, we address the drivers of deforestation and their threat to the Brazilian dry forest called Caatinga. We evaluated the land cover dynamics and landscape metrics in the watershed of the Pontal River, as it has become one of the most socially and environmentally important areas in Brazil. The overall process consists of a systematic sampling grid of hydrological samples, where Landsat images (1975 to 2013) combined with the FRAGSTATS package were used to evaluate landscape metrics indices for the Caatinga. Data showed that the relative area (RA) decreased from 90.25% to 60.98% over the 38-year period, while fragmentation (PD) presented an increasing bias. In addition, the spatial distribution of both indices became more heterogeneous and clustered in the north. We suggest that appropriateness of land for farming was the leading cause of deforestation; rainfall is 112% more intense in the north of the watershed than in the south. Therefore, the northern fauna and flora have been significantly altered and reduced. The relationship between deforestation and time shows an increasing threat. Further studies evaluating these causes are needed to improve our understanding of the vegetation dynamics in this region.
Keywords: Caatinga. Fragmentation. Landscape. Semiarid. Remote Sensing.
DINÂMICA DO DESMATAMENTO DE FLORESTA SECA NA BACIA DO PONTAL NO BRASIL
RESUMO - Informações confiáveis sobre a cobertura vegetal e sua dinâmica ao longo do tempo são essenciais para a gestão de vidas, recursos, e apoio a políticas. Embora muitas iniciativas tenham sido realizadas no Brasil desde a década de 1980, o conhecimento sobre suas florestas secas ainda é limitado. Neste estudo, abordamos os moduladores do desmatamento e sua ameaça à floresta seca brasileira chamada Caatinga. Avaliamos a dinâmica da cobertura da terra e métricas de paisagem na bacia do rio Pontal, a qual se tornou uma das áreas mais socialmente e ambientalmente importantes do Brasil. O processo em geral consiste em uma amostragem sistemática baseada em características hidrológicas, onde imagens Landsat (1975 a 2013) combinadas com o software FRAGSTATS foram utilizadas para avaliar índices de métricas de paisagem para a Caatinga. Os dados mostraram que a área relativa (RA) diminuiu de 90,25% para 60,98% ao longo do período de 38 anos, enquanto que a fragmentação (PD) apresentou uma tendência crescente. Além disso, a distribuição espacial de ambos os índices se tornou mais heterogênea e agrupada ao norte. Sugerimos que a aptidão da terra para a agricultura foi a principal causa do desmatamento. A chuva é 112% mais intensa no norte da bacia do que no sul. Portanto a fauna e flora ao norte foram significativamente alteradas e reduzidas. A relação entre desmatamento e tempo mostrou uma ameaça crescente. Outros estudos que avaliem essas causas são necessários para melhorar a compreensão da dinâmica da vegetação nesta região.
Palavras-chave: Caatinga. Fragmentação. Paisagem. Semiárido. Sensoriamento Remoto.
___________________________ *Corresponding author
1Received for publication in 09/29/2016; accepted in 05/09/2017. Paper extracted from the doctoral thesis of the first author.
2Postgraduate Program in Development and Environment, Universidade Federal de Pernambuco, Recife, PE, Brazil; [email protected], [email protected], [email protected].
3EMBRAPA Tropical Semi-Árido, Petrolina, PE, Brazil; [email protected].
Rev. Caatinga
INTRODUCTION
Reliable information on vegetation cover and its dynamics over time is essential for managing life and resources, and devising supporting policies at various levels. However, such information is not homogeneously distributed across the biomes of the planet. Rainforests have been widely studied while dry tropical forests (DTFs) receive less attention (PORTILLO-QUINTERO; SÁNCHEZ-AZOFEIFA, 2010); therefore, data on these ecosystems is often scarce, inconsistent, and limited even though 42% of all forests in tropical regions are classified as seasonally dry (BULLOCK; MOONEY; MEDINA, 1995).
Northeast Brazil makes up 18% of the country, and 75% of its land surface is covered by semiarid regions (LIMA; BARBOSA; BARBOSA, 2009). The predominant ecosystem in these regions is a dry forest called Caatinga. With an area of 735,000 km2, it is recognized as the “Earth’s
last wild place” and is considered as one of
the 37 “Wilderness Areas of the
World” (ALBUQUERQUE et al., 2012). It contains around 187 species of bees, 240 species of fish, 167 species of reptiles and amphibians, 516 species of birds, and 148 mammal species, with endemism levels varying from 9% in birds to 57% in fishes (LEAL; TABARELLI; SILVA, 2003). Moreover, it contains over 1,000 vascular plant species distributed as a mosaic of seasonally dry tropical forests (SDTFs) and shrub vegetation. However, such biodiversity contrasts with high levels of degradation, placing the Caatinga among the most endangered ecosystems on Earth, given its high rates of land conversion. Currently, the converted area in the region exceeds 60% of its original area (MENEZES et al., 2012).
Since the 1980s, monitoring these changes has been given priority, with many initiatives such as the programs PRODES (Monitoring Brazilian Amazon Forest by Satellite), DETER (Detecting Deforestation in Real Time), PROBIO (Projeto de Conservação e Utilização Sustentável da Diversidade Biológica), and more recently, PMDBBS (Projeto Monitoramento do Desmatamento dos Biomas Brasileiros por Satélite). However, the present perception of land cover changes in the Caatinga is still limited because most studies have assessed such changes using medium-resolution satellite imagery (~1 km) alone. Only a few have used Landsat imagery (~30 m), which lacks precise vegetation information data prior to 2002. Moreover, most
studies have analyzed the entire Caatinga, losing geographic details on the changes induced by projects that enhance local economic productivity by promoting agricultural and livestock practices. These practices often end up increasing natural forest fragmentation over time. Therefore, in this study, we evaluated the land cover dynamics and landscape metrics in the watershed of the Pontal River. In recent years, this area has become one of the most important sub-basins in northeast Brazil, playing a significant social, environmental, and commercial role in the state of Pernambuco, especially in terms of agricultural production. We conclude that the rapid and aggressive land cover conversion is creating hotspots of degradation and will negatively affect local ecology and geography.
MATERIAL AND METHODS
Study area
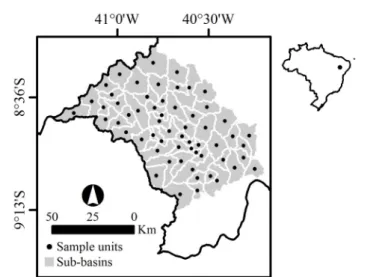
The Pontal River watershed is located in western Pernambuco, Brazil, between the coordinates 08º 19' 00' S, 40° 11' 42' W and 09º 13' 24' S, 41º 20' 39" W. It occupies an area of 6,057 km2, 6.12% of the state (Figure 1). The
drainage area includes four municipalities, but only the municipality of Afrânio is fully enclosed in the watershed. Its water spring is also located in Pernambuco, between the borders of Piauí and Bahia. The climate in the area is semiarid, with a mean annual temperature of 27ºC; rainfall is irregular and concentrated within 2-3 months of the year, with the possibility of heavy rainfall (120-130 mm) over a period of 24 h. The predominant vegetation is the Caatinga, but a rapid expansion in irrigated agriculture of grape, mango, and guava has been observed, which is seriously threatening many native forest areas.
Surface properties and sampling design
In order to spatially characterize the Pontal watershed, elevation data from Aster
GDEM raster (30 × 30 m) were downloaded at http://earthexplorer.usgs.gov/; soil classification data
Rev. Caatinga
The overall process was developed as part of the System of Hydrologic Response Units for the Pernambuco (SUPer) Project implemented by University Federal of Pernambuco (UFPE) in association with Texas A&M University (TAMU). The project consists of a systematic sampling grid for samples in every watershed in Pernambuco, covering the entire state. Each sample unit has an area of approximately 108 m2 (Figure 1) defined
using soil classifications; the delineation of each sample unit reflects the spatial distribution of soil in the watershed. The sample units were made using the ArcSWAT extension for the ArcGIS package (ESRI, 2011). For each sample unit, we produced 8 land
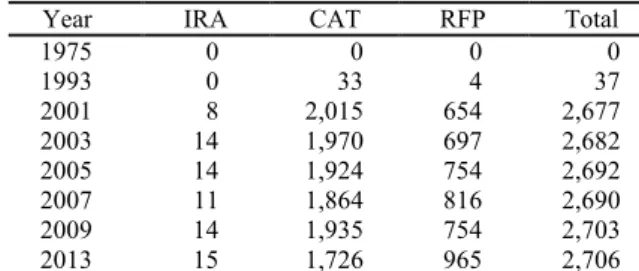
cover maps from 42 cloud-free images from all sensors of the Landsat series. Each map is from a different period (Table 1) and is composed by a set of scenes with a maximum average distance to each target period of 12 months. All images were selected from the Landsat archives of the United States Geological Survey (USGS) and Brazilian National Space Research Institute (INPE) based on
radiometric quality and absence of cloud cover (< 10%). Each image underwent extensive pre-processing, including verification of image geolocation, conversion to at-surface reflectance, and merging.
Figure 1. Location of the study area, the Pontal watershed in Brazil. The sample sites and sub-basins are also noted.
Sensor/Satellite Date of image Sensor/Satellite Date of image
MSS/Landsat 1 07/28/1975 MSS/Landsat 1 08/16/1975
MSS/Landsat 1 11/13/1975 TM/Landsat 5 10/18/1992
TM/Landsat 5 08/24/1992 TM/Landsat 5 05/14/1993
TM/Landsat 5 08/11/1993 TM/Landsat 5 09/09/1993
TM/Landsat 5 12/17/1993 ETM/Landsat 7 08/27/1999
TM/Landsat 5 06/25/1999 TM/Landsat 5 09/04/1999
TM/Landsat 5 12/04/2000 TM/Landsat 5 09/22/2000
TM/Landsat 5 10/04/2001 TM/Landsat 5 09/25/2001
ETM/Landsat 7 01/03/2003 ETM/Landsat 7 10/03/2001
TM/Landsat 5 07/06/2003 ETM/Landsat 7 07/18/2002
TM/Landsat 5 11/13/2004 ETM/Landsat 7 10/22/2002
TM/Landsat 5 10/12/2004 TM/Landsat 5 06/27/2003
TM/Landsat 5 10/15/2005 TM/Landsat 5 06/13/2004
TM/Landsat 5 07/30/2006 TM/Landsat 5 08/16/2004
TM/Landsat 5 01/22/2007 TM/Landsat 5 12/06/2004
TM/Landsat 5 09/24/2009 TM/Landsat 5 01/07/2005
OLI/Landsat 8 09/03/2013 TM/Landsat 5 07/18/2005
OLI/Landsat 8 05/10/2013 TM/Landsat 5 09/04/2005
TM/Landsat 5 11/07/2005
TM/Landsat 5 01/26/2006
TM/Landsat 5 07/24/2007
TM/Landsat 5 09/26/2007
TM/Landsat 5 08/27/2008
OLI/Landsat 8 09/26/2013
Rev. Caatinga
Image preprocessing and classification
For multi-temporal analysis, particularly when comparing images from different sensors (such as in the present study; Table 1), not only a good geometric match between images is essential, but also the use of high-quality at-surface reflectance products, instead of at-sensor spectral radiances, is necessary. This is because at-surface reflectance products have no negative effects from different solar zenith angles or variation in the Earth–Sun distance due to the time difference between acquisition dates. In addition, they are normalized for the exoatmospheric solar irradiance arising from each spectral band, and all atmospheric effects (CHANDER; MARKHAM; HELDER, 2009). This is important because these variations may spatially and temporally degrade the data quality.
In this context, the registration and orthorectification of all the images had to be enhanced. We used the well-established Automated Registration and Orthorectification Package (MASEK, 2009) distributed by the USGS to orthorectify TM Landsat images from the Global Land Survey (GLS) archives that provide the best radiometric, geometric quality, and cloud cover (GUTMAN et al., 2013). The images were georeferenced to the Universal Transverse Mercator projection system and the World Geodetic System (WGS84; RMSE < 0.25 pixels). Moreover, the variability in scene-to-scene was drastically reduced by converting the calibrated digital numbers (Qcal)
from level 1 images to at-surface reflectance (ρp),
following the methods used by Chander, Markham and Helder (2009), and using the Geospatial Data Abstraction Library (GDAL). All required rescaling factors were found in the metadata for each image. To correct for atmospheric effects on all images, we used the module i.atcorr in the software GRASS to
perform the 6S algorithm (Second Simulation of the Satellite Signal in the Solar Spectrum) (NETELER et al., 2012), which is a radiative transfer model that works in a manner similar to corrections in the Moderate Resolution Imaging Spectroradiometer (MODIS) imagery. Finally, to create high-quality mosaic data, pixel-by-pixel compositions were created using the weighted average of each pixel; the weights were based on the distances from the center of each image.
Reference data for classifier training and accuracy assessment were collected through human
interpretation of high-resolution imagery in Google Earth (http://earth.google.com) using
interpretation criteria. Three thousand sample points were created using the function arcpy.CreateRandomPoints_management() available in ArcGIS, and all samples without QuickBird imagery (resolution = 2.4 to 2.8 m2) were removed
(Table 2). Next, using these points, we created spectral signatures for each image and classified all images, which resulted in three classes: irrigated areas, Caatinga, and rainfed pastures or agriculture (Table 3). We could not acquire any valid sample points for 1975; thus, an average spectral signature was created using all applicable bands from other years. All the maps were converted to shapefile format and completely topo-error corrected using the v.clean tool installed in the software GRASS GIS (NETELER et al., 2012). To avoid “pepper and salt” polygons, all areas less than 100,000 m2 were
merged with the nearest polygon of equal class. Owing to the lack of field data for our study, we opted for a consistency assessment based on the assumption that using over 15,000 assessments covering the 9 periods would be enough to guarantee the consistency for all maps. The advantages of this methodology have been fully explained by Redo, Aide and Clark (2013).
Table 2. The number of valid samples used for classifier training and accuracy assessment in the Pontal watershed, Pernambuco, Brazil. IRA = Irrigated agriculture, RFP = Rainfed pastures or agriculture, and CAT = Caatinga.
Year IRA CAT RFP Total
1975 0 0 0 0 1993 0 33 4 37 2001 8 2,015 654 2,677 2003 14 1,970 697 2,682 2005 14 1,924 754 2,692 2007 11 1,864 816 2,690 2009 14 1,935 754 2,703 2013 15 1,726 965 2,706
Landscape and statistical analysis
For studying Caatinga, calculations of the following landscape metrics/indexes were performed using the FRAGSTATS package (MCGARIGAL; MARKS, 1995): (Eq. 1)
A
A
t c RA (Eq. 2) where RA, PD, and Ac are the relative area, patch density, or fragmentation, and area of each class, respectively; At is the total area of all classes; and Nc is the number of fragments per class. More information on the statistical functions in FRAGSTATS can be found in Zaragozí et al. (2012).Rev. Caatinga
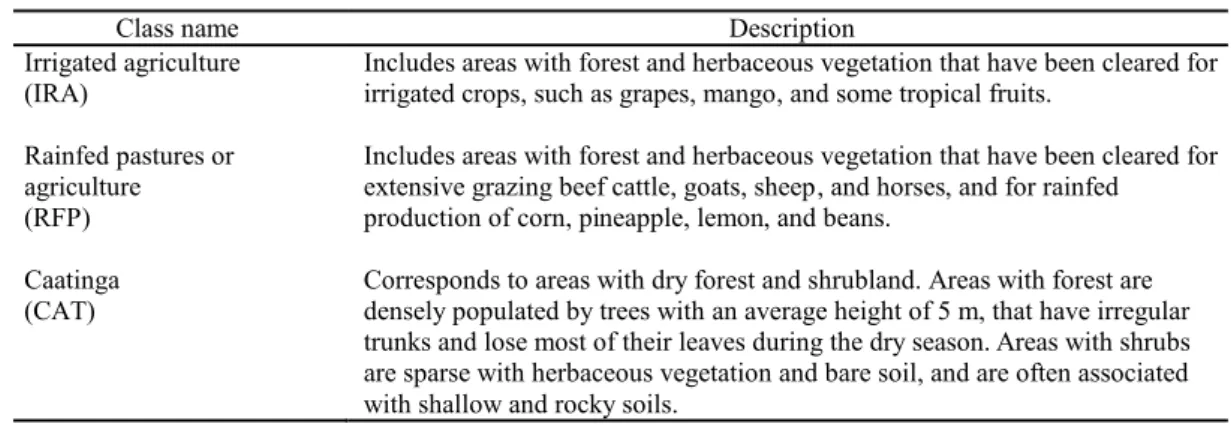
Table 3. Description of each land use class evaluated in the Pontal watershed.
Class name Description
Irrigated agriculture (IRA)
Includes areas with forest and herbaceous vegetation that have been cleared for irrigated crops, such as grapes, mango, and some tropical fruits.
Rainfed pastures or agriculture (RFP)
Includes areas with forest and herbaceous vegetation that have been cleared for extensive grazing beef cattle, goats, sheep, and horses, and for rainfed production of corn, pineapple, lemon, and beans.
Caatinga (CAT)
Corresponds to areas with dry forest and shrubland. Areas with forest are densely populated by trees with an average height of 5 m, that have irregular trunks and lose most of their leaves during the dry season. Areas with shrubs are sparse with herbaceous vegetation and bare soil, and are often associated with shallow and rocky soils.
To identify patterns between RA and time, we used the non-linear regression model tool in the package R (FOX, 2005). To evaluate the intensity at which RA and PD changed over an interval of two years, we used Eq. 3 (see below). However, some intervals were greater than two years; for these, we used Eq. 4 to estimate the changes per year.
(Eq. 3)
(Eq. 4)
where CP,Vp, and Vp-1, respectively, are the absolute change in a given parameter P, the value P from a given period p, and the value P from the previous period p; and NY is the number of years in a period interval. To statistically test the spatial distribution of RA and PD over the area, we used the arcpy.SpatialAutocorrelation_stats() tool available in the ArcGIS suite. It basically evaluates the spatial pattern expressed from a given parameter as clustered, dispersed, or random. The results from all analyses were considered significant when p ≤ 0.05.
RESULTS AND DISCUSSION
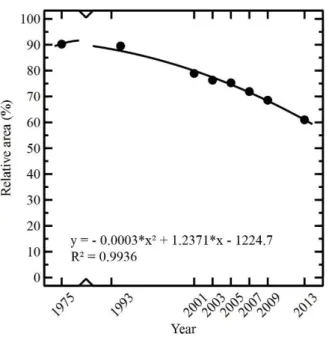
We established 59 sample units covering the entire Pontal watershed. These sampling units, extracted using ArcSWAT, allow us to recognize spatial arrangements of soils, which may favor the identification of homogeneous areas, and offer support to make inferences about the size of sample units. Tropical dry forests are among the most threatened ecosystems in the world as a consequence of intensive anthropogenic disturbance (FOLEY et al., 2005; SANTOS et al., 2011). Through the period 1975-2013, the Caatinga’s RA in the Pontal watershed showed substantial depletion (from 90.25% to 60.98% in a polynomial pattern;
V
V
C
P p p1100 1 1 1
V
V
C
p p NY PFigure 2). Conversions of natural forests progressed first as rainfed pastures or agriculture, followed by irrigated agriculture. The same process occurred in many other areas in Pernambuco. In the municipality of Belém de São Francisco, rainfed areas were increasingly promoted through government rural development programs; this was the main reason for the deforestation of the Caatinga in the area (ASSIS et al., 2014). In the municipality of Santa Maria da Boa Vista, the main drive for land transformation was the aggressive expansion of urban areas (TAURA et al., 2010). In total, the gross loss of Caatinga between 1990 and 2010 was 25,335 km2
with an annual rate of change of -0.44% yr-1 (BEUCHLE et al., 2015). Most of these areas were converted into agriculture and livestock areas (COELHO et al., 2014). Using Landsat Thematic Mapper TM data from the years 1999, 2000, and 2001 (162 satellite images), Vieira et al. (2013) showed that farming areas occupied 55% of Pernambuco.
The pressure for converting natural areas is strong but varies according to environmental conditions (MAYAUX et al., 2005). The pressure in favor of land use conversion does not always increase; sometimes it will slow down or even stop. For certain periods, the weather or economic characteristics might not be favorable for rural practices, leading to changes in all the land use dynamics in a given area. These mechanisms are not new; Beuchle et al. (2015) pointed out the importance of estimating and discussing them as they are significant in most regions but are nevertheless hard to evaluate. In addition, Mayaux et al. (2005) showed that during these periods,
secondary forests can be established through re-growth on abandoned land and forest plantations,
Rev. Caatinga
Figure 2. Relationship between time and relative area of Caatinga over 48 years in the Pontal watershed.
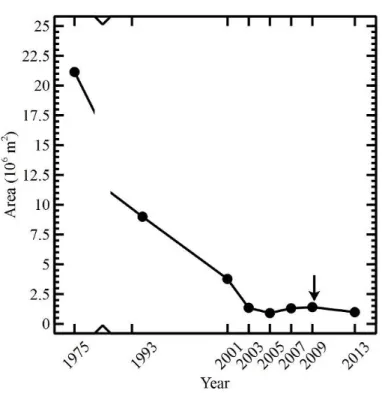
One of the principal consequences of deforestation is the creation of landscapes occupied by forest fragments that are remnants of the original continuous forest cover (PORTILLO-QUINTERO; SÁNCHEZ-AZOFEIFA, 2010). These fragments are usually embedded in matrices of transformed habitats. Currently, the remains of the natural ecosystem in the Pontal are highly fragmented. Patch density or fragmentation (PD) indicated an increasing bias, with a peak in PD during the 2007-2009 period, which was also the beginning of a declining period for that variable (Table 4). Therefore, the fauna and flora have been significantly altered and reduced. Ecologically, the distributions of these fragments in space and time may affect their microclimates, spatial distribution, and composition of species, species interactions, community trophic structure, and movement of individuals between fragments. Thus, large fragments capture the majority of species and processes vital for maintaining ecosystem functions, while smaller fragments usually have less species diversity, especially when the fragments are old, because resources have become scarce and difficult
to find over time. In fact, these fragments have a
high probability of being converted to other land cover (PORTILLO-QUINTERO; SÁNCHEZ
-AZOFEIFA, 2010). In the Pontal watershed, the mean area of the fragments varied over time, from 21.13 × 10⁶ m2 in 1975 to 0.98 × 10⁶ m2 in 2013.
There is a general negative bias, with the exception of the 2007-2009 period when values increased around 50% from 2005 (Figure 3). This suggests that some very small patches were converted, increasing the mean area of fragments. From the social point of view, the Caatinga has consistently received the lowest social investment. Political leaders and governments have not yet focused on the potential relation between biodiversity and poverty. As the Caatinga gets degraded, the air and surface temperature, evapotranspiration, and geochemical cycle change; stored water and nutrients in the soil get depleted, making it harder to plant anything near the Caatinga. These contributions from biodiversity to livelihoods through maintenance of productive land and ecosystems have also been described by Roe et al. (2014).
Table 4. Periodic mean variations and ratios, in percentage, of relative area and patch density in Caatinga for all samples from the Pontal watershed.
Period NY* NI* Relative area (RA) Patch density (PD) Ratio RA:PD
1975-1993 18 9 -0.54 (-0.03 per yr) 16.83 (0.87 per yr) 0.03
1993-2001 8 11 -11.64 (-1.53 per yr) 106.24 (9.47 per yr) 0.16
2001-2003 2 10 -1.06 5.42 0.20
2003-2005 2 16 -0.79 6.39 0.12
2005-2007 2 16 -2.36 6.32 0.37
2007-2009 2 7 -2.43 10.46 0.23
2009-2013 4 5 -10.68 (-2.79 per yr) 22.29 (5.16 per yr) 0.54
Rev. Caatinga
Figure 3. Mean area of fragments in Caatinga over 48 years in the Pontal watershed, west Pernambuco, Brazil; the arrow marks the beginning of a period of increasing values.
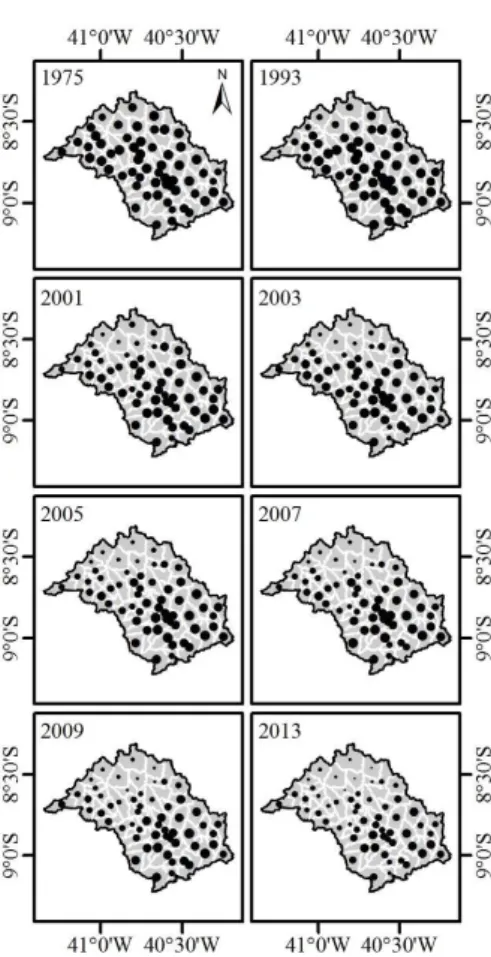
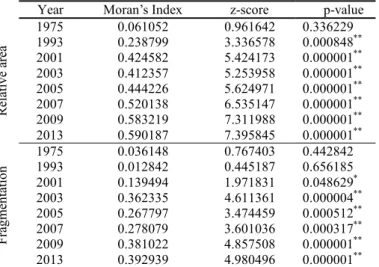
Historically, it is difficult to evaluate the distribution of natural ecosystems and fauna loss in Brazil over the last 500 years. The deforestation process has been active in the region since the 1500s, and historical records are few and far between (COIMBRA-FILHO; CÂMARA, 1996). In our study, the spatial distribution of both RA and PD
became more heterogeneous and clustered in the north of the watershed (Figures 4 and 5). However, in 1975, both variables showed a random distribution (Table 5). We only observed clustered distributions after 1993 and 2001 for relatively small areas and high fragmentation spots, respectively, and only in 2007 did the south start to show increased degradation. We suggest that a possible leading cause is likely the appropriateness of land for agriculture, which can be attributed to an isolated distribution or a combination of optimal soil, terrain slope, and water availability in the north. The maps indicate that elevation (z) is higher in the north of the watershed than in the south (a difference of 414 m; Figure 6), but only a single slope class is dominant and well distributed in the watershed, showing no specific spatial pattern. The terrain is predominately undulating (82.37% of the watershed), but we also
Rev. Caatinga
Figure 4. Spatial changes in relative area of the Caatinga over 48 years in the Pontal watershed, west Pernambuco, Brazil. 98% ( ), 50% ( ), and 17% ( ) of the Caatinga at the scale 1:4,250 (1 cm = 42.5 km).
Rev. Caatinga
Table 5. Spatial autocorrelation (Moran’s I) of relative area and patch density in the Caatinga in the Pontal watershed.
Year Moran’s Index z-score p-value
Re
lativ
e
are
a
1975 0.061052 0.961642 0.336229
1993 0.238799 3.336578 0.000848**
2001 0.424582 5.424173 0.000001**
2003 0.412357 5.253958 0.000001**
2005 0.444226 5.624971 0.000001**
2007 0.520138 6.535147 0.000001**
2009 0.583219 7.311988 0.000001**
2013 0.590187 7.395845 0.000001**
F
ra
g
m
en
tatio
n
1975 0.036148 0.767403 0.442842
1993 0.012842 0.445187 0.656185
2001 0.139494 1.971831 0.048629*
2003 0.362335 4.611361 0.000004**
2005 0.267797 3.474459 0.000512**
2007 0.278079 3.601036 0.000317**
2009 0.381022 4.857508 0.000001**
2013 0.392939 4.980496 0.000001**
p-value statistically significant at 0.05 (*) and 0.01 (**).
Figure 6. Spatial characterization of the Pontal watershed.
CONCLUSION
In summary, the relationship between deforestation and time shows an increasing threat of land use conversion against the Caatinga. The leading causes of this change in spatial pattern are still unclear, but we hypothesize that the rainfall pattern could be enhancing land quality for farming in the north, and also making the Caatinga more susceptible to land cover conversion. Perhaps those who tried and did not succeed in farming passed this knowledge down through generations: the northern areas were more suitable for farming. Further studies are needed to evaluate the causes for land conversion and the vegetation dynamics in the Caatinga. Deforestation is was very aggressive, showing a loss of 30% of vegetation cover over the 38-year period,
as well as occupation in the area through the conversion of natural forests, primarily into rainfed
pastures or agriculture, followed by irrigated agriculture. The same process has occurred in many other semiarid regions in Pernambuco, Brazil. The relationship between deforestation and time shows an increasing threat to the natural environment.
The results of this work provide an important contribution to planning the water resource management policy in the Pontal basin, an especially vital resource in this semiarid region of Brazil.
ACKNOWLEDGEMENTS
We thank CAPES (Coordenação de
Aperfeiçoamento de Pessoal de Nível Superior - Brazilian Coordination for the
Rev. Caatinga
this study through the projects PVE A103/2013 and APQ 0646-9.25/16 respectively. The text benefited from constructive comments from Sarah, Dan, and anonymous reviewers for their editorial assistance.
REFERENCES
ALBUQUERQUE, U. P. et al. Caatinga Revisited: Ecology and Conservation of an Important Seasonal Dry Forest. The Scientific World Journal, Cairo, v. 2012, s/n., p. 1–18, 2012.
ASSIS, J. M. O. et al. Mapeamento do uso e ocupação do solo no município de Belém de São Francisco – PE no anos de 1985 e 2010. Revista Brasileira de Geografia Física, Recife, v. 7, n. 5, p. 859–870, 2014.
ASSIS, J. M. O.; SOUZA, W. M.; SOBRAL, M. C. Análise climática da precipitação no submédio da bacia do rio São Francisco a partir do índice de anomalia de chuva. Revista Brasileira de Ciências Ambientais, São Paulo, v. 36, n. 6, p. 188–202, 2015.
BEUCHLE, R. et al. Land cover changes in the Brazilian Cerrado and Caatinga biomes from 1990 to 2010 based on a systematic remote sensing sampling approach. Applied Geography, Nova Iorque, v. 58, n. 3, p. 116–127, 2015.
BULLOCK, S. H.; MOONEY, B. H. A.; MEDINA, E. Seasonally Dry Tropical Forests. Cambridge: Cambridge University Press, 1995. 408 p.
CHANDER, G.; MARKHAM, B. L.; HELDER, D. L. Summary of current radiometric calibration coefficients for Landsat MSS, TM, ETM+, and EO-1 ALI sensors. Remote Sensing of Environment, Nova Iorque, v. 113, n. 5, p. 893–903, 2009.
COELHO, V. H. R. et al. Dinâmica do uso e ocupação do solo em uma bacia hidrográfica do semiárido brasileiro. Revista Brasileira de Engenharia Agrícola e Ambiental, Campina Grande, v. 18, n. 1, p. 64–72, 2014.
COIMBRA-FILHO, A. F.; CÂMARA, I. G. Os limites originais do bioma Mata Atlântica na região nordeste do Brasil. Rio de Janeiro, RJ: Fundação Brasileira para a Conservação da Natureza, 1996. 86 p.
ESRI. ArcGIS Desktop: Release 10. Redlands, USA: Environmental Systems Research Institute, 2011.
FOLEY, J. A. et al. Global consequences of land
use. Science, Washington, D.C., v. 309, n. 5734, p. 570–574, 2005.
FOX, J. The {R} {C}ommander: A Basic Statistics Graphical User Interface to {R}. Journal of Statistical Software, Los Angeles, v. 14, n. 9, p. 1– 42, 2005.
GUTMAN, G. et al. Assessment of the NASA -USGS Global Land Survey (GLS) datasets. Remote Sensing of Environment, Nova Iorque, v. 134, n. 7, p. 249–265, 2013.
LEAL, I. R.; TABARELLI, M.; SILVA, J. M. C. Ecologia e conservação da Caatinga. Recife, PE: Editora Universitária da UFPE, 2003. 822 p.
LIMA, L. C. M.; BARBOSA, M. C. A.; BARBOSA, D. C. A. Calendário didático de floração de espécies lenhosas da caatinga de Pernambuco, com base em coleções do Herbário UFP - Geraldo Mariz. Recife, PE: Editora Universitária da UFPE, 2009. 74 p.
MASEK, J. Automated registration and orthorectification package for Landsat and Landsat-like data processing. Journal of Applied Remote Sensing, Bellingham, v. 3, n. 1, p. 33515, 2009.
MAYAUX, P. et al. Tropical forest cover change in the 1990s and options for future monitoring. Philosophical transactions of the Royal Society of London. Series B, Biological Sciences, Londres, v. 360, n. 1454, p. 373–384, 2005.
MCGARIGAL, K.; MARKS, B. J. FRAGSTATS: Spatial pattern analysis program for quantifying categorical maps. Corvallis, USA: Forest Science Department, Oregon State University, 1995. 112 p.
MENEZES, R. S. C. et al. Biogeochemical cycling in terrestrial ecosystems of the Caatinga Biome. Brazilian Journal of Biology, São Paulo, v. 72, n. 3, p. 643–53, 2012.
NETELER, M. et al. GRASS GIS: A multi-purpose open source GIS. Environmental Modelling & Software, Provo, v. 31, n. 5, p. 124–130, 2012.
PORTILLO-QUINTERO, C. A.; SÁNCHEZ-AZOFEIFA, G. A. Extent and conservation of tropical dry forests in the Americas. Biological Conservation, Montpellier, v. 143, n. 1, p. 144–155, 2010.
Rev. Caatinga n. 2, p. 123–153, 2013.
ROE, D. et al. Which components or attributes of biodiversity influence which dimensions of poverty? Environmental Evidence, Londres, v. 3, n. 1, p. 1– 15, 2014.
SANTOS, J. C. et al. Caatinga: the scientific negligence experienced by a dry tropical forest. Tropical Conservation Science, São Francisco, v. 4, n. 3, p. 276–286, 2011.
TAURA, T. A. et al. Análise Temporal da Degradação Ambiental no Município de Santa Maria da Boa Vista – PE a partir de Imagens Orbitais. In: 2nd International Conference: Climate, Sustainability and Development in Semi-arid Regions, 2., 2010, Fortaleza. Anais... Fortaleza: UFC, 2010. p. 1-9.
VIEIRA, R. M. D. S. P. et al. Land use and land cover map of a semiarid region of Brazil for meteorological and climatic models. Revista Brasileira de Meteorologia, Rio de Janeiro, v. 28, n. 2, p. 129–138, 2013.
ZARAGOZÍ, B. et al. A free and open source programming library for landscape metrics calculations. Environmental Modelling & Software, Provo, v. 31, n. 5, p. 131–140, 2012.