Nutrient digestibility and changes in feeding behavior of cattle fed cottonseed and
Texto
Imagem
Documentos relacionados
Afinal, se o marido, por qualquer circunstância, não puder assum ir a direção da Família, a lei reconhece à mulher aptidão para ficar com os poderes de chefia, substituição que
Por isso, é imperioso e necessário proceder continuamente ao estudo das obras, não apenas daqueles autores que foram considerados de primeira grandeza pelas Histórias Literárias que
Vale a pena ressalvar que existem textos da Sinapis Editores que têm boa qualidade, apenas não se inserem no catálogo da Alêtheia e da Ideia-Fixa, ou de outras
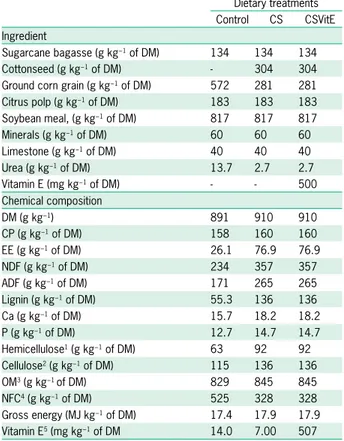
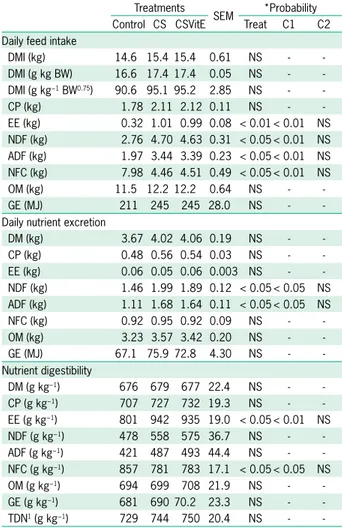
Abstract – The objective of this work was to evaluate the effects of different levels of sugarcane bagasse, as exclusive roughage, on nutrient intake and digestibility,
The effects of protein sources supplemented with urea-treated potato pulp (PP) silage and feeding levels of the PP silage-based concentrate on feed intake, digestibility and ruminal
Effect of two concentrate levels and two sward heights on estimated dry matter intake (DMI) and feeding behaviour of lactating dairy cows when grazing and having simultaneously
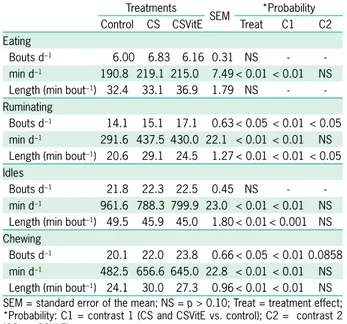
Feeding behavior: time spent feeding (Feeding), ruminating (Rumination), and performing other activities (Other activities); total chewing time (TCT); number of feeding
Current research has been conducted to evaluate the use of cashew nut shell liquid (CNSL) in diets of lactating cows and its effects on intake and digestibility of nutrients, milk
