ISSN 1678-992X
ABSTRACT: Owing to the lack of information in the literature about the ideal feeding frequency adopted by feedlot systems, this study was designed to evaluate the effect of different feeding frequencies on performance, carcass traits, feeding behavior and rumen morphometrics of Nel-lore cattle. Forty-eight yearling bulls were housed in individual pens with an average initial body weight of 358.2 kg. The experiment was designed as a completely randomized block and the treatments were the feeding of cattle one, two, three, or four times daily (n = 12 per treatment). Orthogonal contrasts were used to assess linear, quadratic and cubic relationship between feed-ing frequency and the dependent variable. As feedfeed-ing frequency increased, final body weight (p = 0.03) and average daily gain (p = 0.01; one: 0.98 kg d–1; two: 0.96 kg d–1; three: 1.18
kg d–1; four: 1.14 kg d–1) increased linearly and the feed:gain ratio decreased (p = 0.02). Also, as
feeding frequency increased, hot carcass weight was affected cubically (p = 0.01; one: 246.9 kg; two: 243.0 kg; three: 263.1 kg; four: 258.1 kg). During the adaptation period dry matter intake variation was affected cubically (p ≤ 0.05; one: 16 %; two: 23 %; three: 14 %; four: 16 %). Increases in feeding frequency affected papillae height (p < 0.01) and papillae surface area (p < 0.01) cubically, as well as producing increases in the mitotic index (p = 0.05; one: 9 %; two: 11 %; three: 13 %; four: 13 %) and cells in proliferation (p = 0.05) linearly. Thus, Nellore yearling bulls should be fed three times daily in feedlot operations.
Keywords: Zebu, carcass, concentrate, intake, papillae
Feedlot performance, feeding behavior and rumen morphometrics of
Juliana da Silva1, Tássia Veluma Barbosa Carrara3, Murillo Ceola Stefano Pereira3, Cassiele Aparecida de Oliveira1, Ivan Carlos Batista
Júnior2, Daniel Hideki Mariano Watanabe2, André Luiz Nagatani Rigueiro3, Mário De Beni Arrigoni3, Danilo Domingues Millen2*
1University of São Paulo/FZEA – Dept. of Animal Science, Av.
Duque de Caxias Norte, 225 – 13635-900 – Pirassununga, SP – Brazil.
2São Paulo State University/FCAT, Rod. Cmte João Ribeiro de
Barros, km 651 – 17900-000 – Dracena, SP – Brazil.
3São Paulo State University/FMVZ – Dept. of Animal Breeding
and Nutrition, R. Prof. Dr. Walter Mauricio Correa, s/n – 18618-681 – Botucatu, SP – Brazil.
*Corresponding author <[email protected]>
Edited by: Gerson Barreto Mourão
Received August 25, 2016 Accepted February 02, 2017
Introduction
Nowadays, increasing demand for high-quality beef has led to the necessity for intensification. Conse-quently, in Brazil, feedlot systems as a method of im-proving beef quality and reducing age at slaughter have been growing in popularity. Thus changes in manage-ment practices are needed since this increase in demand directly affects cattle behavior, health and the cost of production.
To reduce age at slaughter, and accelerate muscle and fat deposition, rations containing high levels of non-fiber carbohydrates, mainly starch, are needed due to the greater nutrient requirements of cattle during the finish-ing phase. However, when cattle are fed high-grain diets, a broad range of fermentative processes is initiated in the ruminal environment, and if proper feeding management is not in place, a digestive disturbance known as ruminal acidosis may develop (DiLorenzo et al., 2006).
Based on these facts, Millen et al. (2009) reported that there are several nutritional strategies that could be adopted to either avoid or alleviate excessive fermenta-tion of non-fiber carbohydrates in the rumen, such as gradual adaptation to high-grain diets, use of feed addi-tives, larger roughage particles, inclusion of fats in the ration, delivery feed to the bunks at the same time every day, reduction in dry matter intake (DMI) variation, and increases in feeding frequency.
As the literature is not clear about how often feed-lot cattle should be fed daily, cattle feeders and
nutri-Nellore cattle submitted to different feeding frequencies
tionists generally determine feeding frequency by con-sidering the number of animals and pens to feed, and the number and capacity of the mixers and equipment available in order to explore maximum performance and reduce problems related to rumen acidification. Robin-son and McQueen (1994) reported higher rumen pH and lesser propionate concentration in the rumen of dairy Holsteins cows fed five times a day when compared to cows fed twice a day. Moreover, Soto-Navarro et al. (2000) reported that feeding steers twice daily decreased ruminal volatile fatty acid concentration and also led to higher ruminal pH compared to those fed once daily. Robles et al. (2007) fed Holstein heifers once, twice, 3 times, and 4 times daily, and concluded that feeding twice daily could be a practical way to better control the daily fall in pH, and reduce the range of pH values; however, the ideal feeding frequency for feedlot cattle remains unclear.
Thus, this study was designed to evaluate the ef-fects of different feeding frequencies on feedlot perfor-mance, carcass traits, feeding behavior, and rumen mor-phometrics in Nellore cattle.
Materials and Methods
This study was conducted in Dracena, São Paulo, Brazil (21°28'57” S, 51°31'58” W, altitude 421 m). Ani-mal care procedures followed guidelines established by the São Paulo State University Ethical Committee for Animal Research (Protocol 37/2012).
Animal Science and Pastur
es
|
Resear
ch Ar
Animals, nutritional management and performance measurements
Forty-eight 18 month-old bulls with an initial body weight of 358.2 ± 19.2 kg were housed in individual pens (1.0 m by 7.0 m) and fed ad libitum. The experiment was designed as a completely randomized block and ani-mals were assigned to one offour feeding frequencies evaluated: 1) once daily (at 08:00 [100 % of total ration]), twice daily (at 08:00 [40 % of total ration] and 14:00 [60 % of total ration]), three times daily (at 08:00 [30 % of total ration], 11:00 [20 % of total ration] and 14:00 [50 % of total ration]), and four times daily (at 08:00 [25 % of total ration], 11:00 [20 % of total ration], 14:00 [20 % of total ration] and 17:00 [40 % of total ration]). Each treat-ment was replicated 12 times.
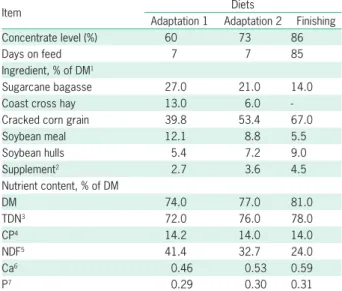
At the beginning of the study in each year, all yearling bulls were dewormed and vaccinated (tetanus, bovine viral diarrhea virus, 7-way Clostridium sp.). The experiment lasted 94 days: 9 days to adapt cattle to the high-grain diet, and 85 days for the finishing period. The adaptation program consisted of two adaptation diets, which contained 60 % and 73 % concentrate, and spanned a period of 5 and 4 days, respectively. Ex-perimental diets were composed of sugarcane bagasse, coast cross hay, cracked corn grain, soybean meal, soy-bean hulls and a supplement containing urea (Table 1). The diets were formulated according to the Large Ru-minant Nutrition System (LRNS; Fox et al., 2004).
The amount of feed offered was adjusted every day based on the amount of feed refusals (target was 3 % to 5 % orts) before each morning delivery. Feed of-fered and refused were weighed daily in the morning
and sampled weekly for chemical analysis. The DMI was calculated daily and expressed in kg and as a per-centage of body weight (BW). Yearling bulls had free-choice water access to a water trough (0.89 m × 1.00 m × 1.00 m). Cattle were not withheld from feed before every BW assessment, carried out both at the beginning and at the end of the study. At each BW assessment, cat-tle were weighed on two consecutive days and the final data represent the average of the two weights obtained (Stock et al., 1983). Finally, a 4 % discount was applied to the average BW measured to obtain the shrunk BW, which was used to calculate the average daily gain, DMI in % of BW, and dressing percentage. A fasting period was not used before every BW assessment so as to avoid problems related to aggressive feed consumption on the days following this procedure.
The hot carcass weight was obtained at a commer-cial abattoir after kidney-pelvic fat removal. Dressing per-centage was calculated by dividing hot carcass weight by final BW. Biceps femoris fat thickness (P8) and 12th rib fat
thickness were measured via ultrasound at the beginning and at the end of the study following the method described by Perkins et al. (1992). Based on the difference between the initial and the final measurements of fat thickness and the time in days spent on feed, the 12th back fat
thick-ness daily gain and P8 fat thickthick-ness daily gain were cal-culated. Images were collected using a 17.2 cm, 3.5 MHz probe. Rib fat thickness was measured at the 12th to 13th
rib interface over the Longissimus muscle, two-thirds the distance from the spine between the medial and lateral muscle ends. A single trained technician scanned and ana-lyzed all images. Yearling bulls were all harvested (n = 48) when a 12th rib fat thickness of 5 mm was achieved based
upon the average obtained across all treatment groups to achieve the minimum fat cover level that meets Brazilian market requirements. Cattle were transported 150 kilome-ters (~ 3 h) to a commercial abattoir.
Dry matter intake variation
The DMI variation was calculated using the meth-odology proposed by Bevans et al. (2005) as the differ-ence in intake between consecutive days throughout the study. Data pertaining to daily DMI variation were ex-pressed both in kilograms and as a percentage of varia-tion as follows: [(DMI current day – DMI previous day) / DMI previous day * 100]. The daily DMI was calculated for both the adapting and finishing periods, as well as for the entire feeding period.
Feeding behavior
Feeding behavior data were collected visually dur-ing the experimental period on day 5 (adaptation period) and day 51 (finishing period) using a method adapted from Robles et al. (2007), whereby feeding behavior was recorded for each animal every 5 min over a 24 h period. Feeding behavior variables collected were as follows: time spent eating, time spent ruminating and time spent resting expressed in minutes (min) and number of meals per day.
Table 1 – Feed ingredients and chemical composition of experimental
diets fed to Nellore yearling bulls consuming high-concentrate diets.
Item Diets
Adaptation 1 Adaptation 2 Finishing
Concentrate level (%) 60 73 86
Days on feed 7 7 85
Ingredient, % of DM1
Sugarcane bagasse 27.0 21.0 14.0
Coast cross hay 13.0 6.0
-Cracked corn grain 39.8 53.4 67.0
Soybean meal 12.1 8.8 5.5
Soybean hulls 5.4 7.2 9.0
Supplement2 2.7 3.6 4.5
Nutrient content, % of DM
DM 74.0 77.0 81.0
TDN3 72.0 76.0 78.0
CP4 14.2 14.0 14.0
NDF5 41.4 32.7 24.0
Ca6 0.46 0.53 0.59
P7 0.29 0.30 0.31
1Dry matter; 2Supplement contained 27 % of urea as a N source, as well as Ca,
The DMI were measured on the days data was col-lected. The meal length in min was calculated by divid-ing time spent eatdivid-ing by the number of meals per day. The DMI per meal in kg was calculated by dividing DMI by the number of meals per day. Additionally, data per-taining to time spent eating and time spent ruminating were used to calculate the DM eating rate (time spent eating/DMI) and the rumination rate of DM (time spent ruminating/DMI), both expressed in min kg–1 of DM.
Samples of diets and orts were collected for chemical analysis of neutral detergent fiber (NDF, Van Soest et al., 1991) to determine NDF intake on the day of each feed-ing behavior data collection. , and the NDF intake:DMI ratio was calculated to support the data on selective consumption. The NDF eating rate was calculated by dividing time spent eating by the NDF intake. The NDF rumination rate was determined by dividing time spent ruminating by the NDF intake. Both the NDF eating rate and the NDF rumination rate were expressed in min kg–1
of NDF. The eating and rumination rates of both DM and NDF are useful for evaluating how fast cattle con-sume the feed offered.
Selective consumption
Samples of diets and orts were also collected on days 5 (adaptation period) and 51 (finishing period) of the study to establish particle-size distribution, which was determined by sieving using a particle size sepa-rator and reported on the as-fed basis as described by Kononoff et al. (2003). Selective consumption was deter-mined as follows: n intake/n predicted intake, in which n = particle fraction screens of 19 mm (long), 8 mm (medium), 1.18 mm (short), and a pan (fine). Selective consumption values equal to 1 indicate no sorting, < 1 indicate selective refusals (sorting against), and > 1 preferential consumption (sorting for).
Incidence of rumenitis and liver abscess
An evaluation of rumenitis was conducted after cattle evisceration, and all entire washed rumens were scored. Rumen epithelium was classified according to the lesion incidences (rumenitis and hyperkeratosis) and abnormalities as described by Bigham and McManus (1975) on a scale of zero to ten, where zero indicated no lesions or abnormalities and ten, severe ulcerative lesions all over the rumen wall. All rumens were scored by two trained individuals, who were blinded to the treatments, and final data represent the average of the two scores. Liver abscesses were scored according to in-cidence and severity following the method proposed by Brink et al. (1990).
Ruminal morphometrics
At harvest, rumen and reticulum compartments were isolated. A 1.0 cm2 fragment of each rumen was
collected from the cranial sac (Atrium ruminis) and placed into a PBS solution for future morphometric mea-surements according to Daniel et al. (2006) and Resende
Júnior et al. (2006). Manually, the number of papillae per cm2 of rumen wall (NOP) was determined. Twelve
papillae were randomly collected from each fragment, scanned, and mean papillae area (MPA) was determined using an image analysis system. The rumen wall absorp-tive surface area (ASA) in cm2 was calculated as follows:
1 + (NOP * MPA) – (NOP * 0.002); where 1 represents the 1 cm2 fragment collected, and 0.002 is the estimated
basal area of papillae in cm2.
Moreover, a 1.0 cm2 fragment of each rumen was
collected from the ventral sac for histological and im-munohistochemistry assessment. Histological sections were stained with hematoxylin and eosin, embedded in paraffin wax, and sectioned according to Odongo et al. (2006). Morphometric measurements, such as papillae surface area, papillae height, papillae width, keratinized layer thickness, and mitotic index, were determined in four papillae per animal using computer-aided light mi-croscope image analysis. To determine the mitotic index, number of cells exhibiting mitotic figures was deter-mined by using the same microscope just described, and final data was expressed as a percentage of two thousand cells.
Immunohistochemistry variables were evaluated using a technique adapted from Pereira et al. (2010) to determine cell proliferation and cell death indexes of the rumen epithelium. The same 1.0 cm2 fragment collected
from the ventral sac was used. The number of dead cells and proliferating cells was determined in 4 papillae per animal using TUNEL and PCNA immunohistochemistry techniques, respectively. The same microscope just de-scribed was used and data were expressed as a percent-age of all cells in each papillae. The final data represent the average of the four indexes calculated.
Statistical analysis
All data collected in this study were analyzed as a completely randomized block design using the MIXED procedure of SAS (Statistical Analysis System, v. 9.2) including the CONTRAST option. The model included the main effect of feeding frequency (one, two, three, or four times daily), and the random effect of block. Initial BW was used as criteria to form the 12 blocks utilized in this study. Orthogonal contrasts were used to assess linear, quadratic and cubic relationship between feed-ing frequency and the dependent variable. Results were considered significant at p≤ 0.05 level.
Results
Feedlot performance and carcass traits
Results on feedlot performance and carcass traits are presented in Table 2. As feeding frequency increased, final BW (p ≤ 0.03) and average daily gain (ADG; p ≤
feed-ing frequency did not affect (p > 0.05) the other perfor-mance and carcass trait variables evaluated in this study (Table 2).
Dry matter intake variation
Results of DMI variation are presented in Table 3. During the adaptation period, as feeding frequency in-creased, DMI variation, expressed both in percentage and kilograms, was affected cubically (p≤ 0.05). However, as feeding frequency increased DMI variation expressed in kilograms was affected quadratically during the finishing period (p≤ 0.03) as well as during the entire feeding pe-riod (p≤ 0.02 kg). The DMI variation expressed in per-centage remained unaffected (p > 0.05) during both the finishing and entire feeding periods (Table 3).
Feeding behavior and selective consumption
Feeding behavior results are presented in Table 4. As feeding frequency increased, during the adaptation period, NDF intake was affected cubically (p≤ 0.02) and NDF intake:DMI ratio was affected quadratically (p ≤
0.01). On the other hand, for the adaptation period, feed-ing frequency did not affect (p > 0.05) DMI, time spent eating, time spent ruminating, time spent resting, meals per day, DMI per meal, meal length, eating rate of DM, rumination rate of DM, eating rate of NDF and rumina-tion rate of NDF (Table 4).
Moreover, during the finishing period, as feeding frequency increased, DMI (p ≤ 0.02) inceased linearly, time spent ruminating (p ≤ 0.01) and time spent rest-ing (p≤ 0.01) were affected cubically, and NDF intake
Table 2 – Performance and carcass traits of Nellore feedlot cattle subjected to different feeding frequencies.
Item Feeding frequency
1
SEM2 Probability (p value)
1x 2x 3x 4x Linear Quadratic Cubic
Feedlot performance
Initial BW3, kg 356.79 355.63 356.92 357.19 7.89 0.70 0.62 0.59
Final BW, kg 449.81 445.43 467.43 463.61 9.51 0.03 0.96 0.07
ADG4, kg d–1 0.979 0.961 1.175 1.138 0.060 0.01 0.87 0.08
DMI5, kg d–1 7.75 7.95 8.44 8.10 0.24 0.12 0.22 0.26
DMI, % of BW 1.91 1.98 2.04 1.97 0.04 0.25 0.09 0.55
Gain:feed ratio 0.128 0.121 0.141 0.142 0.006 0.02 0.52 0.08
Carcass traits
HCW6, kg 246.91 242.99 263.07 258.05 5.98 0.01 0.89 0.01
Dressing percentage 54.97 54.62 56.14 55.58 0.51 0.15 0.84 0.09
Kidney-pelvic fat, kg 3.42 3.43 3.73 3.98 0.34 0.18 0.71 0.82
Kidney-pelvic fat, % of HCW 1.38 1.40 1.41 1.53 0.12 0.37 0.68 0.80
Initial 12th back fat thickness, mm 2.38 2.36 2.45 2.47 0.10 0.41 0.84 0.68
Final 12th back fat thickness, mm 5.53 5.58 5.41 5.86 0.26 0.48 0.44 0.47
12th back fat thickness daily gain, mm d–1 0.034 0.035 0.032 0.037 0.003 0.68 0.48 0.37
Initial P8 fat thickness, mm 2.78 2.52 2.79 2.64 0.12 0.75 0.61 0.07
Final P8 fat thickness, mm 6.24 6.37 6.31 6.50 0.28 0.57 0.92 0.73
P8 fat thickness daily gain, mm d–1 0.038 0.042 0.038 0.042 0.003 0.44 0.91 0.23 11x (08h00 [100 % of total ration]), 2x (08h00 [40 % of total ration] and 14h00 [60 % of total ration]), 3x (08h00 [30 % of total ration], 11h00 [20 % of total ration]
and 14h00 [50 % of total ration]), and 4x (08h00 [25 % of total ration], 11h00 [20 % of total ration], 14h00 [20 % of total ration] and 17h00 [40 % of total ration]);
2Standard error of mean; 3Body weight; 4Average daily gain; 5Dry matter intake; 6Hot carcass weight.
Table 3 – Dry matter intake variation of in kilograms and percentage of Nellore feedlot cattle subjected to different feeding frequencies during
the adaptation period, finishing period and entire feeding period.
Item Feeding frequency
1
SEM2 Probability (p value)
1x 2x 3x 4x Linear Quadratic Cubic
Adaptation period (14 days)
DMI3 variation, % 16.06 23.17 14.41 15.89 2.86 0.47 0.33 0.05
DMI variation, kg 0.82 1.07 0.80 0.84 0.09 0.63 0.27 0.05
Finishing period (80 days)
DMI variation, % 15.64 15.94 17.51 16.35 1.38 0.55 0.60 0.53
DMI variation, kg 0.97 1.06 1.28 1.12 0.05 0.01 0.03 0.37
Entire feeding period (94 days)
DMI variation, % 15.69 16.85 17.18 16.30 1.31 0.71 0.44 0.95
DMI variation, kg 0.95 1.06 1.23 1.09 0.05 0.01 0.02 0.10
11x (08h00 [100 % of total ration]), 2x (08h00 [40 % of total ration] and 14h00 [60 % of total ration]), 3x (08h00 [30 % of total ration], 11h00 [20 % of total ration]
and 14h00 [50 % of total ration]), and 4x (08h00 [25 % of total ration], 11h00 [20 % of total ration], 14h00 [20 % of total ration] and 17h00 [40 % of total ration]);
(p≤ 0.01), the NDF intake:DMI ratio (p≤ 0.01), the NDF eating (p≤ 0.01) and the NDF rumination rate (p≤ 0.01) were affected quadratically. On the other hand, feeding frequency did not affect (p > 0.05) time spent eating, meals per day, DMI per meal, meal length, eating rate of DM and rumination rate of DM during this period (Table 4).
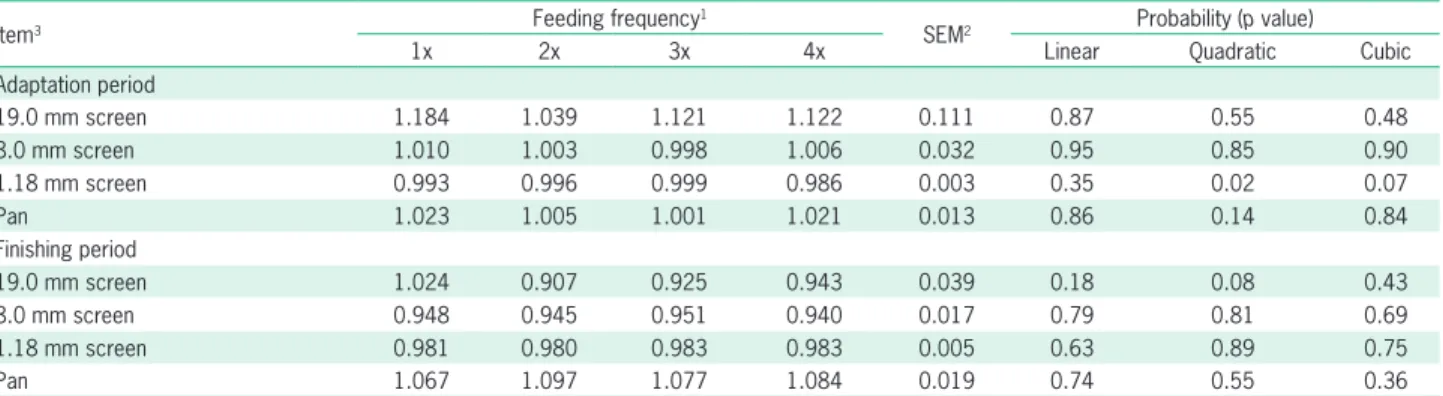
Selective consumption results are presented in Table 5. As feeding frequency increased, the 1.18 mm screen was affected quadratically (p≤ 0.02) during the adaptation period. However, no feeding frequency effect (p > 0.05) was observed for any other variable measured in this study related to selective consumption (Table 5).
Liver abscess, incidence of rumenitis and ruminal morphometrics
Liver abscesses were not observed in any of the animals. Feeding frequency did not affect (p > 0.05) the incidence of rumenitis in the animals studied (Table 6).
Feeding frequency did not affect (p > 0.05) the ruminal morphometrics parameters measured in the
cranial sac, such as the number of papillae, mean pa-pillae area, absorptive surface area, and papa-pillae area expressed as a percentage of the absorptive surface area. Also, feeding frequency did not affect (p > 0.05) papillae width, keratinized layer thickness, proliferation index, number of dead cells, and the cell death index measured in the ventral sac. However, as feeding frequency in-creased, papillae height (p≤ 0.01) and papillae surface area (p≤ 0.01) measured in the ventral sac were affected cubically. In addition, as feeding frequency increased, cells in mitosis (p ≤ 0.05), the mitotic index (p≤ 0.05) and cells in proliferation (p≤ 0.05), also measured in the ventral sac, increased linearly (Table 6).
Discussion
Usually where there are increases in feeding fre-quency, an increase in DMI would also be expected which would, in turn, increase ADG and the final BW. Despite the linear increase observed (p ≤ 0.05) for ADG and the final BW, this effect was not observed (p > 0.05)
Table 4 – Feeding behavior variables of Nellore feedlot cattle subjected to different feeding frequencies during the adaptation and the finishing
periods.
Item Feeding frequency
1
SEM2 Probability (p value)
1x 2x 3x 4x Linear Quadratic Cubic
Adaptation period
DMI3, kg 6.77 7.33 7.63 6.52 0.43 0.82 0.06 0.55
Time spent eating, min 172.92 185.00 164.58 152.92 14.18 0.16 0.45 0.62
Time spent ruminating, min 217.92 191.67 190.83 189.58 17.76 0.29 0.49 0.75 Time spent resting, min 1049.17 1063.33 1084.58 1097.50 22.50 0.11 0.98 0.88
Meals per day, n 13.50 16.67 14.42 13.08 1.24 0.60 0.14 0.35
DMI per meal, kg 0.54 0.51 0.57 0.49 0.06 0.82 0.66 0.38
Meal length, min 12.43 11.27 12.03 12.17 0.91 1.00 0.48 0.54
Eating rate of DM4, min kg–1 25.51 23.66 21.02 22.95 2.04 0.23 0.41 0.65
Rumination rate of DM, min kg–1 28.95 26.57 24.89 31.45 2.57 0.70 0.12 0.43
NDF5 intake, kg 2.03 1.80 2.08 1.74 0.10 0.22 0.60 0.02
NDF intake: DMI ratio 0.29 0.25 0.27 0.27 0.01 0.29 < 0.01 0.12
Eating rate of NDF, min kg–1 88.55 83.36 80.75 86.14 6.43 0.73 0.41 0.85
Rumination rate of NDF, min kg–1 103.81 108.00 91.20 116.14 7.36 0.71 0.31 0.09
Finishing period
DMI, kg 8.34 8.69 9.59 9.15 0.36 0.02 0.22 0.19
Time spent eating, min 175.42 177.08 204.58 179.58 14.34 0.51 0.33 0.20
Time spent ruminating, min 427.08 385.83 455.83 429.17 15.14 0.27 0.63 < 0.01 Time spent resting, min 837.50 877.08 779.58 831.25 20.25 0.19 0.76 < 0.01
Meals per day, n 13.33 14.58 15.67 13.25 1.24 0.88 0.15 0.55
DMI per meal, kg 0.67 0.70 0.64 0.72 0.05 0.75 0.68 0.45
Meal length, min 13.53 12.81 13.50 13.74 0.80 0.72 0.55 0.60
Eating rate of DM, min kg–1 20.91 20.50 21.45 19.78 1.49 0.71 0.67 0.54
Rumination rate of DM, min kg–1 51.76 44.68 47.98 48.07 2.19 0.40 0.09 0.14
NDF intake, kg 2.58 4.08 3.45 2.80 0.14 0.93 < 0.01 < 0.01
NDF intake: DMI ratio 0.31 0.47 0.36 0.31 0.01 < 0.01 < 0.01 0.11
Eating rate of NDF, min kg–1 68.15 43.94 59.68 64.96 4.33 0.74 < 0.01 < 0.01
Rumination rate of NDF, min kg–1 168.55 95.13 133.84 157.41 7.36 0.86 < 0.01 < 0.01 11x (08h00 [100 % of total ration]), 2x (08h00 [40 % of total ration] and 14h00 [60 % of total ration]), 3x (08h00 [30 % of total ration], 11h00 [20 % of total ration]
and 14h00 [50 % of total ration]), and 4x (08h00 [25 % of total ration], 11h00 [20 % of total ration], 14h00 [20 % of total ration] and 17h00 [40 % of total ration]);
for DMI in this study. Nonetheless, it seems that cattle fed either three or four times daily had more stable fer-mentation, as they presented a greater number of pro-liferating cells in the rumen epithelium, which resulted in a higher mitotic index and larger papillae areain the ventral sac, which may explain the linear increase in ADG and the final BW. Based on this fact, the G:F ra-tio improved linearly, (p ≤ 0.05), which shows that the greater the feeding frequency, the more efficient the consumption by cattle leading, in turn, to better feed-lot performance. Moreover, the cubic response obtained for HCW indicates that Nellore yearling bulls fed three times a day were even more efficient in converting feed
into carcass components when compared to cattle fed once, twice, or four times a day. These results agree with Colemen and Wyatt (1982) and Sniffen and Rob-inson (1984) who stated that increases in ADG and im-provements in feed efficiency are often observed with increases in feeding frequency, and this might be related to the greater uniformity in rumen metabolites. Further-more, Schwartzkopf-Genswein et al. (2011) reported higher ADG and an improved G:F ratio for cattle that had more meals per day, ranging from 4.0 to 6.6 times. In this study, DMI and ADG were lower than the values usually documented in the literature for two main rea-sons: cattle were fed in individual pens, which may have
Table 5 – Selective consumption related of the diets offered to Nellore cattle submitted to different feeding frequencies during the adaptation
and the finishing period.
Item3 Feeding frequency
1
SEM2 Probability (p value)
1x 2x 3x 4x Linear Quadratic Cubic
Adaptation period
19.0 mm screen 1.184 1.039 1.121 1.122 0.111 0.87 0.55 0.48
8.0 mm screen 1.010 1.003 0.998 1.006 0.032 0.95 0.85 0.90
1.18 mm screen 0.993 0.996 0.999 0.986 0.003 0.35 0.02 0.07
Pan 1.023 1.005 1.001 1.021 0.013 0.86 0.14 0.84
Finishing period
19.0 mm screen 1.024 0.907 0.925 0.943 0.039 0.18 0.08 0.43
8.0 mm screen 0.948 0.945 0.951 0.940 0.017 0.79 0.81 0.69
1.18 mm screen 0.981 0.980 0.983 0.983 0.005 0.63 0.89 0.75
Pan 1.067 1.097 1.077 1.084 0.019 0.74 0.55 0.36
11x (08h00 [100 % of total ration]), 2x (08h00 [40 % of total ration] and 14h00 [60 % of total ration]), 3x (08h00 [30 % of total ration], 11h00 [20 % of total ration]
and 14h00 [50 % of total ration]), and 4x (08h00 [25 % of total ration], 11h00 [20 % of total ration], 14h00 [20 % of total ration] and 17h00 [40 % of total ration]);
2Standard error of mean; 3Selective consumption = n intake/n predicted intake, in which n = particle fraction screens of 19 mm (long), 8 mm (medium), 1.18 mm
(short), and a pan (fine). Selective consumption values equal to 1 indicate no sorting, < 1 indicate selective refusals (sorting against), and > 1 indicate preferential consumption (sorting for).
Table 6 – Incidence of rumenitis and rumen morphometrics of feedlot Nellore cattle submitted to different feeding frequencies.
Item Feeding frequency
1
SEM2 Probability (p value)
1x 2x 3x 4x Linear Quadratic Cubic
Rumenitis score 2.00 1.80 2.20 2.30 0.42 0.49 0.72 0.63
Cranial sac
Number of papillae, n 45.00 43.00 40.00 42.00 3.16 0.42 0.50 0.51
Mean papillae area, cm2 0.52 0.49 0.47 0.56 0.05 0.67 0.19 0.62
Rumen wall absorptive surface area, cm2 23.09 21.64 20.17 24.61 2.32 0.77 0.21 0.57
Papillae area, % of absorptive surface area 95.68 95.11 94.67 95.91 0.58 0.92 0.13 0.55 Ventral sac
Papillae height, mm 2.85 2.79 3.29 3.14 0.06 < 0.01 0.50 <0.01
Papillae width, mm 0.37 0.36 0.34 0.35 0.01 0.07 0.21 0.44
Papillae area, mm2 1.11 1.11 1.29 1.22 0.03 < 0.01 0.25 <0.01
Keratinized layer thickness, µm 20.26 19.48 20.37 20.85 0.57 0.30 0.27 0.42
Cells in mitosis, n 182.33 211.92 257.00 252.67 28.08 0.05 0.55 0.61
Mitotic index, % of basal cells 9.12 10.60 12.85 12.63 1.40 0.05 0.55 0.61
Cells in proliferation, n 536.71 799.01 854.07 830.82 106.92 0.04 0.20 0.81
Proliferation index, % 71.78 70.15 68.69 70.67 1.77 0.55 0.31 0.68
Number of dead cells, n 692.57 770.90 813.41 760.82 136.64 0.69 0.63 0.92
Cell death index, % 67.85 69.07 66.58 68.44 1.66 0.91 0.84 0.28
11x (08h00 [100 % of total ration]), 2x (08h00 [40 % of total ration] and 14h00 [60 % of total ration]), 3x (08h00 [30 % of total ration], 11h00 [20 % of total ration]
and 14h00 [50 % of total ration]), and 4x (08h00 [25 % of total ration], 11h00 [20 % of total ration], 14h00 [20 % of total ration] and 17h00 [40 % of total ration]);
reduced DMI; moreover; they had a considerable rate of adipose tissue accretion on carcass during the study, which increased their maintenance requirements, and negatively impacted DMI, resulting in low ADG.
The fact that cattle fed three times daily showed less DMI variation during the adaptation period might have contributed to promoting a better rumen environ-ment for ferenviron-mentation, and as a result, improveenviron-ments in the G:F ratio. Yang and Varga (1989) reported that DMI variation decreases as feeding frequency increas-es, which may lead to more stable ruminal conditions. Although the adaptation period represents only a small portion of the entire feeding period (no more than 20 % according to Brown et al., 2006), it is a critical period because the rumen epithelium is still developing to ad-just for the production and absorption of short-chain fatty acids. Cattle fed three times daily presented the largest papillae area in this study, which may be a posi-tive effect of more adequate rumen fermentation during the adaptation period. However, in the finishing period, cattle fed three times daily had increased DMI varia-tion in kg, but not in percentage terms, which was not enough to negatively affect feedlot performance and ru-men morphometrics of these animals, possibly because they were already well adapted to the finishing diet fed. Galyean et al. (1992) showed that daily DMI variation greater than 10 % may negatively impact cattle perfor-mance, but in their study cattle were fed in groups, not in individual pens as in this study.
Cattle fed once and three times daily presented greater NDF intake during the adaptation period, which may have contributed to less DMI variation when cattle was fed three times a day. Similarly, cattle fed twice a day consumed less NDF than expected during adaptation, as indicated by the NDF intake:DMI data ratio, which is im-portant for rumen buffering and may have compromised the development of papillae, in terms of height and area, in the ventral sac. In addition, in the finishing period, cattle fed twice daily sorted for NDF, which may have impaired the feedlot performance of these animals. Cattle fed three times daily spent more time ruminating in the finishing period, possibly due to the numerical increase in number of meals per day, which may have in part contributed to more stable rumen fermentation resulting in an improved G:F ratio and heavier HCW. Deswysen et al. (1993) concluded that the time, feeding frequency and interval between meals could affect the distribution of feeding activities (as intake, rumination and resting) during the day. Based on this, feeding cattle three times daily seems to better adequate feeding activities during the day. Animals fed only once a day had lower NDF eat-ing and rumination rates in the finisheat-ing period, which may have negatively impacted DMI and, consequently, the overall feedlot performance of these animals. Fur-thermore, the animals fed once a day also presented the lowest papillae growth, once the papillae height, papil-lae surface area, cells in mitosis, mitotic index and cells in proliferation had presented a decreased linear effect
(p≤ 0.05). This might occur when cattle are challenged with a great amount of feed only once a day, which dis-turbs the animals’ capacity of controlling intake at the beginning of the adaptation period to prevent acidosis and avoid high ruminal variation in pH. Therefore, cattle fed once a day in this study may have learnt to control intake only after the adaptation period, leaving them not well adapted to the final diet, which may have impaired their performance. Soto-Navarro et al. (2000) reported a decrease of propionate production in animals fed once when compared to those fed twice a day, consequently reducing papillae growth. In addition, cattle fed twice a day presented lower NDF intake during the adaptation period and, thus, had less fiber to stimulate rumination and rumen buffering, which might have decreased micro-bial yield and short-chain fatty acid production, resulting in less rumen epithelium development and poorer perfor-mance when compared to cattle fed three or four times.
The use of nutritional management to reduce DMI variation during the adaptation period, as in the case of cattle fed three times a day, is an important decision that should be taken into account in a feedlot system be-cause it positively impacted rumen epithelium capacity for short-chain fatty acid removal, and as a result, im-proved cattle performance. Thus, it was concluded that Nellore yearling bulls should be fed three times daily in feedlot operations.
Acknowledgements
We would like to thank São Paulo Research Foun-dation (FAPESP) for financially supporting this project (Grant number: 2012/02069-5).
References
Bevans, D.W.; Beauchemin, K.A.; Schwartzkopf-Genswein, K.S.; McKinnon, J.J.; McAllister, T.A. 2005. Effect of rapid or gradual grain adaptation on subacute acidosis and feed intake by feedlot cattle. Journal of Animal Science 83: 1116-1132. Bigham, M.L.; McManus, W.R. 1975. Whole wheat grain feeding
of lambs. Effects of roughage and wheat grain mixtures. Australian Journal of Agricultural Research 26: 1053-1062. Brink, D.R.; Lowry, S.R.; Stock, R.A.; Parrot, J.C. 1990. Severity
of liver abscesses and efficiency of feed utilization of feedlot cattle. Journal of Animal Science 68: 1201-1207.
Brown, M.S.; Ponce, C.H.; Pulikani, R. 2006. Adaptation of beef cattle to high concentrate diets: Performance and ruminal metabolism. Journal of Animal Science 84: 25-33.
Coleman, S.W.; Wyatt, R.D. 1982. Cottonseed meal or small grains forages as protein supplements fed at different intervals. Journal of Animal Science 55: 11-17.
Deswysen, A.G.; Dutilleul, P.; Godfrin, J.P.; Ellis, W.C. 1993. Nycterohemeral eating and ruminating patterns in heifers fed grass or corn silages: analysis by finite Fourier transform. Journal of Animal Science 71: 2739-2747.
DiLorenzo, N.; Diez-Gonzalez, F.; DiCostanzo, A. 2006. Effects of feeding polyclonal antibody preparations on rumen bacterial populations and ruminal pH of steers fed high grain diets. Journal of Animal Science 84: 2178-2185.
Fox, D.G.; Tedeschi, L.O.; Tylutki, T.P.; Russell, J.B.; Van Amburgh, M.E.; Chase, L.E.; Pell, A.N.; Overton, T.R. 2004. The cornell net carbohydrate and protein system model for evaluating herd nutrition and nutrient excretion. Animal Feed Science and Technology 112: 29-78.
Galyean, M.L.; Malcolm, K.F.; Duff, G.C. 1992. Performance of feedlot steers fed diets containing laidlomycin propionate or monensin plus tylosin, and effects of laidlomycin propionate concentration on intake patterns and ruminal fermentation in beef steers during adaptation to a high concentrate diet. Journal of Animal Science 70: 2950-2958.
Kononoff, P.J.; Heinrichs, A.J.; Buckmaster, D.R. 2003. Modification of the Penn State forage and total mixed ration particle separator and the effects of moisture content on its measurements. Journal Dairy Science 86: 1858-1863.
Millen, D.D.; Pacheco, R.D.L.; Arrigoni, M.D.B.; Galyean, M.L.; Vasconcelos, J.T. 2009. A snapshot of management practices and nutritional recommendations used by feedlot nutritionists in Brazil. Journal of Animal Science 87: 3427-3439.
Odongo, N.E.; Alzahal, O.; Lindinger; M.I.; Duffield, T.F.; Valdez, E.V.; Terrell, S.P.; McBride, B.W. 2006. Effects of mild heat stress and grain challenge on acid-base balance and rumen tissue histology in lambs. Journal of Animal Science 84: 447-455.
Pereira, F.T.; Braga, F.C.; Burioli, K.C.; Kafoury, J.R.; Oliveira, L.J.; Papa, P.C.; Carvalho, A.F.; Ambrósio, C.E.; Bazer, F.W.; Miglino, M.A. 2010. Transplacental transfer of iron in the water buffalo (Bubalus bubalis): uteroferrin and Erythrophagocytosis. Reproduction in Domestic Animals 45: 907-914.
Perkins, T.L.; Green, R.D.; Hamlin, K.E. 1992. Evaluation of ultrasonic estimates of carcass fat thickness and longissimus muscle area in beef cattle. Journal Animal Science 70: 1002-1010.
Resende Júnior, J.C.; Alonso, L.S.; Pereira, M.N.; Magallanes, M.G.R.; Duboc, M.V.; Oliveira, E.C.; Melo, L.Q. 2006. Effect of the feeding pattern on rumen wall morphology of cows and sheep. Brazilian Journal of Veterinary Research and Animal Science 43: 526-536.
Robinson, P.H.; McQueen, R.E. 1994. Influence of supplemental protein source and feeding frequency on rumen fermentation and performance in dairy cows. Journal of Dairy Science 77: 1340-1353.
Robles, V.; González, L.A.; Ferret, A.; Manteca, X.; Calsamiglia, S. 2007. Effects of feeding frequency on intake, ruminal fermentation, and feeding behavior in heifers fed high-concentrate diets. Journal of Animal Science 85: 2538-2547. Schwartzkopf-Genswein, K.S.; Beauchemin, K.A.; Shah, M.A.
2011. Relationship between feeding behavior and performance of feedlot steers fed barley-based diets. Journal of Animal Science 89: 1180-1192.
Sniffen, C.J.; Robinson, P.H. 1984. Nutritional strategy. Journal of Animal Science 64: 529-542.
Soto-Navarro, S.A.; Krehbiel, C.R.; Duff, G.C.; Galyean, M.L.; Brown, M.S.; Steiner, R.L. 2000. Influence of feed intake fluctuation and frequency of feeding on nutrient of digestion, digesta kinetics, and ruminal fermentation profiles in limit-fed steers. Journal of Animal Science 78: 2215-2222.
Stock, R.; Klopfenstein, T.; Brink, D.; Lowry, S.; Rock, D.; Abrams, S. 1983. Impact of weighing procedures and variation in protein degradation rate on measured performance of growing lambs and cattle. Journal of Animal Science 57: 1276-1285.
Van Soest, P.J.; Robertson, J.B.; Lewis, B.A. 1991. Symposium: carbohydrate methodology, metabolism, and nutritional implications in dairy cattle. Methods for dietary fiber, neutral detergent fiber, and non-starch polysaccharides in relation to animal nutrition. Journal of Animal Science 74: 3583-3597. Yang, C.M.J.; Varga, G.A. 1989. Effect of three concentrate feeding