Nauplius
THE JOURNAL OF THE BRAZILIAN CRUSTACEAN SOCIETY
e-ISSN 2358-2936
www.scielo.br/nau www.crustacea.org.br
Population size of
Aegla longirostri
Bond-Buckup and Bond-Buckup, 1994 (Crustacea,
Decapoda, Anomura): comparison
of methods with the mark-recapture
technique in closed population
Joele S. Baumart
1Gláucia B. Cogo
1Fidel E.C. Morales
2Sandro Santos
11Programa de Pós-graduação em Biodiversidade Animal, Prédio 17, Universidade Federal de Santa Maria. Avenida Roraima, 1000 – Bairro Camobi. 97105-900 Santa Maria, RS, Brazil.
JSB E-mail: [email protected]
GBC E-mail: [email protected]
SS E-mail: [email protected]
2Universidade Federal do Rio Grande do Norte, Centro de Ciências Exatas, Departamento de Estatística. Campus Universitário Lagoa Nova – Lagoa Nova. 59078-970 Natal, RN, Brazil.
FECM E-mail: [email protected]
ZOOBANK:
http://zoobank.org/urn:lsid:zoobank.org:pub:C79A7C58-9F2E-47F0-A508-B475D031B565
ABSTRACT
The aim of this study is to estimate the population size of Aegla longirostri Bond-Buckup and Buckup, 1994 in a subtropical low-order stream using the mark-recapture technique. We also tested if the Bayesian model is a promising estimator of population size. Data were collected in two periods, in spring 2010 (seven-day sampling) and in fall 2011(five-day sampling). The animals were sexed, measured, marked in the field, and released in the same spots from which they were collected. During the study period, 445 adults were captured (343 in the spring and 102 in the fall). The estimated population size was 1,005–1,028.8 individuals in the spring and 234–236 in the fall, according to the Schumacher-Eschmeyer and Schnabel methods,
All content of the journal, except where identified, is licensed under a Creative Commons attribution-type BY.
orcid.org/0000-0002-2453-6657
ORIGINAL ARTICLE offered by the Brazilian Crustacean Society
in honorto Ludwig Buckup in recognition of his dedication and contributions to the development of Carcinology
CORRESPONDING AUTHOR
Joele S. Baumart
SUBMITTED 03 October 2017
ACCEPTED 09 May 2018
PUBLISHED 02 August 2018
Guest Editors
Alessandra Angélica de Pádua Bueno and Sandro Santos
DOI 10.1590/2358-2936e2018016
respectively. The estimated population size using the Bayesian analysis was 950.13 individuals in the spring and 210.08 in the fall. Although the Bayesian model is a more conservative approach, all methods showed similar and relevant estimations of population size.
KEY WORDS
Bayesian analysis, conservation status, population density, Schnabel, Schumacher-Eschmeyer.
INTRODUCTION
Estimating a population size is useful to indicate the population viability (Tobias and Seddon 2002; Knaepkens et al., 2004; Parra et al., 2006). One of the first methods to estimate a population size, and maybe the most common, was based on the mark-recapture technique and was developed by Carl Petersen (1896). Different estimators of population size were further explored to establish models that bring more reliability to the studies (Buckland et al., 2000). Currently, there are three approaches to estimate population size using the mark-recapture technique based on samples of the population. The first approach is the classical method using wide and reputable estimators. The Petersen method considers only one episode of capture and recapture of individuals from the target population (Petersen, 1896). The Schnabel method considers more than one capture and recapture event (Schnabel, 1938). The Schumacher-Eschmeyer method uses linear regression techniques to estimate a population size (Schumacher and Eschmeyer, 1943). All these methods are applied to closed populations. These estimators are considered the most accurate methods because they ignore population variability, such as migration and recruitment, so the quantification would be applied to a theoretically stable population. On the other hand, Jolly (1965) and Seber (1965) developed a method that can be applied to open populations, in which migration and birth events could possibly occur.
The second approach is the Bayesian model applied to mark-recapture events (Castledine, 1981). In the Bayesian model, the probability of any event, phenomenon, proposition, or hypothesis occur, is defined by the quantification of the possibility of the marked individual being recaptured again (Lee et al., 2003). When using the Bayesian model, the researcher can incorporate a prioridata into the model, improving the population size estimates (Leite et al., 2000; Kinas
and Andrade, 2007; Paula et al., 2009a). The third approach is related to the application of log-linear models to incomplete contingency tables (Paula et al., 2009b). Besides verifying the population viability, population size estimates are important to check the population conservation status. The population size is one of the criteria used by the International Union for Conservation of Nature – IUCN (Criteria A: population reduction; concept: population and population size) to indicate the extinction risk of a species. Most studies classifying the Aeglidae species into the IUCN categories have used only geographic data (criteria B: geographical distribution; concept: area of occupation and extension of occurrence) due to the lack of other data (Bond-Buckup et al., 2008; Pérez-Losada et al., 2009; Santos et al., 2012; 2013; Bueno et al. 2016).
mark-recapture technique. We also tested if the Poisson-Gamma Bayesian mathematical model is a promising estimator of population size in mark-recapture samples of closed populations. These tests were chosen due to their robustness and because other estimations of aeglids population size have been performed using the Schumacher-Eschmeyer and Schnabel estimators (Bueno et al., 2007; 2014; Cohen et al., 2013), which facilitate comparisons. The Bayesian model was chosen because it has mainly been applied to marine and terrestrial environments rather than freshwater environments and has never been used for estimating crustacean populations.
MATERIAL AND METHODS
The study area is covered by a transition forest inserted between the Rain Forest and the Pampa biomes. The area is located in the central region of Rio Grande do Sul state, Brazil, characterized by a humid tropical climate – Cfa type – according to Köppen’s classification (Peel et al., 2007). The annual mean temperature is 19.1°C and the annual mean rainfall is 1,712.4 mm equally distributed throughout the year (Heldwein et al., 2009). The study was carried out in a 160-meter long section of a first-order stream from the Jacuí River hydrographic basin (Caranguejo creek;
29º38’21”S 53º32’02”W). The stream has a riparian
vegetation and is characterizes by the presence of pool and riffle sites; the substrate is mostly rocky with leaf litter and sediment deposits (especially in the pools). The anomurans were captured using 15 non-baited covo traps (50 x 20 x 10 cm) randomly placed along the section, including both pool and riffle sites. All traps were submerged, either placed at the bottom of the river or kept suspended in the water column. To ensure that all moving animals were captured, either those crawling (bottom-of-the-fly) or swimming (tail-flipping), we kept as many traps as possible. It is worth mentioning that preliminary observations indicated that the number of animals caught with non-baited traps was similar to that of non-baited traps. A 4-mm mesh net was fixed at each extremity of the section to prevent migration of the individuals, which is one of the premises to using estimators of population size (Bueno et al., 2007).
Two periods of capture, marking, and recapture were performed, one in the spring (October 2010: seven-day sampling) and one in the fall (April 2011: five-day sampling). These periods were chosen due to mild environmental conditions, which ensure a greater activity of the crustaceans. During this period, the animals leave their refuges more often to forage or mate (Colpo et al., 2005). Daily, in the morning, the captured individuals were recorded and marked with non-toxic colored ink; all animals were sexed and had the cephalothorax length measured (from the rostrum until the posterior edge of the carapace). All captures and recaptures were recorded; animals that had already been marked were not remarked. After this procedure, all individuals were released into the stream at the same location they were captured.
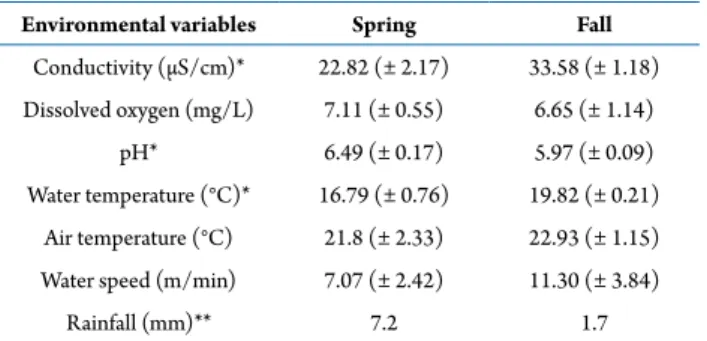
During the field studies, water temperature at the sampling site, pH, dissolved oxygen, conductivity, and water flow velocity were daily taken (Tab. 1). A one-way ANOVA was performed to verify statistical differences between the seasons.
A proportion analysis was performed with the capture-recapture data from each sampling day to verify if the assumptions for classical analyses of population size were met. This proportion (pr) was obtained by dividing the number of recaptured animals (Rt) by the number of captured animals (Ct) on the same day (pr = Rt/Ct). The Schnabel, the Schumacher-Eschmeyer, and the Bayesian estimators were employed to estimate the population size of A. longirostri. Juveniles were identified according to characteristics described by Colpo et al. (2005) and excluded from the analyses. Juveniles are part of a
Environmental variables Spring Fall
Conductivity (µS/cm)* 22.82 (± 2.17) 33.58 (± 1.18)
Dissolved oxygen (mg/L) 7.11 (± 0.55) 6.65 (± 1.14)
pH* 6.49 (± 0.17) 5.97 (± 0.09)
Water temperature (°C)* 16.79 (± 0.76) 19.82 (± 0.21)
Air temperature (°C) 21.8 (± 2.33) 22.93 (± 1.15)
Water speed (m/min) 7.07 (± 2.42) 11.30 (± 3.84)
Rainfall (mm)** 7.2 1.7
plot called population recruitment; they may or may not remain in the current population, being the main agents in the dispersion episodes. Since the aim of the study is to verify the population size, the estimator’s premises require that only adult individuals be used. The density of individuals per square meter (ind.m-2)
was calculated. For this, the estimates obtained with the classical and the Bayesian analyses were considered, as well as the width and length of the studied stream section.
The classical analyses were performed in the Krebs software, version 5.2 (1998). The Poisson-Gamma Bayesian model was performed in the R statistical computing environment. For the Bayesian analyses, the Monte Carlo Markov Chain (MCMC) methods were used to obtain samples from a posteriori joint distribution. These chains were generated by the Gibbs Sampling and Metropolis-Hastings algorithms (see Leite et al., 2000; Robert and Casella, 2004; Gameran and Lopes, 2006; Kinas and Andrade, 2007). In obtaining the posterior distribution of parameters, 100,000 samples were generated, from which the first 50,000 were discarded (heating period). The remaining 50,000 samples in 10 out of 10 samples were selected, resulting in a total of 5,000 samples from the posterior distribution.
RESULTS
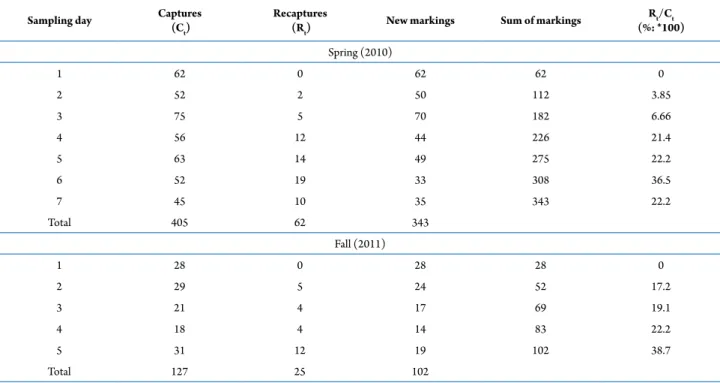
During the study period, 445 adults were captured, 343 in the spring and 102 in the fall. A total of 87 individuals were recaptured, 62 in the spring and 25 in the fall. The proportion of recapture ranged from 3.85 to 36.5% in the spring and from 17.2 to 38.7% in the fall (Tab. 2). Of a total of 343 adults captured in the spring, 217 were males (63.3%) and 126 were females (36.7%). In the fall, 58 males (56.9%) and 44 females (43.1%) were captured (Fig. 1).
Depending on which classic estimator was used there was a variation in the population size between the two periods. The estimations of the population size were 1,028.8 to 1,005 individuals in the spring and 236 to 234 in the fall, according to the Schnabel and Schumacher-Eschmeyer methods, respectively (Tab. 3). According to the Bayesian model, the population average sizes also variated between the two sampling seasons. Population size was estimated in 950.13 individuals in the spring and 210.08 in the fall (Tab. 3).
Population density (ind.m-2) was estimated with
the classic population size estimators (Schnabel and Schumacher-Eschmeyer) and the Bayesian model. The mean densities of adults in the study area were 9.75 ind.m-2 in the spring and 2.25 ind.m-2 in the
fall according to the Schnabel and
Schumacher-Sampling day Captures (Ct)
Recaptures
(Rt) New markings Sum of markings
Rt/Ct (%: *100)
Spring (2010)
1 62 0 62 62 0
2 52 2 50 112 3.85
3 75 5 70 182 6.66
4 56 12 44 226 21.4
5 63 14 49 275 22.2
6 52 19 33 308 36.5
7 45 10 35 343 22.2
Total 405 62 343
Fall (2011)
1 28 0 28 28 0
2 29 5 24 52 17.2
3 21 4 17 69 19.1
4 18 4 14 83 22.2
5 31 12 19 102 38.7
Total 127 25 102
Eschmeyer estimators. The population densities estimated with the Bayesian model were 9.11 ind.m-2
in the spring and 2.01 ind.m-2 in the fall (Tab. 3).
DISCUSSION
We estimated the population size of A. longirostri using different methods and found a similar result in both classical and Bayesian analyses. Moreover,
the proposed Bayesian model has been proven to be suitable for small sample sizes. In the classical analyses, the denominator is the sum of recaptures and the numerator is the multiplication of the number of captured animals by the number of animals already marked (Krebs, 1999; Gotelli and Ellison, 2011). Thus, the capture of a large number of individuals coupled with a low recapture rate tends to be associated with a large population size. By directly calculating the population size, the classic estimates result in higher
Figure 1. Size-class distribution (%) of Aegla longirostri Bond-Buckup and Buckup, 1994 sampled in spring 2010 and in fall 2011.
Analysis Population size (C. I.) Density (ind/m2)
Spring Fall Spring Fall
Schnabel 1028.8 (787.9 to 1482.2) 236.0 (163.8 to 351.9) 9.87 2.26
Schumacher-Eschmeyer 1005 (771 to 1445) 234 (175 to 351) 9.64 2.24
Bayesian 950.13 (777 to 1159) 210.08 (162 to 276) 9.11 2.01
values than the Bayesian model. However, there is a clear overlap of the confidence intervals and similarity in population size estimates among the three tested methods. This similarity between methods may be related to the use of an uninformative a priori data. The Bayesian model would be more robust if we could rely on a priori information. This information would be when data are previously incorporated into the equation (Rivot et al., 2004; Lord and Miranda-Moreno, 2007; Musal et al., 2009; Brun et al., 2011), becoming a useful tool for monitoring the fauna. Indeed, when using a priori uninformative datathe test remains strong (Wang et al., 2007), but produces estimations close to the classical tests and still considers the sample numbers in a way that estimations are not biased (Maunder, 2004; Wang et al., 2007). Before choosing an estimate method, it is important to define the focus of the study. If the study involves issues concerning conservation areas and species preservation, the most appropriate approach would be the Bayesian model. Although the Bayesian model is similar to the classical methods, it tends to create more conservative data.
We found different population sizes and densities between the two sampling periods. In the spring, values were higher than the fall. Other studies using the classical analyses also showed fluctuations in population size of aeglids in different seasons. The population of Aegla franca Schmitt, 1942, ranged from 202 to 189 individuals in the summer and from 180 to 167 individuals in the winter (Bueno et al., 2007). A higher population size was observed for Aegla paulensis Schmitt, 1942 in late summer (1,483 individuals) than in late winter (1,088 individuals) (Cohen et al., 2013). The estimated population size of Aegla perobae Hebling and Rodrigues, 1977 ranged from 1,286 individuals in the fall to 123 individuals in the summer and recovered it in the winter with 383 individuals (Bueno et al., 2014). In this study, the population of A. perobae experienced a catastrophic event that significantly altered their population size. For Aegla platensis Schmitt, 1942, the population density ranged from 1.8 ind.m-² in the spring
to 3.83 ind.m-² in the winter, according to Peterson’s
method (Dalosto et al., 2014).
During our survey, there were fluctuations in the population size of A. longirostri depending on the season. Natural fluctuations could be directly related to environmental factors and indirectly related to
population dynamics (Smith et al., 2000; Bas et al., 2009; Bertelsen, 2013; Bueno et al., 2014) or external factors such as anthropic actions (Bond-Buckup et al., 2008; Magris et al., 2010). In regions where seasons are well defined (subtropical or temperate), there is a reduction in the number of animals in the warmer periods. Many streams have severely reduced water flow and increased water temperature during warmer seasons; afterward, the populations are often restored (Bueno and Bond-Buckup, 2000; Colpo et al., 2005). Summer is usually hot and dry in southern Brazil, with low levels of precipitation extending until the middle fall (Britto et al., 2008). In the winter, population size is usually increased since there are higher rainfall and lower temperatures; this is perceived by the larger population size in the spring.
We identified a higher density of males during the spring, indicating that the animals are more active in this season. This period coincides with the breeding period of the species (Colpo et al., 2005) when animals are more prone to find a mating partner. Females were found in lower densities possibly because during the spring they remain sheltered, mainly after mating, to avoid injuring the eggs. Variations in the density of males and females at different seasons were also reported for A. paulensis (cf. Cohen et al., 2011), and for Aegla spinipalma Bond-Buckup and Buckup, 1994 (cf. Zimmer et al., 2002); in which sex-ratio was significantly skewed towards males in some periods and skewed towards females in others. For A. platensis the data are conflicting. Dalosto et al. (2014) found variations in males and females densities, while Bueno and Bond-Buckup (2000) found the same proportion of both sexes throughout the year.
ACKNOWLEDGEMENTS
We thank to Coordenação de Aperfeiçoamento de Pessoal de Nível Superior (CAPES) for the scholarships granted to Joele S. Baumart and Gláucia B. Cogo, and to Conselho Nacional de Desenvolvimento Científico e Tecnológico (CNPq) for a researcher fellowship to Sandro Santos. We also thank to ICMBio (Instituto Chico Mendes de Conservação da Biodiversidade) for collection license number 14180-1 and to our colleagues of the carcinology laboratory for help in the fieldwork.
REFERENCES
Arenas, J. 1974. La Cordillera de la Costa como refugio de la fauna dulcícola preglacial. Archivos de Biologia y Medicina Experimentales, 10: 1–40.
Bas, C.; Luppi, T.; Spivak, E. and Schejter, L. 2009. Larval dispersion of the estuarine crab Neohelice granulata in coastal marine waters of the Southwest Atlantic. Estuarine Coastal and Shelf Science, 83: 569–576.
Bertelsen, R.D. 2013. Characterizing daily movements, nomadic movements, and reproductive migrations of
Panulirus argus around the Western Sambo Ecological
Reserve (Florida, USA) using acoustic telemetry. Fisheries Research, 144: 91–102.
Bond-Buckup, G. 2008. Biodiversidade dos Campos de Cima da Serra. Porto Alegre, Libretos, 196p.
Bond-Buckup, G.; Jara, C.G.; Pérez-Losada, M.; Buckup, L. and Crandall, K.A. 2008. Global diversity of crabs (Aeglidae: Anomura: Decapoda) in freshwater. Hydrobiologia, 595: 267–273.
Britto, F.P.; Barletta, R. and Mendonça, M. 2008. Regionalização sazonal e mensal da precipitação pluvial máxima no estado do Rio Grande do Sul. Revista Brasileira de Climatologia, 83–89.
Brun, M.; Abraham, C.; Jarry, M.; Dumas, J.; Lange, F. and Prévost, E. 2011. Estimating an homogeneous series of a population abundance indicator despite changes in data collection procedure: A hierarchical Bayesian modelling approach.
Ecological Modelling, 222: 1069–1079.
Buckland, S.T.; Goudie, I. and Borchers, D.L. 2000. Wildlife population assessment: past developments and future directions. Biometrics, 56: 1–12.
Bueno, A.A.P. and Bond-Buckup, G. 2000. Dinâmica populacional de Aegla platensis Schmitt (Crustacea, Decapoda, Aeglidae).
Revista brasileira de Zoologia, 17: 43–49.
Bueno, S.L.S.; Camargo, A.L. and Moraes, J.C.B. 2017. A new species of stygobitic aeglids from lentic subterranean waters in southeastern Brazil, with an unusual morphological trait: short pleopods in adult males. Nauplius, 25: e201700021.
Bueno, S.L.S.; Santos, S.; Rocha, S.S.; Gomes, K.M.; Mossolin, E.C. and Mantelatto, F.L. 2016. Avaliação dos Eglídeos (Decapoda: Aeglidae). Cap. 2. p. 35–63. In: M. Pinheiro and H. Boos (orgs), Livro Vermelho dos Crustáceos do Brasil: Avaliação 2010-2014. Porto Alegre, Sociedade Brasileira de Carcinologia, 466p.
Bueno, S.L.S.; Shimizu, R.M. and Rocha, S.S. 2007. Estimating the population size of Aegla franca (Decapoda: Anomura: Aeglidae) by mark-recapture technique from an isolated section of Barro Preto stream, county of Claraval, state of Minas Gerais, Southeastern Brazil. Journal of Crustacean Biology, 27: 553–559.
Bueno, S.L.S.; Takano, B.F.; Cohen, F.P.A.; Moraes, J.C.B.; Chiquetto-Machado, P.I.; Vieira, L.C.M. and Shimizu, R.M.
2014. Fluctuations in the population size of the highly endemic
Aegla perobae (Decapoda: Anomura: Aeglidae) caused by a disturbance event. Journal of Crustacean Biology, 34: 165–173.
Cassini, M.H.; Fasola. L; Chehébar, C. and Macdonald, D.W.
2009. Scale-dependent analysis of an otter-crustacean system in Argentinean Patagonia. Naturwissenschaften, 96: 593–599.
Castledine, B.J. 1981. A Bayesian analysis of multiple-recapture sampling for a closed population. Biometrika, 68: 197–210.
Cohen, F.P.A.; Takano, B.F.; Shimizu, R.M. and Bueno, S.L.S.
2011. Life cycle and population structure of Aegla paulensis
(Decapoda: Anomura: Aeglidae). Journal of Crustacean Biology, 31: 389–395.
Cohen, F.P.A.; Takano, B.F.; Shimizu, R.M. and Bueno, S.L.S.
2013. Population size of Aegla paulensis (Decapoda: Anomura: Aeglidae). Latin American Journal of Aquatic Research, 41: 746–752.
Cogo, G.B. and Santos, S. 2013. The role of aeglids in shredding organic matter in neotropical streams. Journal of Crustacean Biology, 33: 519–526.
Colpo, K.D.; Ribeiro, L.O. and Santos, S. 2005. Population biology of the freshwater anomuran Aegla longirostri (Aeglidae) from south Brazilian streams. Journal of Crustacean Biology, 25: 495–499.
Dalosto, M.M.; Palaoro, A.V.; Oliveira, D.; Samuelsson, E. and Santos, S. 2014. Population biology of Aegla platensis
(Decapoda: Anomura: Aeglidae) in a tributary of the Uruguay River, state of Rio Grande do Sul, Brazil. Zoologia, 31: 215–222.
Gameran, D. and Lopes, H.F. 2006. Markov Chain Monte Carlo: Stochastic simulation for Bayesian inference.2nd ed. Boca Raton,
Chapman & Hall/CRC, 344p.
Gotelli, N.J. and Ellison, A.M. 2011. A Primer of Ecological Statistics. 1st ed. Sunderland, Sinauer Associates, Inc., 492p
Heldwein, A.B.; Buriol, G.A. and Streck, N.A. 2009. O clima de Santa Maria. Ciência e Ambiente, 38: 43–58.
Jolly, G.M. 1965. Explicit estimates from capture-recapture data with both death and immigration-stochastic model.
Biometrika, 52: 225–247.
Kinas, P.G. and Andrade, H.A. 2007. Bayesian statistics for fishery stock assessment and management: a synthesis. Pan-American Journal of Aquatic Sciences, 2: 103–112.
Knaepkens, G.; Bervoets, L.; Verheyen, E. and Eens, M. 2004. Relationship between population size and genetic diversity in endangered populations of the European bullhead (Cottus gobio): implications for conservation. Biological Conservation, 115: 403–410.
Krebs, C.J. 1999. Ecological Methodology. 2nd ed. New York,
Benjamin-Cummings, 620p.
Leite, J.G.; Rodrigues, J. and Milan, L.A. 2000. A Bayesian analysis for estimating the number of species in a population using nonhomogeneous Poisson process. Statistics & Probability Letters, 48: 153–161.
Lord, D. and Miranda-Moreno, L.F. 2007. Effects of low sample mean values and small sample size on the estimation of the fixed dispersion parameter of Poisson-gamma models for modeling motor vehicle crashes: a Bayesian perspective.
Safety Science, 46: 751–770.
Magris, R.A.; Bond-Buckup, G.; Magalhães, C.; Mantelatto, F.L.; Reid, J.W. and Loureiro, L.M.A.E.; Coelho, P.A; Santana, W.; Buckup, L.; Rocha, S.S.; Bueno, S.L.S.; Pinheiro, M.M.A.; D’Incao, F.; Ivo, C.T.C.; Neto, J.D.; Rodrigues, E.S.; Araujo, P.B.; Boos-Junior, H. and Duarte, L.F.A. 2010. Quantification of extinction risk for crustacean species: an overview of the National Red Listing process in Brazil.
Nauplius, 18: 129–135.
Maunder, M.N. 2004. Population viability analysis based on combining Bayesian, integrated, and hierarchical analyses.
Acta Oecologica, 26: 85–94.
Moraes, J.C.B.; Tavares, M. and Bueno, S.L.S. 2017. Taxonomic review of Aegla marginata Bond-Buckup & Buckup, 1994 (Decapoda, Anomura, Aeglidae) with description of a new species. Zootaxa, 4323: 519–533.
Moraes, J.C.B.; Terossi, M.; Buranelli, R.C.; Tavares, M.; Mantelatto, F.L. and Bueno, S.L.S. 2016. Morphological and molecular data reveal the cryptic diversity among populations of Aegla paulensis (Decapoda, Anomura, Aeglidae), with descriptions of four new species and comments on dispersal routes and conservation status. Zootaxa, 4193: 1–48.
Musal, R.M.; Soyer, R.; McCabe, C. and Kharroubi, S.A. 2012. Estimating the population utility function: A parametric Bayesian approach. European Journal of Operational Research, 218: 538–547.
Parra, G.J.; Corkeron, P.J. and Marsh, H. 2006. Population sizes, site fidelity and residence patterns of Australian snubfin and Indo-Pacific humpback dolphins: Implications for conservation. Biological Conservation, 129: 167–180.
Paula, M.; Almeida, G.O. and Guedes, A.C.S. 2009a. O uso das distribuições Poisson e Gama na estimação do tamanho populacional animal via modelo Bayesiano. Revista Científica da UFPA, 7: 1–17.
Paula, M.; Diniz, C.A.R. and Leite, J.G. 2009b. Modelo Bayesiano hierárquico de captura-recaptura com distribuição Poisson-Gama. Trends in Applied and Computational Mathematics, 10: 191–202.
Peel, M.C.; Finlayson, B.L. and McMahon, T.A. 2007. Updated world map of the Köppen-Geiger climate classification.
Hydrology and Earth System Sciences, 11: 1633–1644.
Pérez-Losada, M.; Bond-Buckup, G.; Jara, C.G. and Crandall, K.A.
2009. Conservation assessment of southern South American freshwater ecoregions on the basis of the distribution and genetic diversity of crabs from the genus Aegla.Conservation Biology, 23: 692–702.
Petersen, C.G.J. 1896. The yearly immigration of young plaice into the limfjord from the German Sea. Report of the Danish Biological Station, 6: 5–84.
Rivot, E.; Prévost, E.; Parent, E. and Baglinière, J.L. 2004. A Bayesian state-space modelling framework for fitting a salmon stage-structured population dynamic model to multiple time series of field data. Ecological Modelling, 179: 463–485.
Robert, C.P. and Casella, G. 2004. Monte Carlo Statistical Methods. 2nd ed. New York, Springer-Verlag, 649p.
Santos, S.; Ayres-Peres, L.; Cardoso, R.C.F. and Sokolowicz, C.C.
2008. Natural diet of the freshwater anomuran Aegla longirostri
(Crustacea, Anomura, Aeglidae). Journal of Natural History, 42: 1027–1037.
Santos, S.; Bond-Buckup, G.; Buckup, L.; Pérez-Losada, M.; Finley, M. and Crandall, K.A. 2012. Three new species of
Aegla (Anomura) freshwater crabs from the upper Uruguay River Hydrographic Basin in Brazil. Journal of Crustacean Biology, 32: 529–540.
Santos, S.; Bond-Buckup, G.; Gonçalves, A.S.; Bartholomei-Santos, M.L.; Buckup, L. and Jara, C.G. 2017. Diversity and conservation status of Aegla spp. (Anomura, Aeglidae): an update. Nauplius, 25: e2017011.
Santos, S.; Jara, C.G.; Bartholomei-Santos, M.L.; Pérez-Losada, M. and Crandall, K.A. 2013. New species and records of the genus Aegla Leach, 1982 (Crustacea, Anomura, Aeglidae) from the West-Central region of Rio Grande do Sul, Brazil.
Nauplius, 21: 211–223.
Savaris, M.; Lampert, S.; Trevisan, A. and Masunari, S. 2012. Opportunistic predation of fish by anomuran crabs (Crustacea, Anomura, Aeglidae) in rivers of southern Brazil.
Biota Neotropica, 12: 249–251.
Schnabel, Z.E. 1938. The estimation of total fish populations of a lake. The American Mathematical Monthly, 45: 348–352.
Schumacher, F.X. and Eschmeyer, R.W. 1943. The estimation of fish populations in lakes and ponds. Journal of the Tennessee Academy of Science, 18: 228–249.
Seber, G.A.F. 1965. A note on the multiple recapture census.
Biometrika, 52: 249–259.
Smith, I.P.; Collins, K.J. and Jensen, A.C. 2000. Digital electromagnetic telemetry system for studying behavior of decapod crustaceans. Journal of Experimental Marine Biology and Ecology, 247: 209–222.
Tobias, J.A. and Seddon, N. 2002. Estimating population size in the subdesert mesite (Monias benschi): new methods and implications for conservation. Biological Conservation, 108: 199–212.
Wang, X.; He, C.Z. and Sun, D. 2007. Bayesian population estimation for small sample capture-recapture data using noninformative priors. Journal of Statistical Planning and Inference, 137: 1099–1118.