Licença
Rev Bras
Cineantropom
Hum
DOI: http://dx.doi.org/10.5007/1980-0037.2018v20n3p247
original article
Timed up and go test and self-perceived health
in elderly: population-based study
Teste TUG e saúde autopercebida em idosos: estudo de
base populacional
Rosilene Andrade Silva Rodrigues1,2,3
Margarete Marques Teodózio3
Mariano Martínez Espinosa4
Waléria Christiane Rezende Fett5
Claudia Duarte Melo3
Carlos Alexandre Fett1,2,5
Abstract –Due to the aging process, chronic diseases arise with increased use of medica-tions and there is a need to evaluate the elderly to prevent functional dependence and falls. The aim of this study was to compare gender, sociodemographic characteristics, fall occurrences, self-reported diseases, quantity of drugs with timed up and go test (TUG) and TUG-cognitive, and to associate these factors with the self-perception of health of the elderly in the community. Were selected 513 elderly people, with 384 that completed the TUG test to evaluate the functional capacity. There was difference between the female and male, in the variables: age-group 70 to 79 years (p=0.036) ≥ 80 years (p=0.013); per capita income in the female ≤ 1 minimum wage (p=0.005) and >2 (p=0.013), falls (p=0.001), systemic hypertension (p<0.001), arthritis or rheumatism (p=0.033), depression (p=0.048), osteoporosis (p<0.001), medications 3 to 4 (p=0.008), self-perceived health (p=0.030) and in the TUG (p<0.001) and TUG-cognitive (p=0.002). The prevalence by Poisson regression Robust (RPa), the variables associated with health self-perceived: heart disease (p=0,047), stroke (p=<0,001), osteoporosis (p=0,013) and TUG motor (p=0,028). Women had more health problems, weakness and poor physical performance, indicating the need for special attention as the aging aspects. So, TUG test can be useful tool for risk evaluate of falls in the elderly living in the community.
Key words: Accidental falls; Aging; Chronic diseases; Frail elderly; Physical fitness.
Resumo – Devido ao processo envelhecimento, surgem as doenças crônicas com aumento de uso de medicamentos e existe necessidade de avaliar os idosos para prevenir dependência funcional e quedas. O objetivo deste estudo foi comparar as pessoas idosas por gênero, variáveis socioe-conômicas, ocorrências de quedas, doenças autorrelatadas, quantidade de medicamentos, saúde autopercebida e teste Timed Up and Go (TUG). Foram selecionadas 513 pessoas idosas, com 384 que completaram o teste TUG para avaliar a capacidade funcional. Existia diferença entre gênero feminino e o masculino, nas variáveis: grupo etário de 70 a 79 anos (p=0,036) ≥ 80 anos (p=0,013); renda per capita no salário mínimo ≤ 1 feminino (p=0,005) e> 2 (p=0,013), quedas (p= 0,001), hipertensão sistêmica (p<0,001), artrite ou reumatismo (p=0,048), osteoporose (p <0,001), medicamentos de 3 a 4 (p=0,008), autopercepção de saúde (p=0,030) e no TUG (p<0,001) e TUG-cognitivo (p=0,002). A prevalência por regressão de Poisson robusta (RPa), as variáveis associadas à saúde autopercebida: doença cardíaca (p=0,047), acidente vascular cerebral (p=0,001), osteoporose (p=0,013) e motor TUG (p=0,028). As mulheres tiveram mais problemas de saúde, fraqueza e desempenho físico fraco, indicando a necessidade de atenção especial aos aspectos do envelhecimento. Assim, o teste TUG pode ser uma ferramenta útil para avaliar o risco de quedas nos idosos que vivem na comunidade.
Palavras-chave: Acidentes por quedas; Aptidão física; Doenças crônicas; Envelhecimento;
1 Universidade Federal de Mato Grosso. Programa de Pós-graduação da Faculdade de Ciências da Saúde da Faculdade de Medicina. Cuiabá, MT. Brasil.
2 Universidade Federal de Mato Grosso. Núcleo de aptidão física, informática, metabolismo esporte e saúde. Cuiabá, MT. Brasil.
3 Secretaria de Estado da Saúde de Mato Grosso. Cuiabá, MT. Brasil.
4 Universidade Federal de Mato Grosso. Departamento de Estatística do Instituto de Ciências Exatas e da Terra e Instituto de Saúde Coletiva. Cuiabá, MT. Brasil.
5 Universidade Federal de Mato Grosso. Programa de Pós-graduação da Faculdade Educação Física. Cuia-bá, MT. Brasil.
INTRODUCTION
With advancing age, the number of chronic diseases increases1 and
conse-quently thus more use of medications in elderly population2. Thus, elderly
people self-report illness a there is high percentage of poor and very poor health3. This population also presents functional losses that diminish
or preclude the performance of daily activities3. Therefore is essential to
evaluate the functional capacity of elderly4, people, aiming to improve the
quality of life and prevent possible diseases and falls5.
The Timed Up and Go (TUG) test has been used for this evaluation6, it
provides information on the functional capacity of the older adults. In addition to evaluating the mobility, the balance, transferring the position from sitting to standing, stability in walking, and gait speed or with higher risk of falls elderly people, as this involves posture, agility, and dynamic balance6,7. The
TUG value up to 10 seconds is considered normal, from 10.01 to 20 seconds with compromised performance and over 20.01 seconds with higher risk of falls elderly7. In the study by Bohannon et al7, the TUG test measurement
was stratified into three age groups as follows: 60-69 years with normative values of 8.1 (7.1-9.0) seconds, 70-79 years, with values of 9.2 (9.8-10.0) sec-onds, and 80-89 years with 11.3 (10.2-12.7) seconds. The TUG cognitive8
that evaluates verbal fluency and verifies the cognitive capacity combined with the motor demand related to the performance of elderly people.
However, only the TUG test as a single tool should not be considered to evaluate the elderly at high risk of falls9 and it is necessary to know the
health self-perception10 and the diseases self-reported by the elderly11. In
addition, it is described a higher life expectancy for women12 and these
will more often to the health service13. As for men, they have higher rates
of physical performance capacity and less frequent the health service13.
Moreover, it is not known how this health by of both genders, the functional capacity of mobility and balance and its impacts on self-perceived health of the elderly of this community. Still, this is the first population-based study with sample selection by probabilistic distribution and by draw of households maps provided by IBGE14. So, through information gathered
will allows public policy subsidies for aging.
The chronic disease may correlate with functional disability in the elderly institutionalized15 or of the community4. However, it is not known
that functional disability with samples in the general population of elderly living in this community associates poor reports of self-perceived health. In this way, knowing this health profile could propose preventive measures that delay the appearance of risk factors (e.g. falls) that lead to the reduction of the autonomy of the older adults. So, the study did a TUG test6,7 and not only
self-report by questionnaires to know the state of functionality of the elderly3 .
METHODOLOGICAL PROCEDURES
Study design and population
This was a cross-sectional, population-based study carried out with elderly patients 65 years of age or over, of both sexes, living in the urban area. In maps provided by IBGE14, the court and streets whose homes were visited
were identified, counted and drawn, with additional and proportional num-ber selection of court. Thus, we identified 15 census tracts with density of elderly people representative of the population of Cuiabá city, counted and drawn the court and streets whose homes were visited by the interviewers.
The study was approved No. 632/09 (Resolution 466/12 of the National Health Council) by the Research Ethics Committee of the Júlio Muller University Hospital of the Federal University of Mato Grosso (UFMT). The sample size (n) was first determined through the method of simple random sampling.
Inclusion and exclusion
Were included all elderly people who had signed the Informed Consent Form and who achieved a score in the Mini Mental State Examination (MMSE)16
equal or above of 19 points. Were excluded: the wheelchairs or bedridden, presented serious stroke sequelae, had Parkinson’s disease in advanced stages, were suffering any terminal illness, or who had cancer in general, except for skin cancer, who did not perform the TUG or TUG-cognitive.
Dependent and independent variables
In this study two dependent variables were considered: gender (male and female) and self-perception of health: (bad and very bad) and (very good/ good and regular). The independent variables were: age (in years); age group (in years) categorized in years in (60 to 69 years and 80 years or +); resides alone (not yes); schooling (illiterate, 1 to 4 years and 5 years or +); income (≤ 1 SM, 1 <x ≤ 2 SM and did not respond); occurrence of falls (no, yes); cardiopathies (no, yes); systemic hypertension (SH) (not, yes); stroke (no, yes); diabetes mellitus (no, yes); tumor-cancer (not, yes); arthritis, rheu-matism (no, yes); lung disease (no, yes); depression (no, yes); osteoporosis (not yes); quantity of drugs (5 or more, 3 to 4, 1 to 2 and none); TUG and TUG-cognitive (in seconds) categorized (≤10 seconds and >10 seconds).
Data collection
All the elderly was recruited from census tracts where of the households were drawn according to IBGE14 census tract maps. The first stage being the
home visits to apply the interview forms related to the sociodemographic14,
to take the materials to the data collection site.
Was used to evaluate the economic conditions of the older adults based on monthly per capita income. To evaluate education, the number of complete years of study was considered and classified according to the criteria of the Brazilian Association of Research Companies (ABEP) as: illiterate, adult literacy, elementary, scientific, higher, postgraduate. Regarding comorbidities, the existence of self-reported illnesses10 in the
previous year were inquired about, including:SH, diabetes mellitus (DM), heart disease, stroke, tumor, cancer, arthritis, rheumatism, lung disease, depression, and osteoporosis.
Physical evaluation
The TUG test was used: a tape measure straight line for 3 meters marked on the ground, a chair approximately 46 cm in height, with arms at 65 cm in height and a stopwatch. The elderly was instructed to use normal footwear, walking cane or another accessory. In TUG motor, could not to talk in the test and TUG cognitive should to talk during the test the names of animals8,
after the verbal command “go”, and the time was measured in seconds7.
The cut-off point for TUG-motor and TUG-cognitive was value up to 10 seconds is considered normal, from 10.01 to 20 seconds with compromised performance and over 20.01 seconds with higher risk of falls elderly7.
Statistical analysis
The internal consistency of the data was tested with Cronbach’s alpha co-efficient and was found to be adequate (α>0.60)17. For the comparison of
data of the continuous variables by gender the unpaired Student’s t-test was used, and the z-test for normal distribution and in the categorical variables the crude prevalence ratio (RPc) with its confidence interval (95% CI) and the chi-squared test (X²) of Pearson. Associations were made between the outcome (self-perception of health) and the independent variables. Then, the variables that showed association with values of p <0.20 (chi-squared test) were selected to compose the multiple Poisson regression model (RPa)18.
In the final model, only those with p-value <0.05 remained. Note that in all associations the reference category was first in all variables considered.
RESULTS
Study participants were 384 elderly people aged 65 years or older, with 244 being female mean age was 72.41±6.30 years and 140 elderly males with 72.06±5.34 years. Shows that there were statistically significant dif-ferences, between the female and male groups of older adults in relation to the variables occurrences of falls (p=0.001), systemic hypertension
(p<0.001), arthritis and rheumatism (p=0.033), depression (p=0.048),
osteoporosis (p<0.001), the amount of medication, in the 5 or more
medi-cations (p=0.001) and 3 to 4 medications (p=0.008) and categories, and
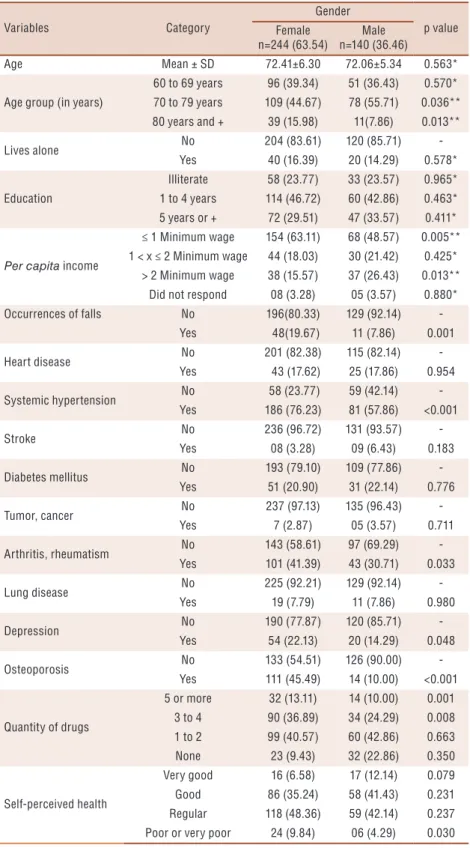
Table 1. Comparison between gender by socioeconomic characteristics, occurrence of falls, self-reported diseases, quantity of drugs and self-perception health of the elderly in the community.
Variables Category
Gender
p value Female
n=244 (63.54)
Male n=140 (36.46)
Age Mean ± SD 72.41±6.30 72.06±5.34 0.563*
Age group (in years)
60 to 69 years 96 (39.34) 51 (36.43) 0.570* 70 to 79 years 109 (44.67) 78 (55.71) 0.036** 80 years and + 39 (15.98) 11(7.86) 0.013**
Lives alone No 204 (83.61) 120 (85.71)
-Yes 40 (16.39) 20 (14.29) 0.578*
Education
Illiterate 58 (23.77) 33 (23.57) 0.965* 1 to 4 years 114 (46.72) 60 (42.86) 0.463* 5 years or + 72 (29.51) 47 (33.57) 0.411*
Per capita income
≤ 1 Minimum wage 154 (63.11) 68 (48.57) 0.005** 1 < x ≤ 2 Minimum wage 44 (18.03) 30 (21.42) 0.425*
> 2 Minimum wage 38 (15.57) 37 (26.43) 0.013** Did not respond 08 (3.28) 05 (3.57) 0.880* Occurrences of falls No 196(80.33) 129 (92.14)
-Yes 48(19.67) 11 (7.86) 0.001
Heart disease No 201 (82.38) 115 (82.14)
-Yes 43 (17.62) 25 (17.86) 0.954
Systemic hypertension No 58 (23.77) 59 (42.14) -Yes 186 (76.23) 81 (57.86) <0.001
Stroke No 236 (96.72) 131 (93.57)
-Yes 08 (3.28) 09 (6.43) 0.183
Diabetes mellitus No 193 (79.10) 109 (77.86) -Yes 51 (20.90) 31 (22.14) 0.776
Tumor, cancer No 237 (97.13) 135 (96.43)
-Yes 7 (2.87) 05 (3.57) 0.711
Arthritis, rheumatism No 143 (58.61) 97 (69.29) -Yes 101 (41.39) 43 (30.71) 0.033
Lung disease No 225 (92.21) 129 (92.14)
-Yes 19 (7.79) 11 (7.86) 0.980
Depression No 190 (77.87) 120 (85.71)
-Yes 54 (22.13) 20 (14.29) 0.048
Osteoporosis No 133 (54.51) 126 (90.00)
-Yes 111 (45.49) 14 (10.00) <0.001
Quantity of drugs
5 or more 32 (13.11) 14 (10.00) 0.001 3 to 4 90 (36.89) 34 (24.29) 0.008 1 to 2 99 (40.57) 60 (42.86) 0.663 None 23 (9.43) 32 (22.86) 0.350
Self-perceived health
Very good 16 (6.58) 17 (12.14) 0.079 Good 86 (35.24) 58 (41.43) 0.231 Regular 118 (48.36) 59 (42.14) 0.237 Poor or very poor 24 (9.84) 06 (4.29) 0.030
SD: Standard deviation. Numbers in parentheses to the right are the percentages. * p-values considering the unpaired t-test of Student’s t distribution. **: p-values considering the two-proportion z-test for normal distribution.
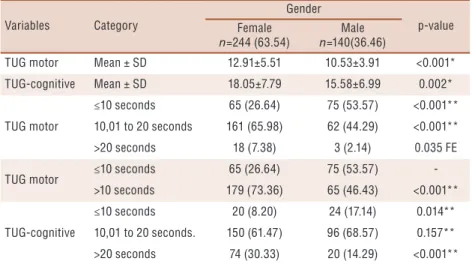
were also compared by gender, categorized in three categories showed statistically significant differences. In comparing the values of normal TUG versus with higher risk of falls performance of the elderly7, there
was statistically significant differences (p<0.001). The TUG-cognitive only
presented statistical significance for the time 10 seconds or less category and for the more than 20 seconds category.
Table 2. Comparison between gender by timed up and go tests (TUG) and TUG-cognitive, of the elderly in the community.
Variables Category
Gender
p-value Female
n=244 (63.54)
Male
n=140(36.46)
TUG motor Mean ± SD 12.91±5.51 10.53±3.91 <0.001*
TUG-cognitive Mean ± SD 18.05±7.79 15.58±6.99 0.002*
TUG motor
≤10 seconds 65 (26.64) 75 (53.57) <0.001** 10,01 to 20 seconds 161 (65.98) 62 (44.29) <0.001**
>20 seconds 18 (7.38) 3 (2.14) 0.035 FE
TUG motor ≤10 seconds 65 (26.64) 75 (53.57) ->10 seconds 179 (73.36) 65 (46.43) <0.001**
TUG-cognitive
≤10 seconds 20 (8.20) 24 (17.14) 0.014** 10,01 to 20 seconds. 150 (61.47) 96 (68.57) 0.157**
>20 seconds 74 (30.33) 20 (14.29) <0.001**
TUG: Timed up and go test. SD: Standard deviation. Values in parentheses to the right are the percentages. * p-values considering the t-test of Student’s t distribution. **: p-values considering the two-proportion z-test for normal distribution. FE: Fisher’s exact test.
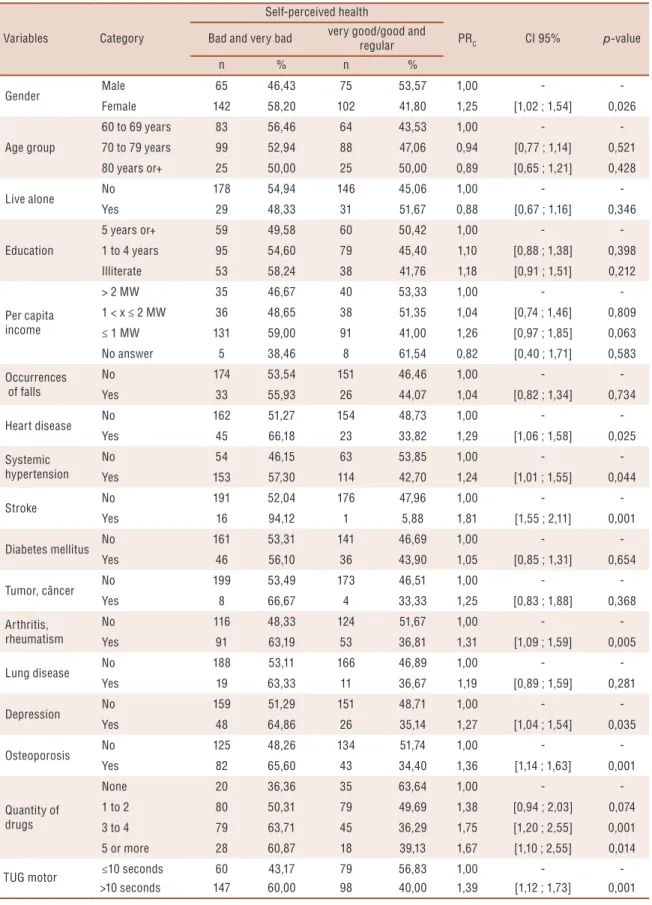
The female, has had 0.25 more prevalence ratio of times (p=0.026) in self-perceived health as poor or very poor. Elderly people with had heart disease (0.29 more times and p=0.025), with hypertension (0.24 more times and p=0.044) in stroke (0.81 more times and p=0.001), rheumatoid arthritis (0.31 times more and p=0.005), with depression (0.27 more times and p=0.035), osteoporosis (0.36 more time and p=0.001), of prevalence ratio in self-perceived health as poor or very poor. As the number of us-ers’ medications 3-4 types (0.75 more times and p=0.001) of prevalence ratio in self-perceived health as poor or very poor. Elderly who made the TUG test >10 seconds (0.39 times more p= 0.001) of prevalence ratio in self-perceived health as poor or very poor (table 3).
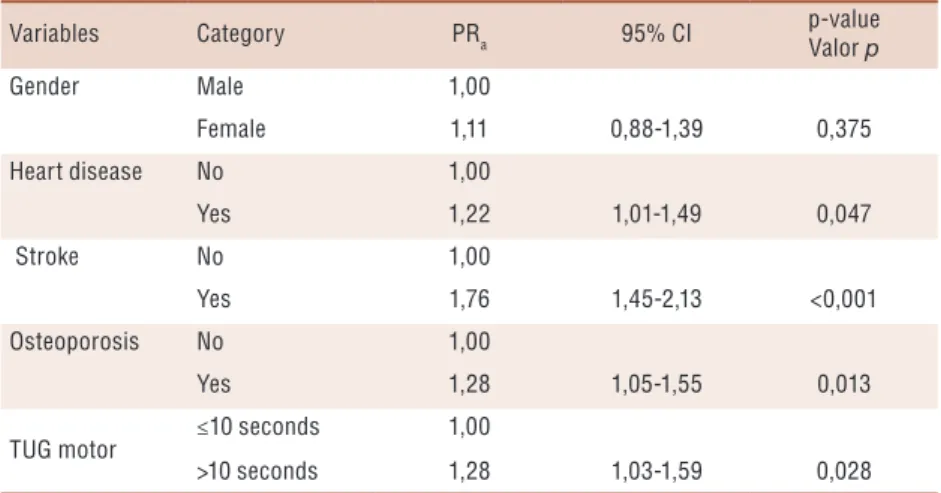
In the multiple regression model only stroke variables, heart disease, osteoporosis and TUG test showed statistical significance. Note that gender variable although not statistically significant in multiple model remained the same as an adjustment variable (table 4).
DISCUSSION
Table 3. Association between the self-perception of health (bad and very bad or very good/good and regular) and sociodemographic factors, occurrences of falls, self-reported diseases, quantity of drugs and time up and go (TUG) test, of the elderly in the community.
Variables Category
Self-perceived health
PRC CI 95% p-value Bad and very bad very good/good and
regular
n % n %
Gender Male 65 46,43 75 53,57 1,00 -
-Female 142 58,20 102 41,80 1,25 [1,02 ; 1,54] 0,026
Age group
60 to 69 years 83 56,46 64 43,53 1,00 -
-70 to 79 years 99 52,94 88 47,06 0,94 [0,77 ; 1,14] 0,521 80 years or+ 25 50,00 25 50,00 0,89 [0,65 ; 1,21] 0,428
Live alone No 178 54,94 146 45,06 1,00 -
-Yes 29 48,33 31 51,67 0,88 [0,67 ; 1,16] 0,346
Education
5 years or+ 59 49,58 60 50,42 1,00 -
-1 to 4 years 95 54,60 79 45,40 1,10 [0,88 ; 1,38] 0,398
Illiterate 53 58,24 38 41,76 1,18 [0,91 ; 1,51] 0,212
Per capita income
> 2 MW 35 46,67 40 53,33 1,00 -
-1 < x ≤ 2 MW 36 48,65 38 51,35 1,04 [0,74 ; 1,46] 0,809
≤ 1 MW 131 59,00 91 41,00 1,26 [0,97 ; 1,85] 0,063
No answer 5 38,46 8 61,54 0,82 [0,40 ; 1,71] 0,583
Occurrences of falls
No 174 53,54 151 46,46 1,00 -
-Yes 33 55,93 26 44,07 1,04 [0,82 ; 1,34] 0,734
Heart disease No 162 51,27 154 48,73 1,00 -
-Yes 45 66,18 23 33,82 1,29 [1,06 ; 1,58] 0,025
Systemic hypertension
No 54 46,15 63 53,85 1,00 -
-Yes 153 57,30 114 42,70 1,24 [1,01 ; 1,55] 0,044
Stroke No 191 52,04 176 47,96 1,00 -
-Yes 16 94,12 1 5,88 1,81 [1,55 ; 2,11] 0,001
Diabetes mellitus No 161 53,31 141 46,69 1,00 -
-Yes 46 56,10 36 43,90 1,05 [0,85 ; 1,31] 0,654
Tumor, câncer No 199 53,49 173 46,51 1,00 -
-Yes 8 66,67 4 33,33 1,25 [0,83 ; 1,88] 0,368
Arthritis, rheumatism
No 116 48,33 124 51,67 1,00 -
-Yes 91 63,19 53 36,81 1,31 [1,09 ; 1,59] 0,005
Lung disease No 188 53,11 166 46,89 1,00 -
-Yes 19 63,33 11 36,67 1,19 [0,89 ; 1,59] 0,281
Depression No 159 51,29 151 48,71 1,00 -
-Yes 48 64,86 26 35,14 1,27 [1,04 ; 1,54] 0,035
Osteoporosis No 125 48,26 134 51,74 1,00 -
-Yes 82 65,60 43 34,40 1,36 [1,14 ; 1,63] 0,001
Quantity of drugs
None 20 36,36 35 63,64 1,00 -
-1 to 2 80 50,31 79 49,69 1,38 [0,94 ; 2,03] 0,074
3 to 4 79 63,71 45 36,29 1,75 [1,20 ; 2,55] 0,001
5 or more 28 60,87 18 39,13 1,67 [1,10 ; 2,55] 0,014
TUG motor ≤10 seconds 60 43,17 79 56,83 1,00 -
->10 seconds 147 60,00 98 40,00 1,39 [1,12 ; 1,73] 0,001
diseases after multivariate analysis related to self-perception for both gen-ders were found: cardiac disease, stroke, osteoporosis and TUG test over 10 seconds. More women were found, thus had feminization of old age, and with lower income living in the city different from the results of the State of Mato Grosso, higher survival of women, and belonging to classes C and D.
Were found higher prevalence in females characterized greater femi-nization in this study living in the city and is considered to be generally due to a greater survival of women12, contradicting the state’s Mato Grosso
according with demographic data14. The women had lower per capita
in-comes with a higher percentage in classes C or D. This result is in agree-ment with other studies with older adults in other states of Brazil20. It was
observed that the older adults with low socioeconomic status were more vulnerable to the limitations of aging and that the women generally had lower income percapita21.
The occurrence of falls was higher in the female group compared to the male group, with a statistically significant difference. This result agrees with several studies showing a higher prevalence of falls in females5,22.
Ac-cording women suffer more falls due to being more fragile, because they have a maturity process which starts earlier than that of men23.
In this study, the comparison between the female and male groups of older adults indicated that the most prominent diseases were systemic hypertension (SH), arthritis and rheumatism, depression, and osteoporo-sis, with a prevalence of females in all the disease categories. Change in the cardiovascular system may lead to SH, also having deleterious effects on the cognition, and the various disorders of senility gradually causing a reduction in the range of movements, affect balance and cause falls24.
Osteoporosis is among the musculoskeletal diseases25 and may be explained
by endocrine changes in older women26.
The data obtained in the study showed differences in the amount
Table 4. Prevalence ratio adjusted by robust Poisson regression (RPa), the variables associated with health self-perceived (bad and very bad) and (very good/good and regular), in the elderly in the community.
Variables Category PRa 95% CI
p-value Valor p
Gender Male 1,00
Female 1,11 0,88-1,39 0,375
Heart disease No 1,00
Yes 1,22 1,01-1,49 0,047
Stroke No 1,00
Yes 1,76 1,45-2,13 <0,001
Osteoporosis No 1,00
Yes 1,28 1,05-1,55 0,013
TUG motor ≤10 seconds 1,00
>10 seconds 1,28 1,03-1,59 0,028
of medications used by the male and female groups, with women being more prevalent in the 3 to 4 medications with significance statistical. The higher number of medications used by women is due to them reporting more chronic conditions2. This also confirms the findings of the present
study in which the elderly women self-perceived a higher percentage of poor and very poor health (9.84%) compared to the men, this difference being statistically significant.
In this study, the mean scores of the TUG and TUG-cognitive of the elderly female group were higher than those of the male group, with these differences being statistically significant. According to this difference is due to the fact that in the aging process sarcopenia may affect the mus-culoskeletal system and its functional capacity performance and interfere with hormonal, nutritional, metabolic and immunological factors23. There
are differences in the physical composition of men and women through-out the life cycle, resulting in different physical performance due to body composition20, thus justifying the lower female performance, corroborating
with present study26. According to Bohannon et al7,older adults may have
difficulty performing dual tasks with advancing age and this decline was associated with Parkinson’s disease27.
Although the health status of the older adults in this study was self-reported, studies have shown that perceived morbidity coincides older people who reported having chronic diseases28 who considering the effect
of ethnicity29 and racial difference in falls30. In this study, among all the
variables analyzed in the anamnesis, five variables summarized the self-perception of health in the elderly. So, these questions should be explored due to lack of time for evaluation and the large number of elderly patients in clinics. It still suggests proposing public the exercises to improve the functionality, which prevents the early functional dependence in the el-derly4. In cross-study there is a limitation to elucidate causality, therefore,
new studies are needed to test these hypotheses.
CONCLUSION
Acknowledgments
The authors would like elderly people of the city.
REFERENCES
1. Dharmarajan K. Multimorbidity in Older Adults with Heart Failure. Clin Geriatr Med 2016;32(2):277–89.
2. Maher RL, Hanlon J, Hajjar ER. Clinical consequences of polypharmacy in elderly. Expert Opin Drug Saf 2014;13(1):57-65.
3. Castro DC, Nunes DP, Pagotto V, Pereira LV, Bachion MM, Nakatani AYK. Incapacidade funcional para atividades básicas de vida diária de idosos: estudo populacional. Ciênc Cuid Saúde 2016;15(1):109-117.
4. Mara D, Tavares S, Pelizaro PB, Sousa Pegorari M, Mapelli De Paiva M, Marchiori GF. Functional disability and associated factors in urban elderly: a population-based study. Rev Bras Cineant Desemp Hum 2016;18(5):499–508.
5. Cruz DT da, Ribeiro LC, Vieira M de T, Teixeira MTB, Bastos RR, Leite ICG. Prevalência de quedas e fatores associados em idosos. Rev Saude Publica 2012;46(1):138–46.
6. Mathias S, Nayak US, Isaacs B. Balance in elderly patients: the“ get-up and go” test. Arch Phys Med Rehabil 1986;67(6):387–9.
7. Bohannon RW, Schaubert K. Long-term Reliability of the Timed Up-and-Go Test among Community-Dwelling Elders. J Phys Ther Sci 2005;17(2):93–6.
8. Virtuoso JF, Perdona Gregório LP, De Medeiros PA, Mazo GZ. O “Timed Up and Go” na previsão e explicação de quedas em idosos praticantes de exercícios físicos. Rev Bras Cineantropom Desempenho Hum 2014;16(4):381-9.
9. Barry E, Galvin R, Keogh C, Horgan F, Fahey T, Tinetti M, et al. Is the Timed Up and Go test a useful predictor of risk of falls in community dwelling older adults: a systematic review and meta- analysis. BMC Geriatr 2014;14(1):1-14.
10. Chen Y, While AE, Hicks A. Self-rated health and associated factors among older people living alone in Shanghai. Geriatr Gerontol Int 2015;15(4):457–64.
11. Zarini GG, Vaccaro JA, Canossa Terris MA, Exebio JC, Tokayer L, Antwi J, et al. Lifestyle Behaviors and Self-Rated Health: The Living for Health Program. J Environ Public Health 2014;2014:1–9.
12. Luy M GK. Do women live longer or do men die earlier? Reflections on the causes of sex differences in life expectancy. Gerontology,. 2014;60(2):143–53.
13. Fleith VD, Figueiredo MA, Figueiredo KF, Moura EC. Perfil de utilização de medicamentos em usuários da rede básica de saúde de Lorena, SP. Cien Saude Colet 2008;13:755–62.
14. Instituto Brasileiro de Geografia e Estatística - IBGE. IBGE-2010 [Internet]. 2010. Available from: http://www.ibge.gov.br/home/
15. Oliveira PH de, Mattos IE. Prevalência e fatores associados à incapacidade fun-cional em idosos institufun-cionalizados no Município de Cuiabá, Estado de Mato Grosso, Brasil, 2009-2010. Epidemiol Serv Saúde 2012;21(3):395–406.
16. Brucki SMD, Nitrini R, Caramelli P, Bertolucci PHF, Okamoto IH. Sugestões para o uso do mini-exame do estado mental no Brasil. Arq Neuropsiquiatr 2003;61(3B):777–81.
17. Hair JF, Black WC, Babin BJ, Anderson RE, Tatham RL. Análise multivariada de dados. Bookman Editora; 2009. 126 p.
18. McGree JM, Eccleston JA. Robust Designs for Poisson Regression Models. Technometrics 2012;54(1):64–72.
19. Coutinho LMS, Scazufca M, Menezes PR. Métodos para estimar razão de prevalência em estudos de corte transversal. Rev Saude Publica 2008;42(6):992–8.
CORRESPONDING AUTHOR
Rosilene Andrade Silva Rodrigues Avenida França, 442. Bairro Santa Rosa
CEP 78.040.170 Cuiabá-MT
E-mail: [email protected] 21. Pagotto V, Nakatani AYK, Silveira ÉA. Fatores associados à autoavaliação de
saúde ruim em idosos usuários do Sistema Único de Saúde. Cad Saude Publica 2011;27(8):1593–602.
22. Ambrose AF, Paul G, Hausdorff JM. Risk factors for falls among older adults: a review of the literature. Maturitas 2013;75(1):51–61.
23. Clegg A, Young J, Iliffe S, Rikkert MO, Rockwood K. Frailty in elderly people. Lancet 2013;381(9868):752–62.
24. Freitas RS, Fernandes MH, Coqueiro R da S, Reis Júnior WM, Rocha SV, Brito TA. Capacidade funcional e fatores associados em idosos: estudo populacional. Acta Paul Enferm 2012;25(6):933–9.
25. Kim S, Won CW, Kim BS, Choi HR, Moon MY. The association between the low muscle mass and osteoporosis in elderly Korean people. J Korean Med Sci 2014;29(7):995–1000.
26. Guadalupe-Grau A, Carnicero J, Losa-Reyna J, Tresguerres J, Gimez-Cabrera M, Castillo C, et al. Endocrinology of Aging From a Muscle Function Point of View: Results From the Toledo Study for Healthy Aging. J Am Med Dir Assoc 2017;18(3):234-239.
27. Vance RC, Healy DG, Galvin R, French HP. Dual tasking with the timed“ up & go” test improves detection of risk of falls in people with Parkinson disease. Phys Ther 2015;95(1):95-102.
28. Sibley KM, Voth J, Munce SE, Straus SE, Jaglal SB. Chronic disease and falls in community-dwelling Canadians over 65 years old: a population-based study exploring associations with number and pattern of chronic conditions. BMC Geriatr 2014;(1)14-22.
29. Su D, Wen M, Markides KS. Is Self-Rated Health Comparable Between Non-Hispanic Whites and Non-Hispanics? Evidence From the Health and Retirement Study. J Gerontol B Psychol Sci Soc Sci 2013;68(4):622-32.