3 (
4
:
: 5
8-António Brandão Moniz ([email protected]), IET Faculty of Science and Technology, Universidade Nova de Lisboa
& (
In this paper will be discussed different types of scenarios and the aims for using scenarios. Normaly they are being used by organisations due to the need to anticipate processes, to support policy making and to understand the complexities of relations. Such organisations can be private companies, R&D organisations and networks of organisations, or even by some public administration institutions.
Some cases will be discussed as the methods for ongoing scenario building process (Shell Internacional). Scenarios should anticipate possible relations among social actors as in the Triple Helix Model, and is possible to develop strategic intelligence in the innovation process that would enable the construction of scenarios. Such processes can be assessed. The focus will be made in relation to the steps chosen for the WORKS scenarios.
In this case is there a model of work changes that can be used for foresight? Differences according to sectors were found, as well on other dimensions. Problems of assessment are analysed with specific application to the scenario construction methods.
9 65 : scenarios; foresight; assessment " ( : E27; F47
(
We are discussing at WORKS project network the issues related with the contents related with scenarios: what is to be used as elements to anticipate the future of work in the knowledge society, which trends in the re structuring process are most likely about to happen. But in this specific research process, we must also to assess, to evaluate the need for the specific type of scenarios. One must know in which conditions can the indicators be measured, how to weight them, which dimensions can be chosen. Such issues are important to acknowledge the dynamics of scenarios.
18 Paper presented at the 2ndInternational Conference on - ( 3
/ :
3 (
Scenarios are being used and applied for difference proposes. They relate to developments in the long term, helping to inform policies by anticipating to a certain extent what will happen in the future and how best to meet these future challenges. In this way they can be applied by companies or by public organisations for their need to anticipate processes. They can be considered also as analytical tools.
Scenarios are being using mostly to support policy making. But they have being used also for understanding the complexities of relations. This is the case for the WORKS project.
Finally a main goal is to understand the mix of strategic decisions that are of maximum benefit in the face of various uncertainties and challenges posed by the external environment. Uncertainties and challenges are being clear in the working environments and in the economical structures.
$
Plausibility must be a scenario feature. They must show a rational route from point/time A to point/time B. From one period to another one with a group of trends and events that can happen.
Also scenarios should have internal consistency. The events or occurrences must have some sort of relation or must be consistent. Also scenarios should have a description of causal processes in order to have a comprehensive story about a possible future.
In general, the scenarios must be useful to be used in decision making. In this sense the actual exercise in the WORKS project can be understood as useful for the European Commission as the main financing institution of such project, and officials of EC are expecting hints, ideas, discussions on the main trends that can contribute to design or even self assess European or national policies. The knowledge on such tendencies can enable a better and more informed decision process.
One must have clear ideas about what are the driving forces related with work process re structuring? What is uncertain in such processes? What is unavoidable?
6 : (
The types of scenarios are normally based on two or three different organisation models of narrative descriptions. One type describes a snapshot in time or the conditions of important variables at some particular time in the future.
illustrate the consequences of different initial assumptions, different evolutionary conditions, or both.
As mentioned in the book on scenario building from Shell International, “in a constantly changing world, no single set of scenarios can remain relevant and useful. We have found that, generally, scenarios that look out over 20 years are likely to remain useful for 3 to 4 years” (Shell International, 2003, p. 87). In fact, Shell developed its first set of global scenarios in 1972. There have been many global scenario cycles since then, each reflecting different challenges in the business environment, as well as changes within this TNC.
“The 1960s was an era of rapid growth for the energy industry and stable low oil prices, Shell’s scenarios raised the possibility of high oil prices — which happened in 1973. Other scenario sets suggested further oil shocks and examined their economic consequences, such as improved energy efficiency”. In the 80s the Shell scenarios developed in this period “explored, among other topics, the emerging de integration of the international oil business, and included reflections on the ‘greening’ of the USSR”.
The following decade “offered opportunities such as entry into formerly inaccessible countries and the inclusion of renewable energy sources in Shell’s portfolio. These scenarios described these business challenges using the concept of TINA (‘There Is No Alternative’) to convey the relentless progress of globalisation, liberalisation and technology”. Finally, “our latest scenarios investigate the social drivers and effects of TINA: Who will shape the new rules of globalisation, regulations around liberalisation and restraints on technology? Issues explored include changing power networks, the role of the US as world leader, and the possibility of a more regionally focused world” (Shell International, 2003, p. 87).
And during this evolution process this company could present what they call as the “ongoing scenario building process” (Shell International, 2003, p. 89). They presented different phases of that process and we can “translate” them into the actual process of scenario building under WORKS project research process:
1. phase – this means assembling a clear description of the project helps to clarify goals and resources. Is the most important moment where the description of the problems to be tackled is made. Is the basic foundation of the scenario building process.
2. phase – a cross disciplinary research will help team members to challenge their assumptions and to confront their blind spots, as they work to identify their most important questions about the future. We can consider that the WORKS project research was collecting all those main conclusions from the different pillars (theoretical, quantitative, qualitative, policy) and all were raising main questions on the future of work re structuring. Such collection of information was fundamental for a framework of the scenario construction.
should not contain excessive detail, and the proposed scenarios should provide a compelling and vivid description of possible future contexts.
4. phase – in this phase one should have mapped out the scenarios knowing that there are many different ways to use them. They are most helpful if used over a period of time to shape the ongoing strategy of an organisation, or (as in the WORKS case) to figure out the range of policies design on labour issues, industry re structuring, the modernisation and innovation challenges. Precisely this the phase that is about to start in the WORKS project until the end of it in mid 2009.
5. 0 phase – Building and using scenarios can help raise awareness of the world around us, directing how we scan the environment and what we see, and increasing our understanding of how we and others interpret events and trends. That will be the phase “post WORKS” where the results will be publicly available.
% (
One should have alternative scenarios, more or less contrasting. From the presentations of key note speakers in this conference 19 we can also have contrasting tendencies of development or change processes or even possibilities. In order scenarios can be better understood and used in the decision process, they should be alternative to each other. Normally, Shell or other scenario builder, use a typical scenario that here we will call as Scenario 1. That is a scenario that is about a future as continuation of the present forces at play. It can also be called the “business as usual” scenario.
However, to present such scenario “business as usual” today would mean a completely different content if we would present it two years ago. Or it will be different if we consider it in the next year. The construction of such scenarios must have that variability into consideration: the present framework of dimensions and variables has already a dynamic that means a change when observed from another period of time like
t1 > t0 > t1
where F represents the actual time (present forces at play), and S the previous
influence and S the result in the near future. This would be the perfect condition for a
sequential development or evolution from S to S. In this case S would the next step
of “business as usual” situation assuming that no different forces came into play. However, in our perspective such condition cannot be supported once all the different moments means that different relations of forces or conditions took place from 1 to 1 (in our example). In other words, static scenarios are not possible to build, or they are so artificial that are not plausible.
But a type of scenario (as mentioned here as 1) can be understood as a continuation from a previous situation. The quantitative analysis can bring several possibilities to demonstrate extrapolated trends. That is made possible for simple forecasts from a previous situation.
Another type of scenario (2) is normally an optimistic one based on one or two of the particularly prominent variables. It can be taken from an ideal outcome.
Scenario 3 can be a different one although focusing also important futures. But this type should integrate collapses, booms or other dramatic events. One can have in mind positive or negative effects, but normally such effects can come from very important events (like the recent financial crisis, or the oil price, or in the trends the “shinning” and emergent economical events in Korea, Finland or Ireland in previous decades).
A typical scenario 4 would be a transition scenario. It can be taken for a transition future from one scenario to another one. There the focus would lay on the needs to support such transition, when that can take a generation. This type of scenario can be used when is built one based on important demographic changes (levels of qualification among the workforce, emergence of a new “baby boom”, etc.) or on radical technological changes and if that scenario can only be feasible in 20 30 or even 30 40 years then it should be presented another scenario for a 10 20 years.
But there are different ways of presenting forecasts. One can be more regular or linear and with basic pre designed shapes (for example, high, mean and low trends of growth). This would be a random scenario with a normal target and linear interpolation). Another way would be a forecasting model (based on Lee and Tuljapurkar contribution) that yealds for different ranges of any outcome of interest, as the authors mention. And that could be particularly pertinent for the propose of an analysis on the future(s) of work re structuring in the knowledge society, that is our aim. The original RS (random scenario) and LT (stochastic forecast) approaches are very different in their approach to formulating the dynamics that underlie their respective forecasts (cf. Tuljapurkar, Lee and Li, 2004, p. 2). Also here one can have to decide upon those approached to be used by WORKS. In fact, these differences suggest final meaningful different results for several reasons:
• First, the simple RS method yields predictive distributions whose shape is determined by the forecaster's assumptions about the shape of the
target distribution of the random scenarios. In contrast, LT usually generates lognormal distributions of population and its components.
• Second, the rate of growth of forecast variance in RS is generally
quadratic with time at long forecast spans, whereas LT yields a variance that increases linearly with time.
Examples can be shown in the following figures based on US population forecasts as shown in the next figures:
Figure 1 A subset of trajectories (solid lines) of the RS version of a scalar projection; also shown (dashed lines) are trajectories based on the high, medium, low targets.
As the same authors mention the useful similarity of these approaches is that “the averages of many forecast quantities (e.g., old age dependency ratio, total population) are quite close in the two approaches. Presumably this is a reflection of the similarity in long run average values of vital rates. One major difference we found was in the level of uncertainty as measured by the width of the predictive distributions of all quantities the LT method yields greater uncertainty than RS over most of the forecast span with the difference increasing rapidly as we go more than say 25 years into the forecast. The driving force here appears to be the much larger variance of fertility in the LT model. The second major difference is driven by the high positive correlation along forecast trajectories in the RS model: this correlation persists over many decades, in contrast to LT in which the correlations damp out within a generation length” (Tuljapurkar, Lee and Li, 2004, p. 13).
Is clear that we will not make demographic projection in the WORKS report on future trends, but it can be useful to have in mind what implications can occur with such options, and which possibilities can be given with such foresight exercises.
The direction of new developments is towards hybrid methods that combine elements of the simple RS methods are use here with the LT method and related stochastic models. The goal of this comparison made by these authors from University of Michigan has been to provide a stylized but sharp comparison of the consequences of the two approaches when they are not hybridized. They mention even “makers and users of forecasts should be aware of these differences and the degree to which they may influence the content and interpretation of any probabilistic forecast. We believe that hybrid methods are a logical and important direction in the business of making better and more useful forecasts” (Tuljapurkar, Lee and Li, 2004, p. 14).
When one is using models for forecasting it is necessary to: “(1) Develop a methodology for estimating parameter shifts, and an : explanation of why such shifts and other errors occur (…); (2) Develop : approaches for identifying structural change and forecasting its effects” (Fildes and Stekler, 2002, pp. 460–461). And as Stekler says, “it is possible that one model may provide an accurate aggregate prediction as a result of the errors of its components being offset, while another model may have the same overall accuracy achieved through accurate estimates of all the components. Obviously, the second model would be preferred for forecasting purposes” (Stekler, 2007, p. 244). And he also concludes “a focus on aspects of the forecasting process, rather than on only one of the components, will be the basis for further improvements in macroeconomic predictive accuracy”(Stekler, 2007, p. 246).
: 4 ;.9 (
In this European project we are referring to, we went also through that scenario characterisation: we had to establish the main relevant dimensions 20, and balance
them. In face of such a huge amount of variables and data we could choose and balance those dimensions.
The next step was the choice of the elements of a scenario: dimensions, events, variables and trends. We had to focus on some of those elements. That step was done carefully to make relevant the option into one or another scenario.
After choosing the key variables the research group had to collect information from the qualitative pillar in order to fill meaningful information on the scenarios using those key variables. That information was taken from the analysis of the organisational (58 case studies) and occupational case studies (30) done by 17 partners from 13 European countries. Besides these WORKS project also analysed large EU databases from establishment and employee surveys.
From that analysis one could find strategic responses of different companies in different institutional settings (national, sectoral). The identification of trends come after the knowledge of the different strategic responses to common conditions (globalisation, intensification of labour, technological modernisation, emergence of new markets, etc.).
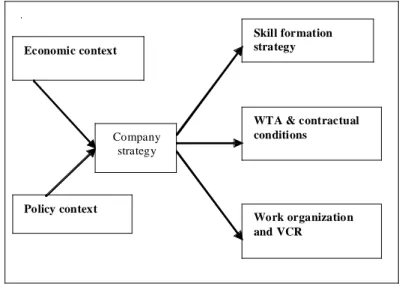
The scenario proposals is to be found as a last step. At this level the research group at WORKS project could understand a model of work changes 21.
Figure 3 Model of work changes in the knowledge society
Under this scheme proposed by Duco Bannink we can have a model where economic and policy contexts determine the companie strategies. Social and labour market policies structure how the nature and quantity of labour supply can be adjusted to the nature and quantity of labour demand or the other way around. The economic context of a company defines the intensity of knowledge that is applied and the extent of flexibility that prevails in a branch. It determines the requirements of companies in the branch with respect to the type of skills and labour supply that is needed in order to be economically successful. The policy and economic contexts are interconnected. This interconnectedness is a central element of the concept of a policy and production
.
21 This model is taken from the proposal of Duco Bannink for the WORKS report on the scenarios. Economic context
Policy context
Company strategy
Skill formation strategy
WTA & contractual conditions
In this sense, each of the company strategies are influencing also the strategy of skill formation and training, the working time arrangements and the contractual conditions, and finally the organisation of work and the restructuring of value chains.
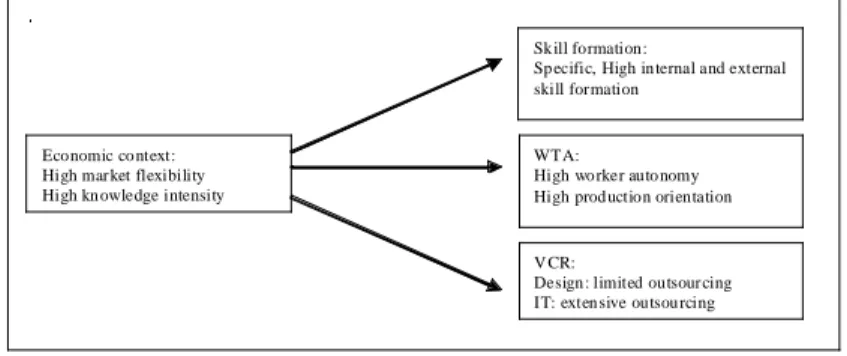
Following this process we can find however deep differences according to sectors. Such model presented above has singularities relative to the R&D and design sector, to manufacturing sector, clothing of IT sector.
Figure 4. IT and design sector
The business functions of Information Technology and design sectors show relatively high levels of knowledge intensity, but also relatively high levels of market flexibility demands. The economic context of these business functions is a context of high market flexibility and high knowledge intensity.
Figure 5. Clothing
Market flexibility requirements in the clothing sector are relatively high as compared to other sectors, while knowledge intensity of most of the work is relatively limited.
In the clothing industry a strong tendency of dualisation of labour is shown. Production and operational work is often outsourced to countries were wages are low and labour regulation is limited. Worker autonomy with respect to task execution and time management in these outsourced units is often severely limited, while the requirements of the production process and of the highly volatile market demand structure tasks and working time.
Economic co ntext: High mar ket flexibility High kn owledge intensity
Sk ill formation:
Sp ecific, High in ternal and external skill formation
WTA:
High wo rker auto nomy High prod uction orientation
V CR:
Design : limited outsour cing IT: exten sive outsou rcing
Economic context: High market flexib ility Low knowled ge inten sity (production)
High knowledge intensity (log istics and design)
Skill formation:
hig h internal and external skill formation in logistics and design; low in production
WTA: pro duction: lo w worker autonomy and h igh production orien tation; lo gistics and design : reversed
Figure 6. Manufacturing
Production is located in an economic context where market flexibility, customer orientation, Just In Time delivery etc. are increasing: market flexibility is relatively high. The knowledge intensity of the production process is mostly relatively low (notwithstanding the sometimes high knowledge intensity of the actual product). In this context, companies tend to show strongly limited career paths and a virtually lacking emphasis upon skill formation.
Figure 7. Information Technologies sector
IT projects are often conducted on site for customers. Often, there is intensive knowledge sharing between the IT producer and customer. This does not allow producer organisations to employ their workforce in a highly flexible manner, without taking into account the working time requirements of the staff. The IT producer is often an independent company selling its products to customer organisations. From the perspective of the customer organisation, this is the outsourcing of IT work.
Turning over from the analysis of business functions to the analysis of branch differences, a comparison of the clothing and IT branches shows a similar pattern as the comparison between IT/design and manufacturing. Market flexibility requirements in the clothing sector are relatively high as compared to other sectors, while knowledge intensity of most of the work is relatively limited. For the IT branch this is the other way around.
Such diversity disturbs clearly the construction of a single model. Also it disturbs even the construction of a model. But that diversity is a symptom and and a feature of the dynamics of those models.
Economic context: High market flexibility Low knowledge intensity
Skill formation:
Specific, Low internal and external skill formation
WTA:
Low worker autonomy High production orientation
VCR:
Extensive outsourcing of operational work
Eco nomic context: High mar ket flexibility High knowledge intensity
Skill formation:
Low in ternal and extern al skill formation
WTA:
High worker autonomy High production o rientation
E
&% /
:
/
2 4
;.9
(
(
In terms of scenario assessment we still have some problems to solve. How can they be measured? Is necessary to use experts panels to measure trends? And can that measure be based only in a +/ intensity assessment by a collective decision in a panel? Or in which condition can we use more detailed measure like 0, 1, 2, 3 as weight on the importance of indicators?
In the Shell International study is mentioned that “techniques such as economic modeling may be useful in clarifying the dynamics, by highlighting potential directions they might take, as well as second and third order effects. This approach can be used in such fields as demography, economics, energy supply and demand, and price formation in oil and gas markets. However, it is important to remember that in scenario building, these models are regarded as suggesting possibilities, elements which will interact and change with the other dynamic factors of a scenario, rather than as providing forecasts. There are many ways to communicate these dynamics in addition to describing them in the narrative—for example, as diagrams and tables” (Shell International, 2003, p. 58).
As Huss underlines the dynamics of forecasting, “the more traditional forecasting tools have been unsuccessful at forecasting turning points because they merely replicate past experience rather than capture adequately the causal relationships and environmental factors which contribute to major structural changes. Although there will probably never be a reliable way of actually forecasting turning points, it is possible to forecast the conditions that may make an abrupt change more likely. By analyzing the key influencing factors, the predetermined events versus the uncertain ones, and the likely reactions of each stakeholder, Shell Oil was able to plan successfully for the oil embargo that occurred in 1973 74. Their approach did not accurately predict the timing of the supply disruption but it did provide evidence that an abrupt change in oil supplies was on the horizon and needed to be considered in the company’s business plans (Huss, 1988, p. 379).
Another possibility in terms of assessment in scenarios is again the usage of yes/no or 0/1 or +/ opinions about trends. One can present to a group of experts (panel) several possible trends (expected or feasible) and each person should assess those trends in a simple way. The final expression of opinions would give a weight to the assessment of trends in the scenarios.
However, forecasters often assert that the errors were caused by badassumptions about the exogenous variables or public policy. Although this happens frequently in economics, it is also possible to observe errors among sociologists and political scientists. For example, it can be necessary to know how present economic global situation will influence such WORKS scenarios. Most of foresight exercises are using only internal indicator dynamics simulations or modeling and exclude those major external political and social dimensions.
of combining judgment forecasts with extrapolation forecasts. (…) Judgmental adjustments of the level and trend were expected to improve accuracy. The empirical research supports adjustments of levels, but trend adjustments are controversial” (Collopy and Armstrong, 1992 p. 579). And at the end of their study, these authors presented the items used to determine guidelines useful for extrapolation (p. 580 581):
• /& : ( 2 Using combinations of forecasts from multiple
extrapolation methods will provide greater accuracy than relying on a single method.
• : ( : 4 4 2 Models that readily adapt to
change are relatively more accurate in forecasting short horizons than those that do not.
• /& < 3/ % : ( 5 4 = % 2 Combinations that
include a forecast done by judgmental methods will be more accurate than those that do not.
• < ( &6 < 3/ 2 Forecasts for which the current status
has been adjusted by judgment will be more accurate than those for which it has not.
• < 3/ ) ( / ) < % 2 Series with outliers are
better forecast by methods that incorporate facilities for automatically dealing with them than by those that rely on the forecaster making these adjustments.
• / % / % : &% 2 Simple models are more accurate
in forecasting unstable series than more complex models.
• < &6 < 3/ 2 Forecasts for which the trend has been adjusted
by judgment will be more accurate than those for which it has not.
• %% % &% 2 The greater the number of data points used in
selecting and fitting a model the more accurate will be the forecasts.
• / % / % : &% 2 Simple models are more accurate in
forecasting stable series than complex models.
• / % / % : ( 6 4 342 Simpler models will more
accurately forecast series with a high level of randomness than more statistically sophisticated models.
• /& 3 / / : % 3 3 2 Improvements in accuracy as a
result of combining forecasts will be greater for the long term than for the short term.
• Do : ( : % 3 3 2 Models that readily adapt to
Such item can be useful when one want to extrapolate some time series results in an organised scenario frame.
4
;.9
(
&
((
W
(%
/
Most of economic scenarios are not accurate. Forecast accuracy will improve gradually with methods that are been developed in the last decades, rather than in a sudden leap. Social sciences developed recently such methods and techniques.
Still are, nevertheless, problems prevailing in order scenarios could be accurate when they are referring to the future of work. Thus to analyse such dynamics some relevant characteristics should be taken in special consideration, such as:
• Work organization: job creation and destruction, up skilling, technological change, organizational change (these are skill biased), management change
• Flexibility: flexible working time arrangement (four patterns can be found in Europe: North, West, South, Central), overtime, part time, unusual hours, retirement, life course
• Skills, training and ILM (Internal Labour Markets)
• Quality of work: balance and career trajectories
If those key variable are taken into account, can we define major trends of these drivers? Are some sub dimensions especially influent? Why? Which strengths and weaknesses can be issued from such trends? (This should be understood either at the sector level, or region, country or macro region). The answers to such questions should bring to the main case studies developed under WORKS framework.
At the same time sub dimensions can be jointly aggregated to influence each other. Can one find relevant statistical information on those relations? And is it possible to use specific quantitative elements to give dimensions to the trends? For example, an X variable can induce an increase of unemployment. But how far in the next years? 1% annual growth? During a 5 years period? Or a decade? The “Foreign Direct Investment” is a determinant variable to explain policy changes? Will it grow 2%? 7% in one year? Or will decrease in the next 5 years? Taking a medium range statistical series how can vary these dimensions? The possible answers to such questions can reveal also approaches to reporting forecast uncertainty that include forecast error margins (implicit interval forecasts), variant forecasts, and forecast scenarios.
The main conclusions underline the fact that the choice for scenarios is a decision for a policy oriented recommendations set, or to support strategical management orientations. However is needed a process of assessment of adequate types of scenarios that includes an evaluation of dimensions to be used as well as categories of weighting the variables that will perform the dynamics of the scenario dimensions. Data quality is also to be considered in such assessment process. This procedure step is a critical one in the case of the WORKS project once there are very few cases of scenario building related to future of employment and work structures. The closer applications are related to demographic scenarios or foresight procedures related with science and technology and innovation policy management. From those exercises is needed to extract meaningful conclusions to use is the case we are developing at the European level.
. :
(
Abberger, Klaus: “Forecasting Quarter on Quarter Changes of German GDP with Monthly Business Tendency Survey Results”, ) ( 3 No. 40, Univ. Munich, Jan. 2007.
Bertrand, G., coord. (1999), - "FSF! ) ) , Brussels,
EC Forward Studies Unit.
Birindelli, Lorenzo et al.: ) ) 2 3M ? 8 ) )
4 : , WORKS report D9.2.5,
2007.
Brynin, Malcom and Longhi, S.: ) ) 2 3M / ,
WORKS report D9.2.4, 2007.
Collopy, Fred; Armstrong, J. S.: “Expert opinions about extrapolation and the mystery of the
overlooked discontinuities”, E ) 8 (1992) 575 582.
Diebold, F. X., and Kilian, L. (2001) “Measuring predictability: theory and macroeconomic
applications”, E ) ? , 16, 657−669.
Fildes, R., and Stekler, H. (2002) “The state of macroeconomic forecasting”. E )
+ , 24, 435−468.
Flecker, Joerg et al.: „Restructuring across value chains and changes in work and employment: Case study evidence from the Clothing, Food, IT and Public Sector”, (/0X- 1
SF6S! ( SF / - I -4 0 , 2007, 153 pp.
The Futures Group (1994): ‘Scenarios’, 0 + 4, AC/UNU Millennium Project.
Glenn, Jerome C.; Gordon, Theodore J. (2002), "FF" - ) , Washington, UNU.
Godet, Michel. “Integration of Scenarios and Strategic Management: Using Relevant, Consistent, and Likely Scenarios.” , Vol. 22, No. 7, September 1990, pp. 730 739.
Granger, Clive and Jeon, Yongil: “Long term forecasting and evaluation”, E
Heilemann, Ulrich and Stekler, Herman (2007): “Introduction to 'The future of macroeconomic
forecasting'”, E ) 23 (2007) 159–165.
Huss, William R. (1988): ‘A move toward scenario analysis’, E ) , Volume 4, Issue 3, Pages 377 388.
Isiklar, Gultekin and Lahiri, Kajal: “How far ahead can we forecast? Evidence from cross
country surveys”, E ) 23 (2007) 167–187
Krings, Bettina (2006), "The sociological perspective on the knowledge based society:
assumptions, facts and visions", ( 3 - , 2, IET, pp. 9 19
Kuhlmann, Stefan: “Evaluation as a Source of Strategic Intelligence”, cf. Issues in Linking RIT Evaluation With Policy.
Lee, R. and S. Tuljapurkar (1994) “Stochastic population forecasts of the U.S.: Beyond High,
Medium, Low”, E ) ? - ? ' 89: 1175 1189.
Meadows, Dennis, et al., < 2 6New York: Universe Books, 1972.
Moniz, António B. (2006), "Foresight methodologies to understand changes in the labour
process. Experience from Portugal", ( 3 - , 2, IET, pp.
105 116.
Moniz, António B. and Godinho, M. Mira: “New Methodological Approaches for Change in Traditional Sectors: The case of the Portuguese fisheries socio economic system”, Y - , , (Série “Dynamique technologique et organisation”), nº 5, 5/2000, pp. 63 – 77.
NISTEP (2005): - 4 - 4 I 1 ? 4 , Tokyo,
NISTEP Repor Nº 97
NISTEP (2008): - 2 "F"% - 1 -L ,
Tokyo, NISTEP Repor Nº 101
Paulos, Margarida R. (2008), "Tendências futuras de evolução das qualificações na Europa",
( 3 - , No. WPS01/2008, 16 pp.
Paulos, Margarida R. and Moniz, António B.(2009): "Are societal changes new? Questions or trends and future perceptions on knowledge based economy", ( 3 - , WPS02/2009, 17 pp.
Pflaumer, P. (1988) “Confidence intervals for population projections based on Monte Carlo
methods”, E ) 4: 135 142.
Sellin, Burkart: - ) )
! - 4 ) ) ) = ) W = *S$$#
"FF"., “Panorama Series” No. 40, Luxembourg, CEDEFOP/European Communities, 2002.
Shell International: - ! ? : ; < , Global Business Environment, Shell International, 2003, 55 pp.
Schwartz, Peter (1991) ? ) 9 2! )
Stekler, Herman O.: “The future of macroeconomic forecasting: Understanding the forecasting
process”, E ) , 23 (2007) 237–248.
Tuljapurkar, Shripad; Lee, Ronald D. and Li, Qi: “Random Scenario Forecasts Versus Stochastic Forecasts”,( 3 ( "FFR FHT, Michigan Retirement Research Center.
Valenduc, Gérard et al.: “Occupational case studies: Synthesis report and comparative
analysis”, (/0X- ) ( SS'2007, 196 pp.