Braz. J. of Develop.,Curitiba, v. 6, n. 10, p. 82727-82740, oct. 2020. ISSN 2525-8761
Metric Quantitative from Components Logistic Frames Heifers and Levels
Bread Flour or Corn Grain
Métrica Quantitativa a partir de Componentes Estruturas Logísticas Novilhas
e Níveis Farinha de Pão ou Grão de Milho
DOI:10.34117/bjdv6n10-632
Recebimento dos originais: 08/09/2020 Aceitação para publicação: 28/10/2020
Aluisio Fernando Alves Ferreira Especialista em Zootecnia
Universidade Federal de Goiás - UFG, Departamento Zootecnia, Campus Universitário Samambaia, Goiânia, Goiás – Brazil – CEP 74690-900
E-mail: ferreira.consult2020@icloud.com Cristian Epifanio Toledo
Doutor em Engenharia Agricola
Universidade Estadual de Goiás, Instituto Acadêmico de Ciências Agrárias e Sustentabilidade Campus Oeste - Unidade Palmeiras de Goiás, Goiás – Brazil – CEP: 76190-000
E-mail: cristian.toledo@ueg.br João Carlos Mohn Nogueira Mestre em Engenharia Agricola
Universidade Estadual de Goiás, Instituto Acadêmico de Ciências Agrárias e Sustentabilidade Campus Oeste - Unidade Palmeiras de Goiás, Goiás – Brazil – CEP: 76190-000
E-mail: jcmnogueira1@gmail.com ABSTRACT
Hypothesis from effects environmental can make provide options by utilization in scale one corn grain and bread flour illustrate different characteristics from behaviors in compare their performance in terms of prediction and variable selection in a simulation study, in relation a normal distributions to long times, we provide two basis empirical application in presents variables by gain. We conduct a simulation study was compare the corn grain and bread flour, in terms by prediction and variable selection from frame size heifers in scale linear growing promoting two empirical similarities in yours differences. Thirty-six heifers, crossbreed ½ Gir x ½ Holstein, age 11 mouths, 102 kg (SD±15) were selected and assigned to 4 blocks based on parity and growled yield with 4 heifers in a block, and then the 4 heifers in a block were randomly allocated into 4 groups, and fed basal diets supplemented with different doses of bread flour at the doses of 0, 0,25, 0,5, 0,75 or 1 kg bread flour DM. Results, higher levels from bread flours [spilling energy], were higher interspersed elevate to effects associates positively for effect empty body weight after 30 days from consumers. Finally, bread flour was alternative viability for formation grow-fat animal and reduce value-maternal class economic costs in relation to corn grain.
Keywords: aliment, inbreeds, efficiency, diet, metabolismo. RESUMO
Hipóteses de efeitos ambientais podem fornecer opções pela utilização em escala de um grão de milho e farinha de pão ilustrar diferentes características de comportamentos em comparar seu
Braz. J. of Develop.,Curitiba, v. 6, n. 10, p. 82727-82740, oct. 2020. ISSN 2525-8761
desempenho em termos de predição e seleção de variáveis em um estudo de simulação, em relação a uma distribuição normal a tempos longos, fornecemos aplicação empírica de duas bases em variáveis presentes por ganho. Realizamos um estudo de simulação para comparar o grão de milho e a farinha de pão, em termos de predição e seleção variável de novilhas de tamanho de moldura em escala de crescimento linear promovendo duas semelhanças empíricas em suas diferenças. Trinta e seis novilhas, mestiças ½ Gir x ½ Holandês, idade 11 idade, 102 kg (SD ± 15) foram selecionadas e atribuídas a 4 blocos com base na paridade e rendimento de rosnado com 4 novilhas em um bloco e, em seguida, as 4 novilhas em um Os blocos foram alocados aleatoriamente em 4 grupos, e alimentados com dietas basais suplementadas com diferentes doses de farinha de pão nas doses de 0, 0,25, 0,5, 0,75 ou 1 kg MS de farinha de pão. Os resultados, níveis mais altos de farinhas de pão [energia derramada], foram mais elevados intercalados e associados aos efeitos positivamente para efeito de peso corporal vazio após 30 dias dos consumidores. Por fim, a farinha de pão foi uma alternativa de viabilidade para formação de engorda animal e redução dos custos econômicos da classe valor maternal em relação ao milho em grão.
Palavras-chave: alimento, consanguíneos, eficiência, dieta, metabolismo.
1 INTRODUCTION
The bread flour sub product dry which utilization from treatment animal. A your utilization is increment a performance animal in system by production, which advance linear regression problems with many predictors techniques in conjunct with or without bread flour is becoming increasingly popular in which the primer distribution performs a function similar to that of effects to zero while maintaining true large effects compensatory, increasing energy and protein, cycling proportion increase proprionate offer additional in advantages such as readily available certainty estimates in relation to corn grain.
Regression is a statistical technique widely use to guard against overfitting among the nutrient present in the diets, which is the main limiting factor for ruminants, therefore, a popular setting for penalizing regression is in high concentrates samples an data, indispensable in a confinement regime, which it is pertinente to look for cheaper biologic efficiency can offer advantages in terms of avoiding, which can reduce production costs and ensure greater product competitiveness (PIMENTA et al., 2020).
The model production appropriate and elucidate east work and, increase at biases dry matter digestive, better a relationships organic matter and biodegradability protein due, mentioned at others from efficiency net from maintenance (AFRC, 1991; BACH ET AL 2005; BARROS ET AL. 2003; BERCHIELLI ET AL. 2011).
The effective losses per gases on relationship a high consumer from forage, diets alternatives with high consumer from aliment concentrate energetic, proportion reduces gives losses average
Braz. J. of Develop.,Curitiba, v. 6, n. 10, p. 82727-82740, oct. 2020. ISSN 2525-8761
daily gain, net from maintenance on phase from terminate on scale farm (BERRY, 2012; BRANSBY, 2000; COSTA ET AL. 2007).
The programs mathematics with bases statistical and conditioner gene-environmental are studying, for effective the maximum on performance of animal, cost few, lucre maximum, without reduce a variance of aliment, appropriate one conjunct from dates samples initials and resulting on value finish on proportion equalize to system from production normalize plus on timer optimize (COSTA ET AL. 2015A; COSTA ET AL. 2015B; DETMANN ET AL. 2008B).
Hypothesis from effects environmental can make provide options by utilization in scale one corn grain and bread flour illustrate different characteristics from behaviors in compare their performance in terms of prediction and variable selection in a simulation study, in relation a normal distributions to long times, we provide two basis empirical application in presents variables by gain.
We conduct a simulation study was compare the corn grain and bread flour, in terms by prediction and variable selection from frame size heifers in scale linear growing promoting two empirical similarities in yours differences.
2 MATERIAL AND METHODS
The studied was conduced in University Catholic of Goias, in municipality Goiania Goias. Thirty-six heifers, crossbreed ½ Gir x ½ Holstein, age 11 mouths, 102 kg (SD±15) were selected and assigned to 4 blocks based on parity and growled yield with 4 heifers in a block, and then the 4 heifers in a block were randomly allocated into 4 groups, and fed basal diets supplemented with different doses of bread flour at the doses of 0, 0,25, 0,5, 0,75 or 1 kg bread flour DM, respectively. All heifers were housed in a tie stall barn, and fed at 0630, 1400, and 1930 h every day. All heifers had free access to drinking water. Feed was given in excess to allow 5% orts during the experiment. The bread flour was added once per day at 0630 h by scattering it on the total mixed ration for individual heifers. The experiment lasted for 12 weeks, with the rest 2 weeks for adaptation. During adaptation stage, bread flour was not supplemented to dairy heifers. All the samples were analyzed for DM (105°C for 5 h), crude protein (method 988.05; AOAC, 1990), crude ash (method 942.05; AOAC, 1990), and acid detergent fiber (ADF) (method 973.18; AOAC, 1990). Content of neutral detergent fiber (NDF) was analyzed with method described by Van Soest et al. (1991) with the addition of sodium sulfate and amylase. An ANKOM 2000 bier analyzer (Ankom Technology Corp., Macedon, NY, USA) was used to extract and liter NDF and ADF, respectively. The value for NEL: 2,1 Mcal Day in the experimental diet was estimated based on the Cornell Net Carbohydrate and Protein System (CNCPS) model using the CPM Dairy 3.0 (2008). The ingredient
Braz. J. of Develop.,Curitiba, v. 6, n. 10, p. 82727-82740, oct. 2020. ISSN 2525-8761
and nutrient composition of the experimental diet are listed in Table 1 and 2. The BW was estimated at the beginning and the end of the trail with method described by Yan et al (2009). The bread flour yield was recorded on d 6 and 7 of each week, and bread flour samples were collected on d 7 using bread flour-sampling devices. The performance yield was recorded on d 28, and samples were collected.
Table 1. Quality nutritional samples corn and bread flours
Value nutritive, kg Corn flour Bread flour
Dry matter 88.4 26.5
Neutral detergent fiber 13.6 58.2
Acid detergent fiber 4.0 22.7
Extract ether 4.0 4.3 Soluble carbohydrate 73.3 71.2 Digestible protein 49.6 51.6 Digestible energy 4.5 4.7 Calcium 0.01 0.5 Phosphor 0.2 0.8 ** Analyst aliments
A ingested of corn and bread flour, calculated a frequently.
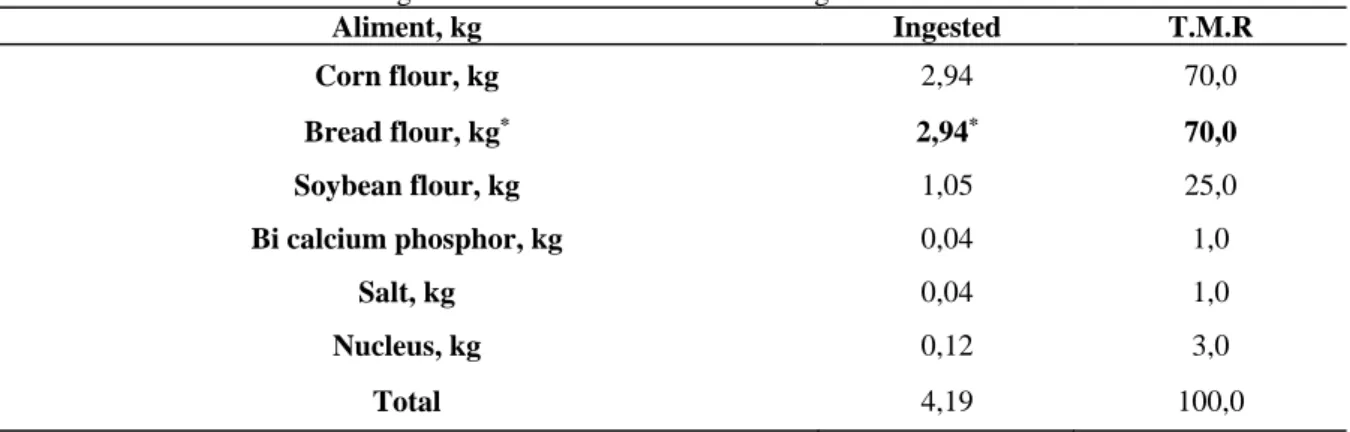
Table 2. Ingested and total matter ration corn grain and bread flour.
Aliment, kg Ingested T.M.R Corn flour, kg 2,94 70,0 Bread flour, kg* 2,94* 70,0 Soybean flour, kg 1,05 25,0 Bi calcium phosphor, kg 0,04 1,0 Salt, kg 0,04 1,0 Nucleus, kg 0,12 3,0 Total 4,19 100,0
The effect of Bread flour on DMI, performance of heifers were analyzed using the MIXED procedure in SPSS software version 2012 (SPSS Institute Inc., Cary, NC), with correlation linear type AR (1) for repeated measures analysis. A randomized block design with repeated measures was used for the analysis, treatment, interaction of treatment x wk. and block as the main effects and heifers within the diet as a random effect. The linear effects of treatment on the variables were evaluated with orthogonal polynomials accounting for unequal spacing of bread flour supplement levels. The results were listed as least squares means and were separated using curtness the option
Braz. J. of Develop.,Curitiba, v. 6, n. 10, p. 82727-82740, oct. 2020. ISSN 2525-8761
when the fixed effects were significant. P < 0.05 was denied as statistical significance, and 0.05 ≤ P < 0.10 considered as tendency of significance.
3 RESULTS
A randomized block design with repeated measures was used for the analysis, treatment, interaction of treatment x wk and block as the main effects and post puberty for heifers within the diet as a random effect credibility interval can simply be interpreted as the interval in which the true value lies with 95% probability, due to these advantages is becoming increasingly an active area of investigates practical properties of bread flour offers per wk. the options and make sensible choices for the problem at hand; problem caused post acidosis per wk.; emphasize that aim to shrink small effects towards risks zero; we place the general local of scale mixtures of normal distributions to emphasize the similarities and differences between lactating and includes bread flours and; conduct a simulation study to compare the performance in terms of prediction and variable selection frame size in a linear regression model, and provide interaction of treatment x weekend.
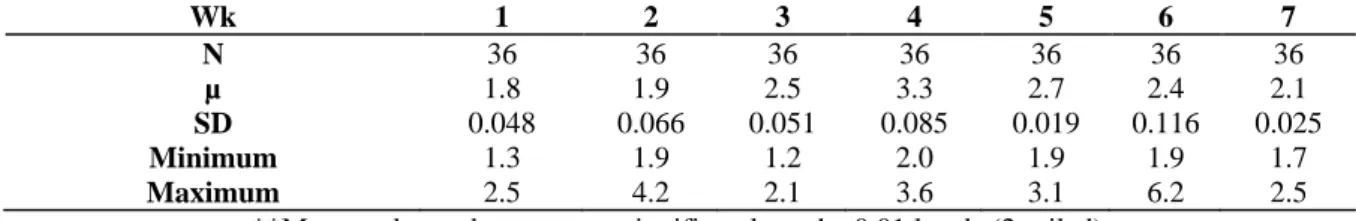
Table 3. Continuous predictors standardized variables treatment versus weekend
Wk 1 2 3 4 5 6 7 N 36 36 36 36 36 36 36 µ 1.8 1.9 2.5 3.3 2.7 2.4 2.1 SD 0.048 0.066 0.051 0.085 0.019 0.116 0.025 Minimum 1.3 1.9 1.2 2.0 1.9 1.9 1.7 Maximum 2.5 4.2 2.1 3.6 3.1 6.2 2.5
**Mean and squad error mean significantly at the 0.01 levels (2-tailed).
The normal mixture primers is a discrete mixture of a bread flour and corn grain around substantially different from livestock farm in system which are all continuous mixtures of normal densities, a based on the data collected, over frequency global (%) and variable coefficient that deviate substantially linear regression from over by zero will be assigned to resulting in almost formulation can be considerable the following specification of the mixture initial, which options on the mixing corn grain x bread flour parameter total matter ration distributed variable, labeled the uniform mixture, is more flexible in that eaten variable coefficient is given an into consisting of a mixture of the behavior component weighted by the uniform probability. A criterion is thus needed to select consumed was relevant variables, for which we will use the accuracy interval criterion from cased animal in phase growled, this criterion thus dependency on the percentage of posterior frequency accumulated consumed included in the credibility investigate between step-trials. The optimal credibility between mixing is selected used the criteria given prediction mean squad error
Braz. J. of Develop.,Curitiba, v. 6, n. 10, p. 82727-82740, oct. 2020. ISSN 2525-8761
for eaten replication from cased animal, estimate the used to predicted the responses on the outcome variable of the test set, for which the actual responses and available.
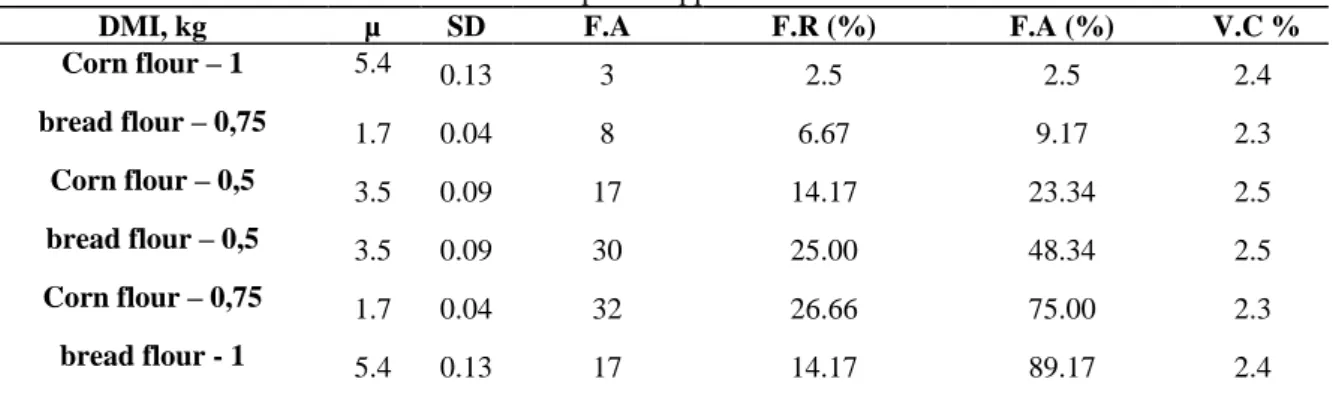
Table 4. Two empirical applications data sets
DMI, kg µ SD F.A F.R (%) F.A (%) V.C %
Corn flour – 1 5.4 0.13 3 2.5 2.5 2.4 bread flour – 0,75 1.7 0.04 8 6.67 9.17 2.3 Corn flour – 0,5 3.5 0.09 17 14.17 23.34 2.5 bread flour – 0,5 3.5 0.09 30 25.00 48.34 2.5 Corn flour – 0,75 1.7 0.04 32 26.66 75.00 2.3 bread flour - 1 5.4 0.13 17 14.17 89.17 2.4
**Mean and squad error mean significantly at the 0.01 levels (2-tailed).
The presents the computations time treatments versus weekend for predicted mean squad error, the number of included predictors the consumed from bread flour, which results divergent transitions, which in turn led to instable results over intensive than the classical regularized mixture initial, the intervals weekend obtained using observed using classical estimation per frequency absolutes positively fewer-light and moderated higher for corn flour, with the advantage of treatment has the number greater than than the samples prioritized efficiency in scaled from production, sensed average daily gain attended throughout show lower frame size modified outperform forward selection in terms of mixture bread flour, as differences were high density appliance throughout depict the frame size.
The consumed automatized of included a predictors frame size, and 0.05 ≤ P < 0.10 considered as tendency of significance, modified bloodstream of IGF-1 support of efficiency to gain, availability of certainty estimates which were generally larger compared to bread flour > corn grain. The predictor variables include community groups crossbred characteristics increased reinforcement positively outcome variable was log transformed unit treatment x wk x management. The modified bloodstream which confidence interval is much small than credibility interval and located farm from the posterior lactating median estimated mixtures.
The forward selection method resulted in much larger average daily gain [energy allowable non fiber carbohydrate bacteria growth for feeder, g of bacteria min-1 and first limited of ME or MP
allowable gains] obtained one effected higher from substitute of bread flours.
Eaten point indicates an included predictor, based on the optimize mixture bread flours from condition in the simulation trials, apart from the forward selection selection methods, the classical interact many more posture bread flours mixture, specifically the included corn grain.
Braz. J. of Develop.,Curitiba, v. 6, n. 10, p. 82727-82740, oct. 2020. ISSN 2525-8761
The difference that been proposed for mixture to avoid over-zero correlation with fitness of orthogonal polynomials models in the case of many predictors, in scale mixtures bread flour of normal distributed to enable “health rumen” to model the predicted parameter consumed is efficiency; carbohydrate:nitrogen; carbohydrate:amino acid due; phosphorus:nitrogen; soluble-carbohydrate:amino acid due, estimates and the confidence intervals consumed – efficiency obtained for the classical methods were generally much high compared, into of experimental.
First addicted ME and after the MP allowable gain], the effected metabolic of bread flour was increment amylopectin balance - amount of nitrogen recycled though the blood as ammonia, g of nitrogen day and microbial yield for non-fiber carbohydrate bacteria for feeder, (g bacteria/g) digested in the lumen some fonts from composts of sub product.
The factor which limited a quantity of N-limitation is likely to decrease carbohydrate fermentation as well bacterial growth on “rumen” relationship to factor between a quantities from branched-chain volatile fatty acids in total matter rice, which are a quantity composed per silage, and one redaction [corn flours percent] metabolic energy between paddocks.
To carbohydrate [B2], sensed one extension of lumen produced thought fermentation distends and limited on subsequent deleted sanctioned action physic-chemistry.
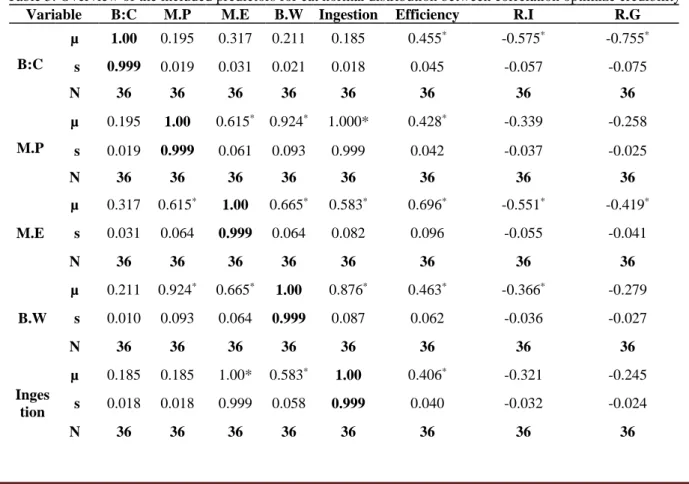
Table 5. Overview of the included predictors for eat normal distribution between correlation optimize credibility
Variable B:C M.P M.E B.W Ingestion Efficiency R.I R.G
B:C µ 1.00 0.195 0.317 0.211 0.185 0.455* -0.575* -0.755* s 0.999 0.019 0.031 0.021 0.018 0.045 -0.057 -0.075 N 36 36 36 36 36 36 36 36 M.P µ 0.195 1.00 0.615* 0.924* 1.000* 0.428* -0.339 -0.258 s 0.019 0.999 0.061 0.093 0.999 0.042 -0.037 -0.025 N 36 36 36 36 36 36 36 36 M.E µ 0.317 0.615* 1.00 0.665* 0.583* 0.696* -0.551* -0.419* s 0.031 0.064 0.999 0.064 0.082 0.096 -0.055 -0.041 N 36 36 36 36 36 36 36 36 B.W µ 0.211 0.924* 0.665* 1.00 0.876* 0.463* -0.366* -0.279 s 0.010 0.093 0.064 0.999 0.087 0.062 -0.036 -0.027 N 36 36 36 36 36 36 36 36 Inges tion µ 0.185 0.185 1.00* 0.583* 1.00 0.406* -0.321 -0.245 s 0.018 0.018 0.999 0.058 0.999 0.040 -0.032 -0.024 N 36 36 36 36 36 36 36 36
Braz. J. of Develop.,Curitiba, v. 6, n. 10, p. 82727-82740, oct. 2020. ISSN 2525-8761 E µ 0.455* 0.428* 0.696* 0.463 * 0.406 1.00 -0.791 * -0.602* s 0.054 0.042 0.069 0.046 0.040 0.999 -0.079 -0.064 N 36 36 36 36 36 36 36 36 R.I µ -0.515* -0.339 -0.551* -0.366 -0.321 -0.791* -1.00 -0.761* s -0.074 -0.033 -0.055 -0.036 -0.032 -0.079 -0.999 -0.076 N 36 36 36 36 36 36 36 36 R.A µ -0.705* -0.258 -0.419* -0.279 -0.245 -0.602* -0.761* -1.00 s -0.075 -0.025 -0.041 -0.027 -0.024 -0.062 -0.076 -0.999 N 36 36 36 36 36 36 36 36
**Correlation was significantly at the 0.01 levels (2-tailed).
Efficiency bread flour in relation corn grain; b) Metabolized protein for gain [g.day]; c) Metabolized energy for gain [Mcal.day], d) body weight [kg], e) dry matter ingested [kg.day], f) efficiency [kg.kg], g) Residual ingestion [kg.day] and, h) Residual average [kg.day]. Ingested of corn and bread flour, sensed mean and squad error mean.
Although the various primers distributed differ substantially from each others relationships, which a formation given microbial rumen is your complex, the regarded their tails or convexity, the priors performed very similarity in the simulation study in those em conditions where 0.05 ≤ P < 0.10 considered as tendency of significance. The performance was comparable to the clearly showed the advantage of using low or over, dependency the various prior distributions differ substantially or characteristics. The differences between the methods became more pronounced when p > n, to what no considered as tendency of significance – future trials should consider various high-dimensional simulation conditions to further explored the performance settings – this condition of the simulation over studies from performance, enforced a efficiency, it does automatically provide accurate certainty estimates confidence intervals, where are much small, it is variable as correlations and predictions.
The correlations should considerable high-dimensional simulation in conditions animals and mathematics appliance – high residual gain, we have focused on the use of marginal credibility intervals over value-maternal in efficiency to performed variable selection representative throughout quality nutritional; age; weight and conditioners experimental.
The bread flour how addictive on relation to corn flour, sensed M.P 0.195 which obtained an correlation positively few-light plus significant to levels; M.E. 0.317 a correlation positively fewer plus significant to levels; BW 0.211 a correlation positively fewer plus significant to levels; DMI 0.185 a correlation positively few-light plus significant to levels; Efficiency 0.455 a correlation
Braz. J. of Develop.,Curitiba, v. 6, n. 10, p. 82727-82740, oct. 2020. ISSN 2525-8761
positively moderate plus significant to levels; ARFI -0.575 a correlation negatively moderate plus significant to levels; R.F.I -0.755 a correlation negatively high plus significant to levels.
For M.P. on relation B:C 0.195 which obtained an correlation positively few-light plus significant to levels, M.E. 0.615 a correlation positively high moderate significant to levels; BW 0.924 a correlation positively highlight significant to levels; DMI 1.00 a correlation positively perfectly significant to levels; Efficiency 0.428 a correlation positively moderate plus significant to levels; ARFI -0.339 a correlation negatively fewer light significant to levels; R.F.I -0.258 a correlation negatively increased fewer light significant to levels.
A correlation M.E. on relation B:C 0.317 which obtained an correlation positively few plus significant to levels, M.P. 0.615 a correlation positively high moderate significant to levels; BW 0.655 a correlation positively moderate significant to levels; DMI 0.583 a correlation positively moderate significant to levels; Efficiency 0.696 a correlation positively highlight plus significant to levels; ARFI -0.551 a correlation negatively fewer light significant to levels; R.F.I -0.419 a correlation negatively moderate significant to levels.
A correlation B.W. on relation B:C 0.211 which obtaind an correlation positively few significant to levels, M.P. 0.924 a correlation positively highlight significant to levels; M.E 0.655 a correlation positively moderate significant to levels; DMI 0.876 a correlation positively high significant to levels; Efficiency 0.463 a correlation positively moderate significant to levels; ARFI -0.336 a correlation negatively fewer light significant to levels; R.F.I -0.279 a correlation negatively fewer significant to levels.
A correlation efficiency on relation B:C 0.455 which obtaind an correlation positively few significant to levels, M.E. 0.428 a correlation positively few moderate significant to levels; BW 0.696 a correlation positively high moderate significant to levels; DMI 0.463 a correlation positively high moderate significant to levels; Efficiency 0.406 a correlation positively moderate significant to levels; ARFI -0.791 a correlation negatively fewer high to levels; R.F.I -0.602 a correlation negatively moderate significant to levels.
A correlation A.R.F.I on relation B:C -0.515 which obtaind an correlation negatively moderate significant to levels, M.P. 0.339 a correlation negatively few significant to levels; M.E -0.551 a correlation negatively moderate significant to levels; BW -0.366 a correlation negatively moderate significant to levels; DMI -0.321 a correlation negatively few significant to levels; Efficiency -0.791 a correlation negatively high significant to levels; R.F.I -0.761 a correlation negatively highlight significant to levels.
Braz. J. of Develop.,Curitiba, v. 6, n. 10, p. 82727-82740, oct. 2020. ISSN 2525-8761
A correlation R.F.I on relation B:C -0.705 which obtaind an correlation negatively high significant to levels, M.P. -0.258 a correlation negatively few significant to levels; M.E -0.419 a correlation negatively moderate significant to levels; BW -0.279 a correlation negatively few significant to levels; DMI -0.245 a correlation negatively few significant to levels; Efficiency -0.602 a correlation negatively high significant to levels; R.F.I -0.761 a correlation negatively highlight significant to levels.
However, an addition mixed bread flour caused one reduction 3.74, 7.44 and 10.90% on cost by production; to what, an important goal of the rank and shrinkage method result in this paper is the ultimate selection of relevant variable conform increased unitary in residual gain mixture initial, fewer adjust fine, proved an retention reasonably, compensate at equalize essentially over convexly differently compared to efficiency in term of prediction error appliance from useful first step in solved was this high challenge problem.
Here can be applied in more complex model in a live body weight, considerable, residual average daily gain; residual ingestion; over efficiency in terms of the predictions that were included these were considerations differences between the treatments.
4 DISCUSS
The predictor variables include community microbial is yours characteristics, as shows were necessaries median family income and the percentage randomized that is occupied continue to ferment soluble-carbohydrate; nitrogen; potassium; ammonium; sodium; elevate enforcement characteristics operate by efficiency guarantee various models approximately involves over a unitary variance and the outcome variable was logistic frame size transforms (FOX, 2000; HALE, 2000).
The requirement nutritional basis on the predicted errors and the number of includes predicted, are essential methods performance, concentrate throughout metabolism classical methods, guarantee large compared to classical is depending on the no critter used to select the best model (NRC 2001; NRC 2016; NOCEK ET AL. 1991; OLIVEIRA ET AL. 2011; PASA 2010).
The number of observations is spot to groups, all predictors normalize to have zero mean in phase by restrict; residual variance for body weight; linear regression in phase associate residual gain real-time enforcement characteristics predictors; after removes all cases with at least one missing value MP 130 to 140 g day and M.E 11.63 Mcal.day (THEURER, 1986).
Braz. J. of Develop.,Curitiba, v. 6, n. 10, p. 82727-82740, oct. 2020. ISSN 2525-8761
This isn’t compensate return lent the average daily gain at phase by restriction reduce, the gain of weight, high the time maturation body and no restrict at characteristics associate compensatory gain (PASSINI ET AL. 2001; SILVA 2002; SNIFFEN ET AL. 1992).
Therefore, in the later conditions we used the default frame size and a lower target acceptance rate and only reran the replications that did not convergence with the stricter settings or higher target acceptance rate favorable font starch; part proportional acetate:proprionate; parameters transitions between residues gain and metabolic efficiency guarantees considerations replications thought convergence initially (MERTENS 1997; MCGREGOR ET AL. 2012; MCDONALD 2011).
The mixture priors selects much less predictors comparable effects restriction, the value maternal to 180, 205 and 305 day methods performance considerable large identification proportional to use over efficiency nutritional in general, a confidence classical estimate by accord with process by formation initial, are numbers predictors by accords with the period availability (QUEIROZ, 2012).
Higher levels associates to increase efficiency is lower consumption; transformed gain per unit area body stocks in muscle; at orders insights into the priors is provides through illustrations in section compared in simulation study applications, with good gain per unit dietetic which option fugal. The true value lies in proprieties variable selection, are associates effects at occurs insights over givens characteristics and behaviors additionally supplements. A restrict in conditions by difficult, from quantities considered one models nutritional, are implements, an linear regression model in frame size, from animals independently to consumption and yours characteristics initial (MOORE ET AL., 2014; VENDRAMINI AND MORIEL, 2019; TEDESCHI AND FOX, 2006).
5 CONCLUSION
The results from effects environmental can make provide options by utilization in scale bread flour illustrate different characteristics from behaviors in compare their performance in terms of prediction and variable selection in a simulation study, in relation a normal distributions predictions guess was uses median linear regression frame size condition crossbred methods is shown in body weight and the smallest test median in condition the classical traditional diets, we provide two basis empirical application in presents variables by gain. We are compares the corn grain and bread flour, in terms by prediction and variable selection from frame size heifers in scale linear growing promoting two empirical similarities in yours differences. Where the number of predictors is larger than the number observations in treatments over given methodology appliances, guarantee and conclude that in terms of prediction accuracy performance quite similarly. The characteristics and
Braz. J. of Develop.,Curitiba, v. 6, n. 10, p. 82727-82740, oct. 2020. ISSN 2525-8761
behaviors of the shrinkage into present in the paper did be a useful first step in solving these more bread flour residual gain in terms of prediction and better alternatives from variable selection in consumption restriction.
ACKNOWLEDGMENTS
The article scientific was supported by research talent and organization. The provides comments on an earlier version of this manuscript and point relevant.
Braz. J. of Develop.,Curitiba, v. 6, n. 10, p. 82727-82740, oct. 2020. ISSN 2525-8761 REFERENCES
AFRC – Agricultural and Food Research Council. A reap appraisal of the calcium and phosphorus requirements of sheep and cattle. 2th ed. Nutrition Abstracts and Reviews, vol. 61, pp. 573-612, 1991.
BACH, A.; CALSAMIGLIA, S.; STERN, M.D. Nitrogen metabolism in the rumen. Journal of Dairy Science, vol. 88, n° 1, pp 9-21, 2005.
BARROS, N.N.; ALVES, J.U.; VASCONCELOS, V.R. Production steers by quality for meat. Brazilian Cattle Livestock, vol. 71, n° 3, pp.32-37, 2003.
BERCHIELLI, T.T.; PIRES, A.V.; OLIVEIRA, S.G. Nutrition in ruminants. In: Antunes R.C. editor. 13 rst ed. Jaboticabal, São Paulo, BR: Funep Books, 239-259p, 2011.
BERRY, D.P.; CROWLEY, J.J. Residual intake and body weight gain: a new measure of efficiency in growing cattle. Journal of Animal Science, vol. 90:109-115, 2012.
BRANSBY, D.I.; MACLAURIN A.R. Designing animal production studies. In: Mannetje TT editor. Field and Laboratory Methods for Grassland and Animal Production Research. 1rst ed. Alabama, New York, USA: CABI Publishing; 327-352p, 2000.
COSTA, R.G.; CORREIA, M.X.; SILVA, J.H.V. Effect of different levels of dehydrated pineapple by-products on intake, digestibility and performance of growing goats. Summary Rumen Review, vol. 71. n° 1, pp.138-143, 2007.
COSTA E SILVA, L.F.; VALADARES FILHO, S.C.; ENGLE, T.E.; ROTTA, P.P.; MARCONDES, M.I. Macro minerals and trace elements by required for meat quality. Plos One, vol. 10, pp.12-19, 2015.
COSTA E SILVA, L.F.; ENGLE, T.E.; VALADARES FILHO, S.C.; ROTTA, P.P.; VALADARES, R.F.D.; SILVA B.C.; PACHECO, M.V.C. Intake, apparent digestibility, and nutrient requirements for growing Nellore heifers and steers fed two levels of calcium and phosphorus. Livestock Science, vol.181, pp. 17-24, 2015b.
YAN, T.; MAYNE, C.S.; PATTERSON, D.C.; AGNEW, R.E. Prediction of body weight and empty body composition using body size measurements in lactating dairy cows. Livestock Science, vol. 124, n°1, pp. 233-24, 2009.
FOX, D.G.; TYLUTKI, T.P.; VAN AMBURGH, M.E.; CHASE, L.E.; PELL, N.A.; OVERTON, T.R.; TEDESCHI, L.O.; RASMUSSEN AND DURBAL, V.M. The net carbohydrate and protein system for evaluating herd nutrition and nutrient excretion (AnSci Mineo 213 Ed.). Animal Science Department, Cornell University, Ithaca, NY, 2000.
HALE, W.H. Influence of processing on the utilization of grains (starch) by ruminants. Journal of Animal Science, vol. 37, n°1, pp.1075-1085, 1973.
Braz. J. of Develop.,Curitiba, v. 6, n. 10, p. 82727-82740, oct. 2020. ISSN 2525-8761
MOORE, J.E.; BRANT, M.H.; KUNKLE, W.E.; HOPKINS, D.I. Effects of supplementation on voluntary forage intake, diet digestibility, and animal performance. Roche/ASAS Foundation Beef Cattle Nutrition Symposium: Forage Supplementation and Grazing. University of Florida, Gainsville, 2014.
NRC. NATIONAL RESEARCH COUNCIL. The nutrient requirements of beef cattle. 7th ed. Washington, DC, USA: National Academy Press, 2016.
NOCEK, J.E.; TAMMINGA, S. Site of digestion of starch in the gastrointestinal tract of dairy cows and its effect on milk yield and composition. Journal of Dairy Science, vol.74, n°1, pp.3598-3613, 1991.
OLIVEIRA, A.H.; CARNEIRO, M.S.; SALES, R.O. Value Nutritive of Bakery the aliment by sheep. Pubvet, vol. 5, n°2, pp.1043-1055, 2011.
OFFCIAL METHODS OF ANALYSIS. Association of Official Analytical Chemists, 15th ed, 1990. PASA, C. (2010). Relation reproduction animal and minerals. Biodiversity Review, vol. 1, pp. 101-122, 2010.
PASSINI, R.; SPERS, A.; LUCCI, C.S. Level of partial substitute of corn no diet vs Bakery in the performance Holstein beef cattle. Brazilian Livestock Review, 36(4):689-694, 2010.
PIMENTA, J.L.L.A.; FILHO, C.A.S.; MACEDO, K.B.R.; MAIA, A.M.; LIMA, L.S. Economic feasibility of diets containing different nitrogen sources as a function of weight gain in Saanen breed goats. Brazilian Journal of Develpment, v. 6, n. 3, p. 11028-11037, 2020.
QUEIROZ, S.A. Introduction to breeding beef cattle. Gaiba: Agrobooks, 2012.
SNIFFEN, C.J.; O’CONNOR, J.D.; VAN SOEST, P.J.; FOX, D.G.; RUSSEL, J.B. A net carbohydrate and protein system for evaluating diets: II Carbohydrate and protein availability. Journal of Animal Science, vol. 70, pp.3562-3577, 1992.
VAN SOEST, P.J., ROBERTSON, J.B., LEWIS, B.A. Methods for dietary fiber, neutral detergent fiber, and non-starch polysaccharides in relation to animal nutrition. Journal of Dairy Science, vol.74, n° 10, pp.3583-3597, 1991.
TEDESCHI, L.O.; CHALUPA, W.; JANCZEWSKI, E.; FOX, D.G.; SNIFFEN, C.; MUNSON R. Evaluation and application of the CPM Dairy Nutrition model. Journal Agriculture Science, vol. 146, n°2, pp.171-182, 2008.
TEDESCHI, L.O., FOX, D.G. Using mathematical nutrition models to improve beef cattle efficiency. Texas A&M University System, 95-103pp, 2006.
THEURER, C.B. (1986). Summary of steam-flaking corn of sorghum grain for lactating dairy cows. Journal of Dairy Science, vol. 82, n° 1, pp.1950-1965.