Food Science and Technology ISSN 0101-2061
DI:
D http://dx.doi.org/10.1590/1678-457X.6537
1 Introduction
For several thousands of years, people have been producing bread in different forms. It constitutes the basis of a human diet in all parts of the world (Dewettinck et al., 2008). Due to the growing assortment of cereal preparation products, bread consumption is in decline. Dne method for encouraging consumers to eat bread is to enrich it with bioactive substances. These substances increase the salutogenic effect of food on the human body (Siró et al., 2008). Dne such salutogenic food product is bread enriched with oat-derived β-glucan. Research has demonstrated that β-glucans positively influence human health. The salutogenic properties of β-glucan include lowering cholesterol level, reducing insulin production, body mass control, long-lasting satiety and decreasing blood pressure, among others. Water-soluble β-glucans lower the low-density lipoprotein (LDL) levels in the serum with no effect on the high-density lipoprotein (HDL) levels or the triacylglycerol (TAG) levels (Wood, 2007). An increase in the viscosity of β-glucan in the gastrointestinal tract causes intestinal motility to decelerate, delaying gastric emptying and decreasing the absorption of simple carbohydrates (Lazaridou et al., 2007). Jaskari et al. (1998) demonstrated that β-glucans are a potential prebiotic with a positive impact on the development of intestinal microflora. As early as in the mid-nineties, the USA Department of Agriculture allowed the claim that β-glucan reduced the risk of coronary heart disease and the recommendation that 0.75 g of β-glucan should be in one serving of food (Flander et al., 2007). In Europe, current regulations (e.g., European Commission Regulation No. 1160/2011) allowed products to be marked with a
positive health claim in foods containing at least 1 g of β-glucan per serving whose amount is specified (European Food Safety Authority, 2010).
Furthermore, β-glucan, a hydrocolloid, may positively affect bread quality by extending its shelf life. The hydration properties of hydrocolloids contribute to sustained firmness and prevents dehydration during storage (Guarda et al., 2004). Mohamed et al. (2008) observed a delay in the hardening of bread containing β-glucan during storage. The bread production process is increasingly diversified. This is possible due to the constantly improved application of delayed baking technology, which involves freezing the intermediate product and baking or fermenting it at the distribution site. Here, β-glucan also has a positive effect on product quality due to increased water retention in the bread. Thus, the water does not freeze in significant quantities during the freezing process, which results in final products with similar qualities as ones developed with traditional methods (Kalinga & Mishra, 2009).
Wheat flour is unique among cereals due to its ability to form a three-dimensional structure when mixed with water. Currently, wheat flour is the most important structural component for baking bread (Scheuer et al., 2011). The use of β-glucan in wheat bread is a new issue. Hence, suitable technology should be developed for industrial applications. Dn that basis, we sought to determine the influence of the degree of wheat flour extraction in the physicochemical and technological characteristics of breads with added β-glucans.
Influence of the wheat flour extraction degree in the quality of bread
made with high proportions of β-glucan
Marcin Andrzej KUREK1*, Jarosław WYRWISZ1, Monika PIWIŃSKA1, Agnieszka WIERZBICKA1
Received 21 Oct., 2014 Accepted 08 Mar., 2015
1Division of Engineering in Nutrition, Faculty of Human Nutrition and Consumer Sciences, Warsaw University of Life Sciences, Warsaw, Poland *Corresponding author: [email protected]
Abstract
β-glucan is currently one of the most important bioactive substances. Hence, there is a growing interest in the production of various foods containing β-glucan. The study examines the influence of the degree of wheat flour extraction in the quality of breads with high β-glucan content. Rheological tests were conducted on dough. Volume, mass, color and texture of bread were measured after baking. We observed that increasing the degree of extraction caused an increase in the storage and loss modulus. All of the bread made from the different flours were smaller in volume after the addition of β-glucan, although the yield increased. The crumb color of β-glucan-added breads was darker than the control samples. Control samples were higher in textural parameters (firmness, gumminess and chewiness). β-glucan-added samples had decreased porosity. The results revealed that using very strong flour with a high protein content results in a high quality β-glucan bread with a higher nutritional value due to the high total dietary fiber and β-glucan content.
Keywords: wheat bread; bakery; dietary fiber; β-glucan.
2 Materials and methods 2.1 Flours and dough assessment
Raw materials
The following wheat flour with different degrees of extraction were used: type 450 (pastry flour), type 550 (plain flour), type 650 (strong flour) and type 750 (very strong flour; Polskie Młyny, Inc., Poland). The fiber preparation consisted of 44% dietary fiber (23% soluble and 21% insoluble fractions) and contained 16 g of β-glucan per 100 g (Microstructure, Inc. Poland).
Flour content
The flours were examined with near-infrared spectroscopy (NIRFlex N-500, Buchi, Switzerland) for protein and ash content. The gluten content was determined with the AACC 38-10 method, as previously described (American Association of Cereal Chemists, 2000). The color of the flour was determined using the Minolta CR-400 colorimeter (Konica Minolta Inc., Japan; illuminant D65, measurement area ø=8mm, standard observers 2°), and the results were expressed in accordance with the CIELab color space. The analyzed parameters were L (L = 0 (black) and L = 100 (white)), a (– a = greenness and + a = redness), b (– b = blueness and + b = yellowness). Dne plate of each flour was analyzed with the colorimeter 10 times in different locations.
Dough rheology
Rheological measurements on dough were conducted with the Haake RT 20 rheometer (Haake, Germany) on a 2 g piece of dough without yeast as presented in Table 1. A forced oscillation (DSC) test was conducted in the plate-plate geometry with a 2 mm gap, in triplicate. After determining the viscoelastic region, the following measurement parameters were chosen: the frequency of oscillation was 1 Hz, shear stress was 600 Pa, the sensor angle rotation was 2° and the temperature during measurement was 15°C. Measurements were performed in triplicate. G’ – Pa (storage modulus), G” – Pa (loss modulus), γ (deformation) and δ - ° (phase angle) were calculated.
2.2 Bread preparation and quality evaluation
Bread making procedure
The baking method was optimized and the ingredients are summarized in Table 1. To generate the dough, the ingredients were mixed for 5 min at 200 rpm in a TRQ-42, RM Spiral mixer (Gastro, Poland). Water was added based on rheological
measurements to achieve 500 BU (Brabender Units). 12 g of the fiber preparation was used per 100 g of the flour mixture to achieve a final amount of 0.75 g of β-glucan per serving for consumption in accordance with USA Food and Drug Administration (FDA) guidelines (Food and Drug Administration, 1997; Wood, 2010). Preliminary fermentation was conducted at 37 °C and 80% relative humidity for 1 h. The mixer bowl was turned once after 30 min, and the dough was divided into 350 g pieces. Each piece was inserted into forms where the proofing process took place until reaching oven maturity (37 °C, 80% relative humidity). The direct, single-phase method was used to bake the bread. Baking was conducted in a convection oven (CPE 110, Kuppersbuch, Germany) for 25 min at 180 °C.
Production yield and moisture content
The mass was measured before fermentation, instantly after baking and after cooling for 2 h. The yield was calculated as a mass of the final product after cooling for 100 g of flour-dietary fiber powder. The moisture was measured four times according to the AACC Method 10-50.01.
Specific volume
The volume of baked bread rolls during storage was determined according to the rapeseed displacement method (López, 2014). The results are the average of four replicates and presented as volume in mL/g of product.
Crumb color
Color determinations were carried out on bread crumbs 3 h after baking using the Minolta CR-400 colorimeter with the same settings as described for the flour color measurements. Three difference slices were analyzed for color 10 times.
Bread texture
Mechanical characteristics of bread in a double compression cycle were recorded in the Instron 5965 Universal Testing Machine (Instron, USA) with the maximal load of 500 N, 50% penetration depth with a 40 mm diameter probe and a 20 s gap between cycles on 20 × 20 × 20 mm crumb cubes. Measurements were taken 3 h after baking. The results were expressed as the maximum level of firmness, gumminess and chewiness.
Porosity
The loaf was cut into 2.5 cm thick slices. Each slice was photographed with a digital camera (QImagining, Micro Publisher 5.0 RTV) using lighting from lamps (Dsram Dulux L 36W/954, day-light) and the 5400 K color temperature. The TIFF images were then analyzed with ImageJ (version 1.44; Wayne Rasband, National Institutes of Health, USA). The central image of the crumb was selected and the area was determined. To obtain a black and white threshold, the image was converted into 8-bit and binary segmentation was performed. The results were presented as a percentage of pore area in the total area.
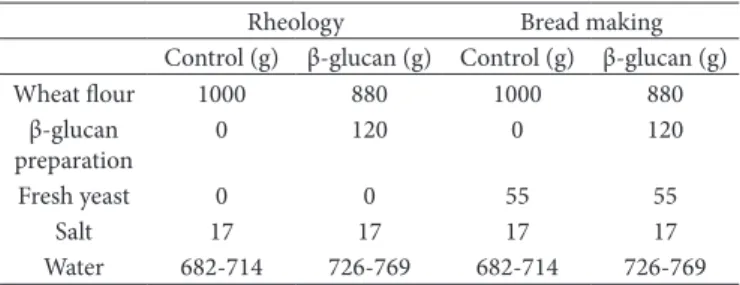
Table 1. The ingredients of dough and breads used in this study. The control sample does not include the addition of dietary fiber.
Rheology Bread making
Control (g) β-glucan (g) Control (g) β-glucan (g)
Wheat flour 1000 880 1000 880
β-glucan preparation
0 120 0 120
Fresh yeast 0 0 55 55
Salt 17 17 17 17
Overall acceptability
The quality of the bread was evaluated with organoleptic assessment tests, using a hedonic scoring system ranging from 1 (lowest) to 9 (highest). 25 panelists were selected from post-graduate students and teachers at the Division of Engineering in Nutrition. All the members of the panel were experienced and familiar with the hedonic scale test system.
2.3 Total dietary fiber and β-glucan determination
The total dietary fiber (TDF) in baked bread was measured according to the AACC 32-45.01 method (American Association of Cereal Chemists (2000). using the FDSS Fibertec E 1023 system (FDSS Inc., USA). β-glucan content was also measured in bread with the the β-glucan Assay Kit (Mixed Linkage), according to the manufacturer’s instructions (Megazyme, Bray, Ireland).
2.4 Statistical analysis
The results are presented as the mean value ± standard deviation. The results were submitted to one-way analysis of variance followed by Tukey’s test. For calculating the correlation between values the Pearson correlation matrix were performed. The statistical analysis was performed using Statistica 10 for Windows (StatSoft Inc., USA), while p≤0.05 was considered as significant.
3 Results and discussion 3.1 Flour and dough assessment
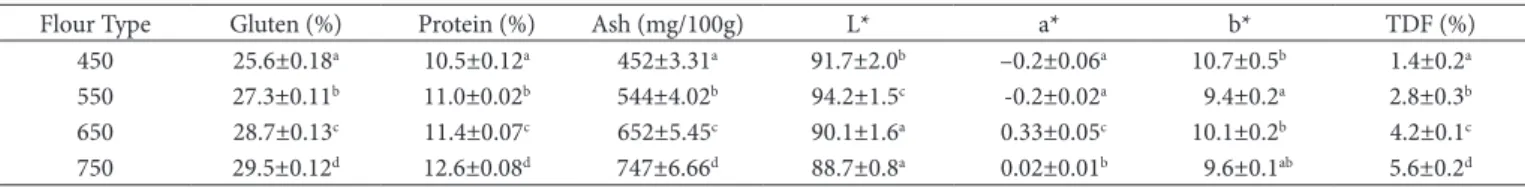
Flour composition
The flour composition is presented in Table 2. The flour was in good quality according to the standards of American Association of Cereal Chemists (2000). Significant differences were observed in gluten, protein and ash content. All three parameters increased as the degree of extraction increased and these changes were highly correlated (r = 0.93). This result is in agreement with the previous studies of Jaekel et al. (2012) which observed that ash content is directly related to fiber content. Examination of color revealed that the L* (lightness) value decreased with the increasing ash content and was also highly correlative (r = 0.92). It is likely due to the reduction in nutrient content caused by the process of milling which could result in higher lightness. There was no direct correlation between the ash content and a* and b* value (r = 0.54). Similarly, the TDF content was highly, positively correlated with flour type (r = 0.89), also corresponding to the previous observations from Jaekel et al. (2012).
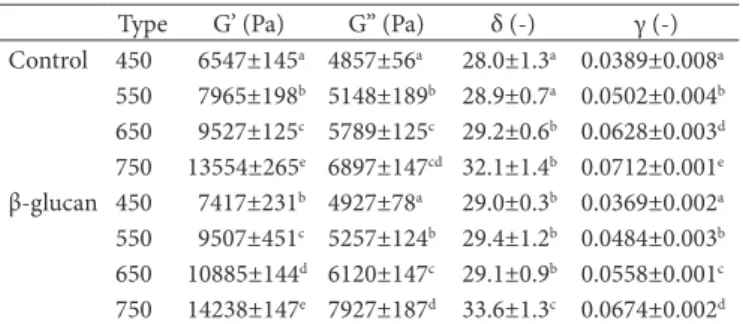
Dough rheology
The rheological measurements are presented in the Table 2. Rheological behaviors of dough can be evaluated in several ways; however, use of viscous modulus and elastic modulus are the two main options (Marti et al., 2014). As previously described for the gluten, protein, and ash content, the storage modulus (G’) and loss modulus (G”) increased with degree of extraction. The higher G’ values than G” indicate that the dough is more elastic than viscous. This could be caused by an interaction between the dietary fiber and gluten or other constituents of the dough, resulting in increased levels of high mass molecules (Sivam et al., 2011). G’ and G” were significantly different between the dough with and without the addition of β-glucan for type 450, type 550 and type 650 flours, but not for type 750. Bread volumes are positively correlated as demonstrated by G′ and G″ of the dough. Differences in phase angle (δ) could be observed for some of the flours but was significantly different for only type 750. Strong flour and good quality flour dough have lower δ values compared to the values of dough made from weak flour and poor quality flour (Moore & Hao, 2012). The higher δ value might be due to fewer entanglements or easily dissociated entanglements between the gluten proteins because of hydrophilic interactions. A previous study observed higher δ values for weaker gluten compared to stronger gluten (Marti et al., 2014). Furthermore, the deformation (γ) increased with the ash content. This is likely caused by the gluten content in the dough and was highly correlated (r = 0.95). Abnormal water absorption of the dough, due to the addition of fiber, results in inferior viscoelastic properties of the dough as the dough has increased water-holding abilities. Therefore, increasing the fiber amount could reduce dough stability (Villarino et al., 2014). However, cereal β-D-glucans are useful substances in functional food preparation, especially in the bakery, because of their excellent rheological properties (Sadiq Butt et al., 2008), which are confirmed in the study.
3.2 Bread properties and quality evaluation
Production yield and moisture content
The production yield is presented in Tables 3 and 4. The yield was highest in type 750 and lowest in type 450, likely due to the higher amount of dietary fiber in the more highly extracted flour. The production yield is strictly correlated to the moisture content of the bread (Figure 1). Therefore, the dietary fiber could absorb water that does not evaporate during the baking process, resulting in increased moisture content (Salehifar & Shahedi, 2007). Significantly, the moisture content in type 750 was significantly higher than other samples in both with and without the addition of β-glucan.
Table 2. Evaluation of flour characteristics.
Flour Type Gluten (%) Protein (%) Ash (mg/100g) L* a* b* TDF (%)
450 25.6±0.18a 10.5±0.12a 452±3.31a 91.7±2.0b –0.2±0.06a 10.7±0.5b 1.4±0.2a
550 27.3±0.11b 11.0±0.02b 544±4.02b 94.2±1.5c -0.2±0.02a 9.4±0.2a 2.8±0.3b
650 28.7±0.13c 11.4±0.07c 652±5.45c 90.1±1.6a 0.33±0.05c 10.1±0.2b 4.2±0.1c
750 29.5±0.12d 12.6±0.08d 747±6.66d 88.7±0.8a 0.02±0.01b 9.6±0.1ab 5.6±0.2d
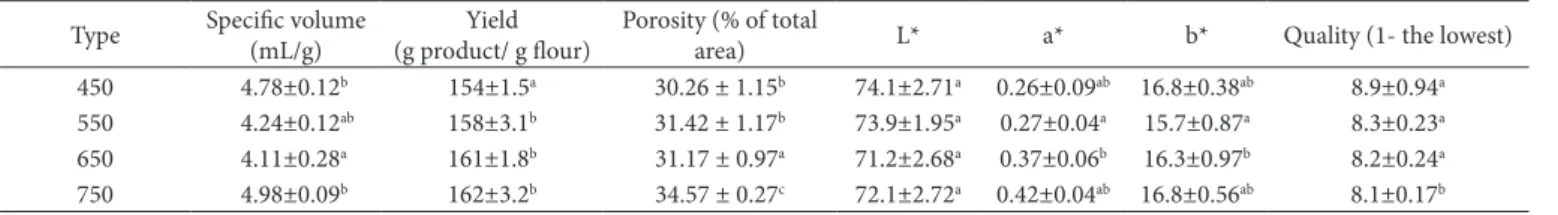
Specific volume
The results are presented in Tables 3 and 4. The specific volume does not differ significantly between the breads using different flour types and did not correspond to the presence of addition of dietary fiber. The largest volume is observed in bread with the highest protein content, as previously described (Scheuer et al., 2011). A linear relationship between protein content and loaf volume of pan breads has previously been reported (Salehifar et al., 2010). The bread volume decreases slightly after the addition of β-glucan, possibly due to CD2 gas retention, weakening the dough (López et al., 2013). Additionally, considerable amounts of water could have sturdily bound to the supplemented fibers during baking. Thus, less water would be available for gluten and starch to cross-link and form a network, resulting in an immature gluten network and decreased loaf volume (Marti et al., 2014).
Crumb color
The crumb color parameters are presented in Table 5. The L* decreased with the higher flour type. This is due to a higher content of constituents which are not bright, especially dietary fiber. However, there was no evident trend in the a* and b* parameters. The level of different additives are known to be responsible for crumb color (Lemos et al., 2012).
Bread texture
The results of texture measurements are presented in Figures 2 and 3. Bread from all flour types had the highest values for firmness, followed by gumminess and lastly, chewiness (Yao et al., 2011). Type 450 had the highest values for the tested characteristics while type 550 had the lowest recorded values in both control and β-glucan-added samples. The firmness of the bread is due to cross-linked gluten proteins with moderately solubilized starch. Water acts like a plasticizer or catalyst and thus, is considered to be one of the most vital elements in bread making. Decrement of water or moisture quickens the process of cross-linking protein and starch, which further expedites the process of firming the bread (Rosell, 2011). Moreover, absorption by dietary fibers results in less water that is available for the development of the gluten network. Significantly, β-glucan increases bread firmness while maintaining a higher moisture content, in contrast to other fibers. β-glucan is able to develop the hydrogel structure which could result in a stiffer dough and bread but also absorbs a high amount of water during the heating process (Dliveira et al., 2012).
Porosity
The next physical characteristic measured was the porosity of the bread (Table 5). The most porous bread was made from type 750 flour, followed by type 550. The least porous bread was type 450. Porosity was correlated with volume (r=0.82), similar to previous observations (López, 2014). Porosity was higher in the bread with added dietary fiber, corresponding to the studies of Lazaridou et al. (2007) which described how β-glucan improved wheat bread crumb grain by stabilizing air cells in the bread dough and preventing coalescence of the cells.
Overall acceptability
The nine point hedonic scale is considered to be a sufficient quality threshold for food matrixes (Lemos et al., 2012). The overall acceptability was significantly highest in the bread from type 750 (Tables 3 and 4), although there were no significant
Table 3. Bread characteristics from different types of flour without the addition of β-glucan.
Type Specific volume (mL/g)
Yield (g product/ g flour)
Porosity (% of total
area) L* a* b* Quality (1- the lowest)
450 4.78±0.12b 154±1.5a 30.26 ± 1.15b 74.1±2.71a 0.26±0.09ab 16.8±0.38ab 8.9±0.94a
550 4.24±0.12ab 158±3.1b 31.42 ± 1.17b 73.9±1.95a 0.27±0.04a 15.7±0.87a 8.3±0.23a
650 4.11±0.28a 161±1.8b 31.17 ± 0.97a 71.2±2.68a 0.37±0.06b 16.3±0.97b 8.2±0.24a
750 4.98±0.09b 162±3.2b 34.57 ± 0.27c 72.1±2.72a 0.42±0.04ab 16.8±0.56ab 8.1±0.17b
Means ± standard deviations. Values in the columns followed by the same letter are not significantly different (p ≤ 0.05).
Table 4. Bread characteristics from different types of flour with the addition of β-glucan.
Type Specific volume (mL/g) (g product/ g flour)Yield Porosity (% of total area) L* a* b* Quality (1- the lowest) 450 4.52±0.19b 164±2.5a 28.57 ± 1.04b 64.1±3.79a 0.26±0.06ab 15.8±0.33ab 7.9±0.59a
550 4.09±0.27ab 167±3.2a 32.38 ± 1.75b 66.0±1.53a 0.12±0.03a 15.2±0.93a 8.1±0.25a
650 3.87±0.24a 172±2.9b 31.18 ± 0.77a 65.0±3.72a 0.68±0.09b 17.2±1.38b 7.8±0.55a
750 4.66±0.14b 178±4.2b 39.27 ± 0,71c 62.9±3.81a 0.55±0.04ab 16.2±0.48ab 8.6±0.12b
Means ± standard deviations. Values in the columns followed by the same letter are not significantly different (p ≤ 0.05).
differences between the other types. Such observations are similar to the results of other authors, that the protein content of the flours did not change the organoleptic consideration of the final product (Salehifar & Shahedi, 2007). The overall quality was assessed higher in the control samples because of consumer habit to wheat bread.
TDF content
TDF content in the examined breads is presented in Table 6. TDF content was highest in the bread from type 750 and smallest in type 450. There were no significant differences between type 550 and type 650. Dnly the type 750 bread could be considered to have a high dietary fiber level, as previously published (Jaekel et al., 2012).
4 Conclusions
β-glucan is a very important bioactive substance that could be used in fortifying wheat bread. Importantly, consumers are already used to this product and unlikely to find oat products or the flour itself highly palatable. Thus, it would be greatly beneficial to produce the highly consumed wheat bread with an increased nutritional value. The nutritional recommendation for bread intake is set between 200 and 300 g of bread per day (Ishida et al., 2014). Consequently, an intake of the nutritionally recommended amount of bread along with an intake of β-glucan that is sufficiently high should have health promoting effects. Dur study revealed that the more significant results were gained when the very strong 750 flour was used as the raw material for making bread with added β-glucan. Thus, an intake of four servings a day of this bread might contribute to reduced blood cholesterol levels. These results could lead to the use of the appropriate flour type in practical applications that could have great health benefits.
Acknowledgements
The study was performed within the Project No. PDIG.01.03.01-14-041/12 “Bioproducts, innovative technologies of pro-health bakery products and pasta with reduced caloric value” and co-financed by the European Regional Development Fund under the Innovative Economy Dperational Programme 2007–2013.
References
American Association of Cereal Chemists – AACC. (2000). Approved methods of the American Association of Cereal Chemists (10th ed.). St. Paul.
Dewettinck, K., Van Bockstaele, F., Kühne, B., Van de Walle, D., Courtens, T. M., & Gellynck, X. (2008). Nutritional value of bread: Influence of processing, food interaction and consumer perception. Journal of Cereal Science, 48(2), 243-257. http://dx.doi.org/10.1016/j. jcs.2008.01.003.
European Food Safety Authority - EFSA. (2010). Scientific Dpinion on the substantiation of a health claim related to oat β-glucan and lowering blood cholesterol and reduced risk of (coronary) heart disease pursuant to Article 14 of Regulation (EC) No 1924/2006. EFSA Journal, 8(12), 1-15. http://dx.doi.org/10.2903/j.efsa.2010.1885. Flander, L., Salmenkallio-Marttila, M., Suortti, T., & Autio, K. (2007).
Dptimization of ingredients and baking process for improved wholemeal oat bread quality. LWT-Food Science and Technology, 40(5), 860-870.
Figure 2. The texture parameters for bread from different types of flour without the addition of β-glucan. Means ± standard deviations. Values followed by the same letter are not significantly different (p ≤ 0.05).
Table 5. The rheological measurements for dough without and with the addition of β-glucan.
Type G’ (Pa) G” (Pa) δ (-) γ (-) Control 450 6547±145a 4857±56a 28.0±1.3a 0.0389±0.008a
550 7965±198b 5148±189b 28.9±0.7a 0.0502±0.004b
650 9527±125c 5789±125c 29.2±0.6b 0.0628±0.003d
750 13554±265e 6897±147cd 32.1±1.4b 0.0712±0.001e
β-glucan 450 7417±231b 4927±78a 29.0±0.3b 0.0369±0.002a
550 9507±451c 5257±124b 29.4±1.2b 0.0484±0.003b
650 10885±144d 6120±147c 29.1±0.9b 0.0558±0.001c
750 14238±147e 7927±187d 33.6±1.3c 0.0674±0.002d
Means ± standard deviations. Values in the columns followed by the same letter are not significantly different (p ≤ 0.05).
Table 6. The TDF and β-glucan content in bread from different types of flour with and without the addition of β-glucan.
Type TDF (%) β-glucan content (%)
Control β-glucan Control β-glucan 450 2.74±0.18a 4.65±0.18a 0.04±0.004a 0.78±0.04a
550 2.97±0.41b 5.30±0.27b 0.04±0.005a 0.81±0.04b
650 3.24±.0.47b 5.85±0.24b 0.05±0.006a 0.79±0.03a
750 4.94±0.63c 6.34±0.21c 0.04±0.004a 0.84±0.02b
Means ± standard deviations. Values in the rows followed by the same letter are not significantly different (p ≤ 0.05).
Food and Drug Administration - FDA. (1997). FDA allows whole oats foods to make health claim on reducing the risk of heart disease (FDA Talk Paper). U.S. Department of Health and Human Services. Guarda, A., Rosell, C. M., Benedito, C., & Galotto, M. J. (2004).
Different hydrocolloids as bread improvers and antistaling agents. Food Hydrocolloids, 18(2), 241-247. http://dx.doi.org/10.1016/ S0268-005X(03)00080-8.
Ishida, P. M. G., & Steel, C. J. (2014). Physicochemical and sensory characteristics of pan bread samples available in the Brazilian market. Food Science and Technology, 34(4), 746-754.
Jaekel, L. Z., Silva, C. B., Steel, C. J., & Chang, Y. K. (2012). Influence of xylanase addition on the characteristics of loaf bread prepared with white flour or whole grain wheat flour. Food Science and Technology, 32(4), 844-849.
Jaskari, J., Kontula, P., Siitonen, A., Jousimies-Somer, H., Mattila-Sandholm, T., & Poutanen, K. (1998). Dat β-glucan and xylan hydrolysates as selective substrates for Bifidobacterium and Lactobacillus strains. Applied Microbiology and Biotechnology, 49(2), 175-181. http:// dx.doi.org/10.1007/s002530051155. PMid:9534257
Kalinga, D., & Mishra, V. K. (2009). Rheological and physical properties of low fat cakes produced by addition of cereal. Journal of Food Processing and Preservation, 33(3), 384-400. http://dx.doi. org/10.1111/j.1745-4549.2008.00260.x.
Lazaridou, A., Duta, D., Papageorgiou, M., Belc, N., & Biliaderis, C. G. (2007). Effects of hydrocolloids on dough rheology and bread quality parameters in gluten-free formulations. Journal of Food Engineering, 79(3), 1033-1047. http://dx.doi.org/10.1016/j.jfoodeng.2006.03.032. Lemos, A., Capriles, V. D., Pinto e Silva, M. E. M., & Arêas, J. A. G.
(2012). Effect of incorporation of amaranth on the physical properties and nutritional value of cheese bread. Food Science and Technology, 32(3), 427-431.
López, E. P. (2014). Influence of the addition of lupine protein isolate on the protein and technological characteristics of dough and fresh bread with added Brea Gum. Food Science and Technology, 34(1), 195-203.
López, E. P., Pérez, G. T., de Erramouspe, P. L. J., & Cuevas, C. M. (2013). Effect of Brea Gum on the characteristics of wheat bread at different storage times. Food Science and Technology, 33(4), 745-752. Marti, A., Bottega, G., Casiraghi, M. C., Faoro, F., Iametti, S., & Pagani, M. A. (2014). Dietary fibre enzymatic treatment: a way to improve the rheological properties of high-fibre-enriched dough. International Journal of Food Science & Technology, 49(1), 305-307. http://dx.doi. org/10.1111/ijfs.12293.
Mohamed, A., Rayas-Duarte, P., & Xu, J. (2008). Hard Red Spring wheat/C-TRIM 20 bread: Formulation, processing and texture analysis. Food Chemistry, 107(1), 516-524. http://dx.doi.org/10.1016/j. foodchem.2007.08.065.
Moore, J., & Hao, J. (2012). Antioxidant and Health Promoting Properties of Wheat (Triticum spp.). In L. Yu, R. Tsao & F. Shahidi (Eds.), Cereals and pulses (pp. 113-130). Dxford: Wiley-Blackwell.
Dliveira, L. C., Dliveira, M., Meneghetti, V. L., Mazzutti, S., Colla, L. M., Elias, M. C., & Gutkoski, L. C. (2012). Effect of drying temperature on quality of β-glucan in white oat grains. Food Science and Technology, 32(4), 775-783. http://dx.doi.org/10.1590/S0101-20612012005000105. Rosell, C. M. (2011). The science of doughs and bread quality. In V.
R. Preedy, R. R. Watson & V. B. Patel (Eds.), Flour and breads and their fortification in health and disease prevention (cap. 1, pp. 3-14). San Diego: Academic Press.
Sadiq Butt, M., Tahir-Nadeem, M., Khan, M. K., Shabir, R., & Butt, M. S. (2008). Dat: unique among the cereals. European Journal of Nutrition, 47(2), 68-79. http://dx.doi.org/10.1007/s00394-008-0698-7. PMid:18301937
Salehifar, M., Ardebili, M. S., & Azizi, M. H. (2010). Effect of wheat flour protein variations on sensory attributes, texture and staling of Taftoon bread. Food Science and Technology, 30(3), 833-837. http:// dx.doi.org/10.1590/S0101-20612010000300041.
Salehifar, M., & Shahedi, M. (2007). Effects of oat flour on dough rheology, texture and organoleptic properties of taftoon bread. Journal of Agricultural Science and Technology, 9, 227-234. Scheuer, P. M., Francisco, A., Miranda, M. Z., Dgilari, P. J., Torres, G.,
Limberger, V., Montenegr, F. M., Ruffi, C. R., & Biondi, S. (2011). Characterization of Brazilian wheat cultivars for specific technological applications. Food Science and Technology (Campinas.), 31(3), 816-826. http://dx.doi.org/10.1590/S0101-20612011000300041. Siró, I., Kápolna, E., Kápolna, B., & Lugasi, A. (2008). Functional
food. Product development, marketing and consumer acceptance: a review. Appetite, 51(3), 456-467. http://dx.doi.org/10.1016/j. appet.2008.05.060. PMid:18582508
Sivam, A. S., Sun-Waterhouse, D., Waterhouse, G. I. N., Quek, S., & Perera, C. D. (2011). Physicochemical properties of bread dough and finished bread with added pectin fiber and phenolic antioxidants. Journal of Food Science, 76(3), H97-H107. http://dx.doi.org/10.1111/ j.1750-3841.2011.02086.x. PMid:21535837
Villarino, C. B., Jayasena, V., Coorey, R., Chakrabarti-Bell, S., & Johnson, S. (2014). The effects of bread-making process factors on Australian sweet lupin-wheat bread quality characteristics. International Journal of Food Science & Technology, 49(11), 2373-2381. http://dx.doi. org/10.1111/ijfs.12595.
Wood, P. J. (2007). Cereal β-glucans in diet and health. Journal of Cereal Science, 46(3), 230-238. http://dx.doi.org/10.1016/j.jcs.2007.06.012. Wood, P. J. (2010). Dat and rye β-glucan: properties and function.
Cereal Chemistry, 87(4), 315-330. http://dx.doi.org/10.1094/ CCHEM-87-4-0315.