BJRS
RADIATION SCIENCES
05-03 (2017) 01-18A SIMPLE METHOD TO BACK-PROJECT ISOCENTER
DOSE OF RADIOTHERAPY TREATMENTS USING EPID
TRANSIT DOSIMETRY
T. B. Silveira
1,2; B. Q. Cerbaro
2; L. A. R. da Rosa
2.
1Instituto Nacional de Câncer, Praça da Cruz Vermelha 23, Centro, 23230-130, Rio de Janeiro, Brazil. 2Instituto de Radioproteção e Dosimetria, CNEN, Av. Salvador Allende, Barra da Tijuca, 22783-127, Rio de Janeiro,
Brazil.
thiago.fisimed@gmail.com / tbsilveira@inca.gov.br
ABSTRACT
The aim of this work was to implement a simple algorithm to evaluate isocenter dose in a phantom using the back-projected transmitted dose acquired using an Electronic Portal Imaging Device (EPID) available in a Varian Trilogy accelerator with two nominal 6 and 10 MV photon beams. This algorithm was developed in MATLAB language, to calibrate EPID measured dose in absolute dose, using a deconvolution process, and to incorporate all scattering and attenuation contributions due to photon interactions with phantom. Modeling process was simplified by using empirical curve adjustments to describe the contribution of scattering and attenuation effects. The implemented algorithm and method were validated employing 19 patient treatment plans with 104 clinical irradiation fields projected on the phantom used. Results for EPID absolute dose calibration by deconvolution have showed percent deviations lower than 1%. Final method validation presented average percent deviations between isocenter doses calculated by back-projection and isocenter doses determined with ionization chamber of 1,86% (SD of 1,00%) and -0,94% (SD of 0,61%) for 6 and 10 MV, respectively. Normalized field by field analysis showed deviations smaller than 2% for 89% of all data for 6 MV beams and 94% for 10 MV beams. It was concluded that the proposed algorithm possesses sufficient accuracy to be used for in vivo dosimetry, being sensitive to detect dose delivery errors bigger than 3-4% for conformal and intensity modulated radiation therapy techniques.
1. INTRODUCTION
Over the years, radiotherapy has established itself as a leading modality for the treatment of malignant tumors, through the insertion of modulated techniques of IMRT (Intensity Modulated Radiation Therapy) and VMAT (Volumetric Modulated Radiation Therapy), as well as improvement in patient positioning accuracy using image-guided radiotherapy (IGRT).
These technological advances were followed up by major concerns on quality assurance (QA) procedures and equipment performance tests [1]. Additionally, achieving precision and reproducibility of treatments is one of the primary objectives of a comprehensive quality assurance program in radiotherapy [2]. Among all methods of error detection and dose delivery deviations measurements, in vivo dosimetry relies among the most efficient. It is preconized when a radiotherapy department adds a new technology or treatment modality, to verify complex dose delivery or even in daily routine to identify gross errors that might occur [3].
The advent of Electronic Portal Imaging Devices (EPID) facilitated the acquisition of digital images of patient positioning and gave rise to a series of studies on its dosimetric properties, principally considering modern devices using amorphous silicon detectors [4,5]. Presently the use of EPIDs is widespread for modulated techniques pre-treatment verifications and some studies already demonstrated its application in both in vivo and phantom transit dosimetry [6,7]. Mans et al. [8] highlighted the importance of this modality on clinical routine after detecting only 17 errors, of which more than a half of them would not be observed using other QA methods, among 4337 patients during an EPID in vivo evaluation study.
Among all modalities described for in vivo dosimetry, the most efficient on catching errors of different kinds, such as positioning, prescription, anatomic variation and dose delivery deviation, were those that use transit dose measurements [9]. Dahlgren et al. [10] and Spezi et al. [11] have created methods to predict dose transmitted by the patient and collected at EPID level using refined algorithms of dose calculation, as Monte Carlo or Superposition Convolution. Piermattei et al. [12] and Putha et al. [13] have studied methods of in vivo punctual isocenter dose reconstruction. The former used anatomic information provided by treatment planning computed tomography on the algorithm of back projection of isocenter dose. The latter adjusted EPID measurements using a Farmer ionization chamber (0,6 cm3) affixed on top of EPID cover. Recently, Mijnheer et al. [14] and Celi et al. [15] have published results of their clinical experience using advanced tridimensional reconstruction and back projected transit dose measurements.
It is observed that the major challenges for an adequate, efficient and reliable methodology for the application of in vivo dosimetry with EPID are: the creation of methods that use the patient's online anatomical information (i.e. IGRT with cone-beam computed tomography - CBCT), the use of transmitted dose images as the primary and exclusive source for calculating the back-projected doses (without reference to the auxiliary detectors) and the use of computational methodologies and simple algorithms for greater agility in the analysis process and response.
Therefore, the aim of this paper was to develop and establish a simple algorithm to back project transmitted doses for isocenter treatment using static gantry techniques, as conformal radiotherapy (3DCRT) and IMRT. The proposed algorithm was based on empirical measurements in solid water associated to a deconvolution process of EPID images and back projection of delivered doses to obtain isocenter absorbed doses.
2. MATERIALS AND METHODS
2.1 Linear accelerator and EPID.
The linear accelerator used to carry out all characterization measurements and to validate the proposed algorithm was a Trilogy (Varian Medical Systems, Palo Alto, CA), with two photon beams available, namely 6 and 10 MV. It is equipped with an amorphous silicon EPID model aS500-II and On-board Imager (OBI). The aS500-II is composed of an image detection unit model IDU 20, a third-generation image acquisition system (IAS3) and a mechanical arm attached to the accelerator. EPID useful detection area at isocenter level is 40x30 cm2 and its images are generated with a resolution of 512x384 pixels.
The EPID works with a range of image acquisition modes, the one used for portal dosimetry is named integrated image. When this acquisition mode is selected, the EPID captures a group of frames, at a rate of approximately 9.5 frames/second, during all beam-on time for a field. After beam stops, all frames are processed to compose a unique digital image, already converted to dose by an arbitrary unit named Calibration Unit. More details on this dosimetric calibration and detector characteristics were provided elsewhere [6].
2.2 The back-projection dose algorithm at isocenter.
The basic operation principle of the proposed algorithm was to mathematically process dosimetric images (integrated image) acquired with EPID positioned at the exit of the radiation field after its interaction with a phantom. The algorithm was fully written in MATLAB language (Math Works Inc., Natick, MA), version R2015a, due to its efficiency in reading and interpreting data from DICOM images (Digital Imaging and Communications in Medicine) and performing matrix operations.
The standard EPID positioning for all measurements was at a source detector distance of 150 cm. In this configuration, the spatial resolution of acquired images was approximately 0.5 mm projected on the isocenter plane. Several phenomena of beam interaction were considered during the beam pathway until detection in the EPID: scattering in the EPID, scattering on air between phantom and EPID and scattering inside the phantom. These scattering effects together with an absolute dose calibration referenced to an ionization chamber made the basis of the dose calculation algorithm.
It should be emphasized that the algorithm always considered the physical thicknesses to calculate attenuation (equivalent water), and none heterogeneities correction was made.
The steps for characterization and adjustment of the correction factors considered in the algorithm for two photon energies, 6 and 10 MeV, are described in the following sections.
2.2.1 EPID scattering correction and absolute calibration.
As a first step, the algorithm defines the correction due to the difference in yield between the measured doses in the central axis of the EPID for different sizes of radiation field compared to the doses measured using an ionization chamber located at the same distance from the radiation source. That difference arises from the fact that EPID is not made of water equivalent material, thus its inner scattering is peculiar.
Measurements with ionization chamber were carried out with a Scanditronix-Wellhoffer model IC15 chamber, with a sensitive volume of 0.13 cm3, using a 30 mm diameter acrylic buildup cap to both qualities with the chamber effective point of measurement placed at 150 cm source detector distance. The same distance was used for EPID measurements. Square field sizes of 3x3, 4x4, 5x5, 8x8, 10x10, 12x12, 15x15 and 20x20 cm2 were irradiated. The final dose for both
dosimetric sets was taken as the average of three measurements. The ionization chamber was previously calibrated in a 60Co source and all data was obtained by following recommendations and
correction factors proposed in the TRS No. 398 code of practice [16].
The doses in the central axis of the EPID were acquired by averaging the values registered in a 6x6 pixels area, approximately 9 mm2. This approach minimized misalignment deviations caused by uncertainties in EPID positioning.
The absolute dose conversion of EPID images can be described by equation 1. 𝐷𝑃𝑖𝑗 is the dose in the ij pixel of EPID as a function of the measured dose for each pixel in Calibration Units (𝑀𝑃𝑖𝑗), after a deconvolution by a Kernel shaped curve (𝐾𝑒𝑟𝑛𝑒𝑙𝐸𝑃𝐼𝐷) and fit by a correction factor
(𝐹𝑐). The Kernel shaped curve used followed the formulation developed by Wendling and collaborators [7], considering a Gaussian function with radial symmetry described in equation 2.
𝐷𝑃𝑖𝑗 = 𝑀𝑃𝑖𝑗 ⊗−1𝐾𝑒𝑟𝑛𝑒𝑙𝐸𝑃𝐼𝐷 𝑖𝑗. 𝐹𝐶 (Equation 1) 𝐾𝑒𝑟𝑛𝑒𝑙𝐸𝑃𝐼𝐷𝑖𝑗 = 𝐶1 . {𝐶2 𝑒−µ𝑟𝑖𝑗 𝑟𝑖𝑗2 𝑝𝑎𝑟𝑎 𝑟𝑖𝑗 ≠ 0 1 𝑝𝑎𝑟𝑎 𝑟𝑖𝑗 = 0 (Equation 2)
where 𝑟𝑖𝑗 was the distance between the ij pixel and the central axis of the image. The values for C1,
C2, µ and FC were obtained by an iterative process aiming the best fit to minimize the differences
between dose values measured on central axis of EPID and with the ionization chamber.
2.2.2 Correction of EPID response after phantom interaction.
A phantom positioned between the original radiation fluence and the detector scatters the photons. This interaction contributes to the total amount of transmitted dose measured on EPID. One can define the primary dose fluence collected in EPID (𝐹𝑙𝑢𝑖𝑗𝑃𝑟𝑖) after phantom transmission as a function of the total dose measured in EPID (𝐷𝑃𝑖𝑗) and additional scattering contribution for
phantom insert on EPID (𝑆𝑐𝑎𝑖𝑗𝑃ℎ𝑎𝑛𝑡−𝐸𝑃𝐼𝐷) as described by equation 3.
According to Wendling et al. [7], this radiation scattering contribution is related to the exposed area and can be described as a function of total transmission (𝑇𝑖𝑗𝑡𝑜𝑡𝑎𝑙) measured by the portal imaging device, a ratio between the measurements with and without phantom as attenuation material, by the following equation:
𝑇𝑖𝑗𝑡𝑜𝑡𝑎𝑙 = 𝑇𝑖𝑗𝑝𝑟𝑖 − 𝑆𝑐𝑎𝑖𝑗
𝑃ℎ𝑎𝑛𝑡−𝐸𝑃𝐼𝐷
𝐷𝑃𝑖𝑗𝑎𝑖𝑟 (Equation 4)
whereupon 𝐷𝑃𝑖𝑗𝑎𝑖𝑟 is the EPID measured dose calculated by equation 2 for a direct irradiation and 𝑇𝑖𝑗𝑝𝑟𝑖 is the primary transmission of the beam. This primary transmission represents the dose interacting component transmitted by the phantom and incident on the EPID. By definition, is also independent of the irradiated area and can be approximated by the total transmission of an infinitesimal field size [7]. Authors observed that this scattering contribution is also strongly influenced by dose variations within the irradiated area.
To consider the impact of additional scattering contribution and its incorporation in the back-projection algorithm, measurements were carried out in a solid 20 cm edge cubic water phantom with its geometric center positioned at the isocenter of the accelerator. Square field sizes of 3x3, 4x4, 5x5, 8x8, 10x10, 12x12, 15x15 and 20x20 cm² were irradiated. To analyze dose variations inside irradiated area dependence, all previously mentioned fields were also irradiated using dynamic filters (EDW) with angulations of 30 and 60 degrees. By fitting a polynomial curve of total transmission versus irradiated area and projecting the zero area, the values of 𝑇𝑖𝑗𝑝𝑟𝑖 were obtained for each photon energy. The additional scattering contribution was calculated as a single, uniform approximate factor for the whole dose matrix as a simplification of equation 4. A graphic of 𝑆𝑐𝑎𝐶𝐴𝑋𝑃ℎ𝑎𝑛𝑡−𝐸𝑃𝐼𝐷 versus dose pixel intensity values summation (Ʃ𝐷𝑃𝑖𝑗𝑃ℎ𝑎𝑛𝑡) was plotted using these data, in association with the primary and total transmission values.
2.2.3 Primary dose calculation in the phantom.
Calculation of primary dose inside the phantom (𝐷𝑖𝑗𝐼𝑠𝑜−𝑃𝑟𝑖) is dependent on the primary fluence (𝐹𝑙𝑢𝑖𝑗𝑃𝑟𝑖) through the phantom, on the inverse square law to consider the distance of detection to isocenter and on the length of attenuation material from isocenter to the surface of
beam exit. The source-detector distance to EPID was fixed, 150 cm, and the isocenter was always located at 100 cm from the beam source. The process of beam interaction, from the point of interest of reconstruction to the exit of the phantom is given in equation 5, which is a function of the total phantom thickness (Ltotal) and primary transmission (𝑇𝑝𝑟𝑖).
𝐷𝑖𝑗𝐼𝑠𝑜−𝑃𝑟𝑖 = 2,25 . 𝐹𝑙𝑢𝑖𝑗𝑃𝑟𝑖. 1 (𝑇⁄ 𝑝𝑟𝑖𝐿𝑒𝑥𝑖𝑡⁄𝐿𝑡𝑜𝑡𝑎𝑙) (Equation 5)
2.2.4 Calculation of scattering dose contribution inside phantom.
The scattering dose inside phantom was difficult to model due to its dependency on several factors such as phantom width, irradiation area and intensity. Usually, treatment planning systems calculate doses using convolution and superposition algorithms to completely describe that phenomenon. To simplify the proposed algorithm for back-projection, a procedure was chosen to use empirical reference doses measured with ionization chambers and curve fitting processes to obtain scattering factors due to the phantom thickness and due to the radiation intensity, ScaPhant-Thick and ScaPhant-Int, respectively. This approach differs remarkably from the method proposed by Wendling and collaborators [9], simplifying the previous methodology. Therefore, the total scattering inside phantom can be described as:
𝑆𝑐𝑎𝑖𝑗𝐼𝑠𝑜 = 𝑆𝑐𝑎𝑖𝑗𝑃ℎ𝑎𝑛𝑡−𝑇ℎ𝑖𝑐𝑘. 𝑆𝑐𝑎𝑖𝑗𝑃ℎ𝑎𝑛𝑡−𝐼𝑛𝑡 (Equation 6)
𝑆𝑐𝑎𝐶𝐴𝑋𝑃ℎ𝑎𝑛𝑡−𝑇ℎ𝑖𝑐𝑘 was closely related to the primary transmission. The larger the phantom width, the lower the primary transmission and the higher the scattering contribution due to the radiation attenuation inside the material. In order to model this phenomenon a phantom was irradiated considering fixed radiation field size, 10x10 cm2, and dose, but varying phantom width
from 5 to 25 cm. To quantify the contribution of scattering within the phantom due to the variation of the irradiated area, a 15 cm fixed thickness phantom of solid water was irradiated for square fields of 3x3, 4x4, 5x5, 8x8, 10x10, 12x12, 15x15 and 20x20 cm². Doses were measured with an ionization chamber placed at the isocenter. 𝑆𝑐𝑎𝐶𝐴𝑋𝑃ℎ𝑎𝑛𝑡−𝑇ℎ𝑖𝑐𝑘 and 𝑆𝑐𝑎𝐶𝐴𝑋𝑃ℎ𝑎𝑛𝑡−𝐼𝑛𝑡 were modeled by means of a curve fitting of its value as a function of the phantom thickness and irradiated area, respectively.
2.2.5 Final dose at treatment isocenter.
The algorithm to achieve final dose at the treatment isocenter is composed of:
EPID image deconvolution and absolute dose conversion, with and without phantom; Calculation of scattering contribution in air between phantom and EPID using fitted
curve and pixel intensity summation;
Primary transmission calculation using total transmission and additional scattering contribution for phantom insert EPID;
Calculation of primary fluence at EPID by equation 3;
Calculation of entrance and exit path lengths inside the phantom; Calculation of primary dose at isocenter by equation 5;
Calculation of attenuation dependent scattering contribution inside phantom using fitted curve and phantom thickness;
Calculation of intensity dependent scatter contribution inside phantom using fitted curve and irradiated area;
Quantification of total scattering inside the phantom by equation 6; and
Calculation of final dose at isocenter as a sum of primary dose and scattering contribution (equation 7).
𝐷𝐶𝐴𝑋𝐹𝑖𝑛𝑎𝑙 = 𝐷𝐶𝐴𝑋𝐼𝑠𝑜−𝑃𝑟𝑖+ 𝑆𝑐𝑎𝐶𝐴𝑋𝐼𝑠𝑜 (Equation 7)
2.3 Isocenter back-projection algorithm validation.
In order to evaluate and validate the algorithm described and implanted for back-projection of EPID measurements, comparative measurements using ionization chamber were carried out in a solid water phantom. The phantom was composed of 30 x 30 cm2 solid water plates, summing 19 cm of total thickness, with a small volume (0.13 cm3) ionization chamber placed 2.5 cm away from the geometric isocenter on the anterior-posterior axis. The ionization chamber was calibrated in water by cross-calibration to a Farmer type chamber that had been calibrated in 60Co source at a SSDL laboratory. All readings were corrected by influence factors according to TRS 398 [18]. The phantom was irradiated according to 19 treatment plans from previously treated patients. The
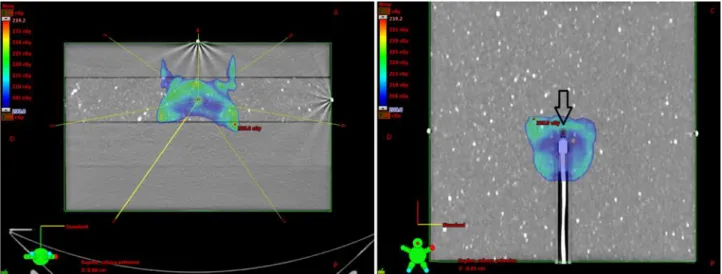
treatment planning system (TPS) used was Eclipse (Varian Medical Systems, Palo Alto, CA), version 8.6, using 3DCRT and IMRT techniques. Nine plans used 6 MV beams and ten plans used 10 MV beams, totalizing 53 and 51 irradiation fields, respectively. The algorithm used was the Analytical Anisotropic Algorithm (AAA) with no heterogeneity correction applied. Validation plans were chosen to contemplate an extensive range of therapeutic approaches, from box techniques with opposed fields to large IMRT fields with split fields requirements. In each case, by multiple irradiations with identical field setup of original plans, and projecting treatment isocenter at ionization chamber reference effective point, as showed in figure 1, a set of three data were obtained: the EPID with the direct irradiation (without phantom) of the detector positioned at 150 cm from the source, dose transmitted through the phantom measured in the EPID and, simultaneously to the second measurement, dose at the isocenter measured with the small volume camera. Both EPID results were mandatory input parameters to perform back-projection algorithm calculations. Furthermore, a cone-beam computed tomography was acquired before irradiation and all DICOM data were used as source of information to the algorithm to achieve attenuation thicknesses for each central axis projection along irradiation gantry angles.
Dose analysis were carried out for total accumulate dose at isocenter (DI) and field-by-field (DF), normalized to total isocenter dose, comparing back-projected results (DFEPID and DIEPID)
versus IC measurements (DFIC e DIIC). An analysis of deviations and correlations were made to
establish the intrinsic error associated to the implemented method and to quantify its sensibility in identifying small errors or discrepancies on dose delivery, aiming its use on in vivo dosimetry.
Figure 1: On the left, axial image showing incidence angles for one of the treatment plans used,
with isocenter positioned on the IC15 chamber. On the right, coronal image on IC plane highlighting the chamber delineation to compute dose on dose-volume histogram.
3. RESULTS
3.1 Correction due to inner scattering in EPID and absolute calibration.
After an iterative process, C1, C2, µ and FC values were obtained for the best fit of Kernel
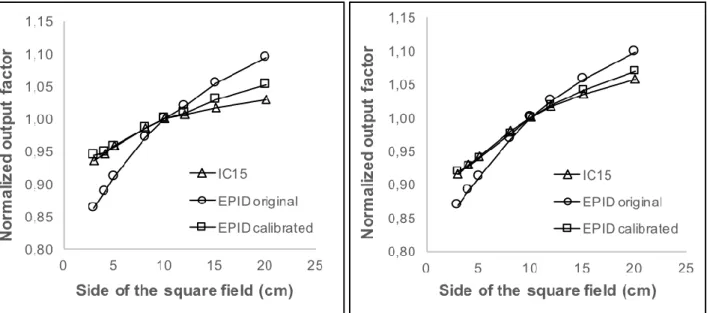
curves that describe EPID scattering, for both energies, as presented in table 1. In each attempt, the proposed Kernel curve was applied in a deconvolution of EPID images. To obtain central axis doses measured by the EPID, the overall fitting process was finalized when a good agreement was obtained, lower than 0,5%, between ionization chamber and EPID measurements for central axis doses considering all field size range. Mean deviation calculated comparing EPID and ionization chamber dose results were -0,20% and -0,26% to 6 and 10 MV, respectively. Figures 2 show output factors, normalized for a reference field of 10x10 cm2, for 6 MV.
Table 1: Factors obtained by iterative process to define Kernel shape curves to describe
EPID scattering. Beam C1 C2 µ Fc (cGy/CU) 6 MV 10 MV 1,028 0,892 5,00E-03 2,49E-03 2,20E-03 1,50E-03 160,0 105,2
Figure 2: Normalized output factor of 6 MV (left) and 10 MV (right) photons for ionization
chamber and EPID, before and after scattering compensation by deconvolution and absolute calibration.
3.2 EPID outcome correction after phantom interaction.
Primary transmission (𝑇𝑖𝑗𝑝𝑟𝑖) values of 0,3427 and 0,4694 were obtained for 6 and 10 MV, respectively, using a 20 cm thickness phantom. The graphics of the additional scattering contribution (𝑆𝑐𝑎𝑃ℎ𝑎𝑛𝑡−𝐸𝑃𝐼𝐷) versus pixel intensity summation of doses measured by EPID were plotted according to equation 4, for open field irradiations and dynamic wedges of 30 and 60 degrees. A linear fit was applied with good agreement for all the data, as presented in figure 3.
Figure 3: Air scattering between phantom and EPID versus pixel intensity
summation. Fitted curves for nominal energies 6 and 10 MV are presented.
3.3 Scattering correction inside the phantom.
As expected, it was observed that the contribution by primary transmission at the phantom isocenter reduces with increased phantom thickness. Using fitted curves for 𝑆𝑐𝑎𝐶𝐴𝑋𝑃ℎ𝑎𝑛𝑡−𝑇ℎ𝑖𝑐𝑘 and 𝑆𝑐𝑎𝐶𝐴𝑋𝑃ℎ𝑎𝑛𝑡−𝐼𝑛𝑡 the final scattering contribution was mathematically modeled. For 𝑆𝑐𝑎𝐶𝐴𝑋𝑃ℎ𝑎𝑛𝑡−𝐼𝑛𝑡 factor versus irradiated area, a fit of a polynomial curve as a function of the area logarithm was made. For both energies, the best fit was achieved using quadratic expressions, with good correlation coefficients: 0,999 for 6 MV and 0,984 for 10 MV.
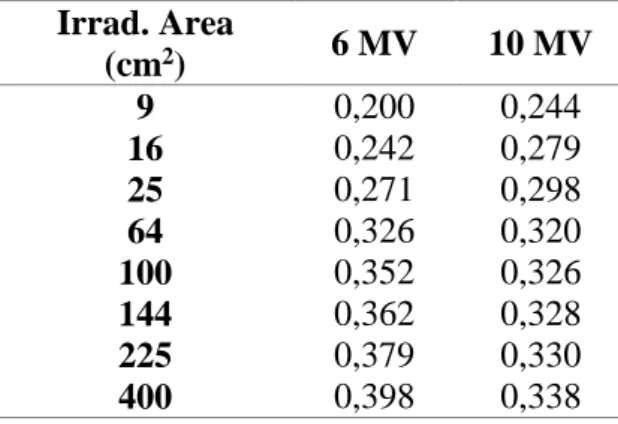
Tables 2 and 3 presents 𝑆𝑐𝑎𝐶𝐴𝑋𝑃ℎ𝑎𝑛𝑡−𝑇ℎ𝑖𝑐𝑘 and 𝑆𝑐𝑎𝐶𝐴𝑋𝑃ℎ𝑎𝑛𝑡−𝐼𝑛𝑡 values, normalized by primary dose inside the phantom calculated following equation 5, as a function of phantom thickness and irradiated area, respectively, considering 300 monitor units irradiation per field.
Table 2: Scattering due to the phantom thickness normalized by
primary dose inside phantom for a fixed 10x10 cm2 field irradiation. Thickness (cm) 6 MV 10 MV 5 7 0,211 0,255 0,223 0,270 9 15 19 25 0,291 0,347 0,384 0,428 0,290 0,325 0,345 0,371
Table 3: Scattering due to the radiation intensity normalized by
primary dose inside phantom for a fixed 15 cm phantom thickness.
Irrad. Area (cm2) 6 MV 10 MV 9 16 0,200 0,242 0,244 0,279 25 64 100 144 225 400 0,271 0,326 0,352 0,362 0,379 0,398 0,298 0,320 0,326 0,328 0,330 0,338
In figure 4, the curve relating scattering radiation dose at isocenter versus radiation field size is presented.
Figure 4: Correction due to radiation scattering inside the
phantom as a function of irradiated field size (using 300 monitor units irradiation), for 15 cm phantom thickness.
3.4 Validation of isocenter back-projection algorithm
A comparative analysis of isocenter doses calculated by the back-projection algorithm obtained a mean percentage difference of 1,86% for the integral accumulate dose (DI), for nine 6 MV irradiated plans, with a relative standard deviation (SD%) of 1,26%. For 10 MV, it was obtained a mean percentage difference of -0,94% with SD% of 0,61%.
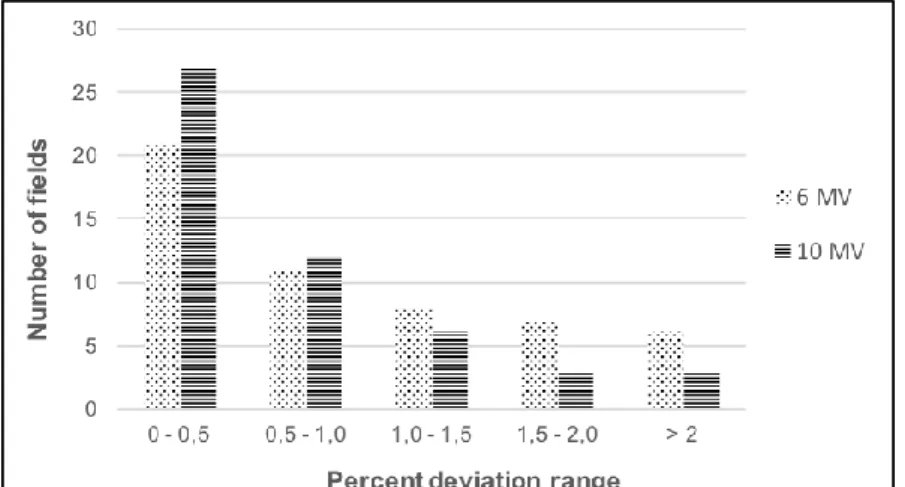
Considering normalized field-by-field comparisons, the distribution of individual percentage differences is show on figure 5. One can note that most of the percentage differences between DFEPID and DFCI were smaller than 2%, approximately 89% for 6 MV and 94% for 10 MV.
Figure 5: Percent differences between DFEPID and DFCI distribution in field
4. DISCUSSION
4.1 The back-projection dose algorithm at the isocenter.
The process of deconvolution and absolute calibration of EPID images has showed a good agreement when compared with reference doses obtained with dosimetric process using the ionization chamber, for both energies considered (6 and 10 MV). It was obtained differences within 1% for all small field sizes up to 15x15 cm2. The biggest differences of 1,4% for 6 MV and 0,77% for 10 MV were obtained at the edge regions. Therefore, it is reasonable to consider that differences smaller than 1% are adequate to suggest future clinical application of the proposed method.
A good fit was also obtained by linear regression for characterization of additional scattering contribution for phantom insert on EPID, showing higher coefficients of determination, 0,985 to 6 MV and 0,991 to 10 MV. By analyzing acquired data for total transmission, pixel intensity summation in EPID images and in air scattering (𝑆𝑐𝑎𝑃ℎ𝑎𝑛𝑡−𝐸𝑃𝐼𝐷), it was concluded that this effect cannot be calculated only as a function of irradiated area. It was observed that, for the same irradiated field size and monitor units, in the presence of enhanced dynamic wedges of 30 and 60 degrees, total transmission was identical, but pixel intensity summation differed owing to beam modulation. Consequently, values of 𝑆𝑐𝑎𝑃ℎ𝑎𝑛𝑡−𝐸𝑃𝐼𝐷 were very different, even considering the same irradiation area. This phenomenon, as incorporated on proposed algorithm, was extremely important on interpretation and back-projection of doses from modulated beams from IMRT technique.
By separating the scattering inside the phantom in two co-dependent contributions, Sca
Phant-Esp and ScaPhant-Int, and relating them to IC chamber results, it was possible to minimize
computational cost of implemented algorithm, as well as facilitate results analysis. Aiming to simplifying the algorithm, all differences encountered in isocenter projected and actual doses were considered as coming from the inner scattering. Since inner scattering is a very difficult phenomenon to describe, referring it to actual measured doses was a conservative option.
As showed in figure 4, inner scattering contribution to the isocenter dose sharply increases with field size, for both energies, following a near quadratic behavior for field areas between 3x3 cm2 and 8x8 cm2. For larger values of the field area, the curve grows smoother. For 10 MV, the curve presents, approximately, a plateau for fields bigger than 10x10 cm2, indicating that larger fields do not contribute significantly to the dose at isocenter. Additionally, for 6 MV, although the curve does not present any plateau, the increase of scattering dose for larger field sizes shows an
almost linear behavior with small slope. This fact can be explained by the range of secondary particles generated by primary scattering due to radiation interaction with matter. The bigger the distance of photon interaction, the lower the probability of deposited dose due to electrons at the central axis area. Therefore, as observed, the increase of field sizes does not influence scattering doses at the isocenter, although it exerts an important influence on other considered factors to the method, such as on-air scattering between phantom and EPID.
According to Wendling and collaborators [7] method, scattering of a beam inside a phantom or patient is better described by a convolution operation using a Gaussian composed Kernel curve. This procedure is very usual on radiotherapy, serving as the base for several implemented algorithms of dose calculation available in commercial TPS. To achieve a simple algorithm that simplifies back-projection for punctual dose, convolution approach represents a laborious computational way, but without significant improvement of accuracy for punctual dose analysis. However, for the proposed aim, the established method is a simple solution and allows other radiotherapy departments to apply it soon, despite smaller computational resources and programming knowledge.
4.2 Isocenter back-projection algorithm validation.
Percent deviations obtained during algorithm validation indicate a good agreement between back-projected doses and experimental measurements.
It was not observed significant differences in dose deviations at isocenter level when comparing both treatment techniques, 3DCRT and IMRT, thus indicating good performance of the method even when considering back-project doses due to modulated beams.
A limitation of the method was identified when analyzing results for splitted IMRT fields. In those cases, central axis doses were too small for some fields, at cGy level (1 to 10 cGy), and measurements uncertainties in EPID and IC became more relevant. This effect had small influence when total isocenter doses were analyzed, that is, poor results comparing DFEPID with DFCI do not
necessarily reflect as bigger deviation comparing DIEPID with DICI. Hence, it does not represent a
practical limitation.
Considering means and standard deviations obtained during validation, one can conclude that the proposed method is sensitive in detecting isocenter dose deviations greater than 4 and 3%, for 6 and 10 MV, respectively, and field-by-field deviations greater than 3 and 2% (considering a
confidence level of 95% and approximating data distribution to a Gaussian behavior). These threshold values are compatible with others found in literature to back-projection methods using EPID [13,14].
5. CONCLUSION
The implemented back-projection algorithm, by transmitted dose collected in EPID, based on empirical measurements and computational model, have proved itself and accurate and trustworthy method. It was modeled to use a single deconvolution process to achieve EPID absolute dose and account for all radiation scattering contributions by fitted curves. It successfully incorporated effects of inner scattering in EPID, air scattering between phantom and EPID and inside phantom scattering.
All fitted curves used to describe and simplify mathematical approach regarding scattering effects presented correlation coefficients above 98%. Absolute EPID calibrations were carried out with deviations compared to ionization reference chamber, being lower than 1% for both photon nominal energies: 6 and 10 MV.
The method was validated using nineteen treatment plans of 3DCRT and IMRT, with static gantry angles, and a total of 104 irradiation fields projected on a specific phantom, while collecting transmitted dose in EPID and absolute dose with an ionization chamber positioned on isocenter. Average deviations comparing absolute isocenter doses were smaller than 2% and field-by-field analysis showed agreement smaller than 2% for 89% and 94% of the fields for 6 and 10 MV, respectively.
Considering validation results, it was concluded that the proposed algorithm and method have sufficient accuracy to be future tested in in vivo dosimetry for patients treated with 3DCRT and IMRT techniques. The method was developed and designed in such a way that it can be easily implemented clinically. It is expected to improve radiotherapy quality assurance program as it might catch delivered dose deviations and identify or even prevent accidental exposures.
REFERENCES
1. KLEIN, E. E.; HANLEY, J.; BAYOUTH, J.; YIN, F.; SIMON, W.; DRESSER, S. et al. Task Group 142 report: Quality assurance of medical accelerators. Med Phys, v. 36(9), p. 4197-4212, 2009. doi: 10.1118/1.3190392
2. WHO - World Health Organization. Risk Profile, Geneve: WHO, 2008, 51p.
3. IAEA - International Atomic Energy Agency. Development of procedures for in vivo
dosimetry in radiotherapy. Human Health Reports No. 8, Vienna: IAEA, 2013, 179p.
4. ESCH, A. V.; DEPUYDT, T.; HUYSKENS, D. P. The use of an aSi-based EPID for routine absolute dosimetric pre-treatment verification of dynamic IMRT fields. Radiother Oncol, v. 71(2), p. 223-234, 2004. doi:10.1016/j.radonc.2004.02.018
5. GREER, P. B.; POPESCU, C. C. Dosimetric properties of an amorphous silicon electronic portal imaging device for verification of dynamic intensity modulated radiation therapy. Med
Phys, v. 30(7), p. 1618-1627, 2003. doi:10.1118/1.1582469
6. BAN, L.; CHIN, L.; WRONSKI, M.; WEISER, K.; TURNER, A. Evaluating the Impact of In Vivo EPID Dosimetry on Intensity-Modulated Radiation Therapy Treatment Delivery Workflow: A Stakeholder Perspective. J Med Imag Radiat Sci, v. 45(3), p. 253-259, 2014. doi:10.1016/j.jmir.2013.12.008
7. WENDLING, M.; LOUWE, R. J.; MCDERMOTT, L. N.; SONKE, J.; HERK, M. V.; MIJNHEER, B. J. Accurate two-dimensional IMRT verification using a back-projection EPID dosimetry method. Med Phys, v. 33(2), p. 259-273, 2006. doi:10.1118/1.2147744
8. MANS, A.; WENDLING, M.; MCDERMOTT, L. N.; SONKE, J.; TIELENBURG, R.; VIJLBRIEF, R. et al. Catching errors with in vivo EPID dosimetry. Med Phys, v. 37(6), p. 2638-2644, 2010. doi:10.1118/1.3397807
9. ELMPT, W. V.; MCDERMOTT, L.; NIJSTEN, S.; WENDLING, M.; LAMBIN, P.; MIJNHEER, B. A literature review of electronic portal imaging for radiotherapy dosimetry.
Radiother Oncol, v. 88(3), p. 289-309, 2008. doi:10.1016/j.radonc.2008.07.008
10. DAHLGREN, C. V.; AHNESJ, A.; MONTELIUS, A.; RIKNER, G. Portal dose image verification: formalism and application of the collapsed cone superposition method. Phys Med
Biol, v. 47(24), p. 4371-4387, 2002. doi:10.1088/0031-9155/47/24/305
11. SPEZI, E.; LEWIS, D. G. Full forward Monte Carlo calculation of portal dose from MLC collimated treatment beams. Phys Med Biol, v. 49(2), p. 355-355, 2004. doi:10.1088/0031-9155/49/2/c01
12. PIERMATTEI, A.; CILLA, S.; AZARIO, L.; GRECO, F.; RUSSO, M.; GRUSIO, M. et al. ASi EPIDs for the in-vivo dosimetry of static and dynamic beams. Nucl Instr Meth Phys Res A, v. 796, p. 93-95, 2015. doi:10.1016/j.nima.2015.02.024
13. PUTHA, S.; SAXENA, P.; BANERJEE, S.; SRINIVAS, C.; VADHIRAJA, B.; RAVICHANDRAN, R. et al. On-line estimations of delivered radiation doses in three-dimensional conformal radiotherapy treatments of carcinoma uterine cervix patients in linear accelerator. J Med Phys, v. 41(4), p. 224-233, 2016. doi:10.4103/0971-6203.195186
14. MIJNHEER, B.; OLACIREGUI-RUIZ, I.; ROZENDAAL, R.; SONKE, J.; SPREEUW, H.; TIELENBURG, R. et al. 3D EPID-based in vivo dosimetry for IMRT and VMAT. J Phys
Conf Ser, v. 444, n. 012011, 2013. doi:10.1088/1742-6596/444/1/012011
15. CELI, S.; COSTA, E.; WESSELS, C.; MAZAL, A.; FOURQUET, A.; FRANCOIS, P. EPID based in vivo dosimetry system: clinical experience and results. J Appl Clin Med Phys, v. 17(3), p. 262-276, 2016. doi:10.1120/jacmp.v17i3.6070
16. IAEA - International Atomic Energy Agency. Absorbed dose determination in external
beam radiotherapy. An international code of practice for dosimetry based on standards of absorbed dose to water. Technical Report Series No. 398, Vienna: IAEA, 2006, 183p.