Engineering ISSN: 1809-4430 (on-line)
_________________________
1 PPGEQ - UFU/ Uberlândia - MG, Brasil. 2 DEQ - UFMG/ Belo Horizonte - MG, Brasil.
MODELING OF BASIL ESSENTIAL OIL EXTRACTION WITH VARIABLE DIFFUSION COEFFICIENT
Doi:http://dx.doi.org/10.1590/1809-4430-Eng.Agric.v37n4p717-726/2017
JENIFFER C. SILVEIRA1, ANDRÉA O. S. DA COSTA2, ESLY F. DA COSTA JUNIOR3*
3*Corresponding author. DEQ - UFMG/ Belo Horizonte - MG, Brasil. E-mail: [email protected]
ABSTRACT: Essential oils are complex mixtures of volatile compounds found at low levels in
aromatic plant specific parts. Soluble in organic solvents, these oils are characterized by their fragrance and antimicrobial activity, being widely used in industries. The mathematical modeling of essential oil extraction is a relevant step in the project of industrial plants because it is about
achieving optimized operational conditions. A model is available in the literature describing the
extraction process of basil essential oil, based on diffusion within the leaf. Parametric equations were tested for the variable diffusion coefficient with the concentration, resulting in a significant improvement in the description process, when compared to papers presented in the literature.
KEYWORDS: concentration variable diffusion, parameter estimation, essential oils.
INTRODUCTION
Essential oils are complex mixtures of volatile compounds, produced by the aromatic plant's secondary metabolism. The main compounds that constitute an essential oil belong to the chemical classes of monoterpenes and sesquiterpenes (El Asbahani et al., 2015).
A peculiar fragrance and frequent biological (Baser & Buchbauer, 2015), antimicrobial (Seo et al., 2015, Jurado et al., 2015) and antioxidant (Amorati et al., 2013) activities make essential oils attractive to industries (Silveira et al, 2012). These substances have a diversified use, from flavoring agents to substitutes of synthetic food preservatives (Hyldgaard et al., 2012). Moreover, cosmetic products and perfumes (Jentzsch et al., 2015), as well as in drug manufacturing, such as antibiotics (Savoia, 2012) are other uses of these oils. Another application includes microencapsulation in the textile industry, providing durable fragrances and the feeling of a soft skin (El Asbahani et al., 2015). In addition, essential oils can be used as natural sources of substances with commercial potential in chemical synthesis (Baser & Buchbauer, 2015).
Essential oils are obtained from plant parts by means of water/steam distillation, or by citrus fruit pericarp mechanical processing (Baser & Buchbauer, 2015).
The essential oil extraction on an industrial scale to steam distillation stands out, since in addition to producing high quality oil, it allows for its recovery with high purity (Kodama et al., 2014), and the operation is still simple in comparison to other processes (Romdhane & Tizaoui, 2005).
Three phenomena stand out for controlling the steam distillation process: oil instantaneous vaporization at the film interface formed on the plant material surface; oil transfer into the surrounding steam; and the oil exudation from the inside of the trichomes to the plant outer surface (Busato et al., 2014).
Models for the essential oils extraction process can be found in the literature within three categories: empirical models, models based on the mass balance fluid phase and models based on the mass balance solid phase (Gaspar et al., 2003).
This study has the purpose of continuing the research developed by Silveira et al. (2015) in the modeling of essential oils extraction by means of a model with parameters distributed in the solid phase. Just as Silveira et al. (2015), other authors have already considered a variable diffusion coefficient. Golestani et al (2013) considered the variable coefficient in apple drying, obtaining results similar to the experimental data. Favelukis et al. (2013) model the mass transfer between an asymmetric solid particle and a surrounding liquid with a diffusion coefficient variable. Park & Lee (2016) performed the dynamic modeling of fixed-bed adsorption of flue gas using a variable diffusion coefficient from which a precise estimate of the transfer mass rate for a wide range of adsorption compositions was obtained. This study proposes a new empirical equation application to the diffusion coefficient description in oil concentration terms. A set of experimental data obtained from the extraction of basil (Ocimum basilicum) essential oils was applied to its analyses and is available in Cassel et al. (2009). Besides the new correlation test, a statistical analysis was performed for determining the estimated parameters with the best correlation.
MATERIAL AND METHODS
A classic mathematical model of essential oil diffusion in the solid phase was considered, as presented in (Cassel & Vargas, 2006; Cassel et al., 2009), being a model with distributed parameters.
According to Cassel & Vargas (2006) and Cassel et al. (2009), model assumptions are: mass transfer control is made by essential oil diffusion to vapor in leaves; essential oil distribution throughout leaves is homogeneous at the beginning of the process; one-dimensional problem is admitted so that a rectangular domain is assumed to model the basil leaf (concentration variation only along the plant leaf thickness); the model is based on Fick's second diffusion law; after the start of the extraction, resistance against mass transfer from plant surface to steam is inexistent, and oil concentration in the vapor phase is very low and considered null.
The equation, based on the assumptions adopted, corresponds to the mass balance in the solid phase given by:
(1)
for t = 0, Ca(x,0) = Ca0 (2)
for x = 0, Ca(0,t) = 0 (3)
for x = L, Ca(L, t) = 0 (4)
in which,
Ca(x, t) - oil concentration in the solid phase;
D - Constant diffusion coefficient;
Ca0 - essential oil initial concentration in the aromatic plant, and
L - Plant thickness.
(5)
The extracted mass rate as a function of time, , was obtained from the surface area product (A) by the mass flow in the contour. According to Silveira et al. (2015): (6)
Cassel & Vargas (2006) and Cassel et al. (2009) present [eq. (7)] for the total extracted mass compute, m (t), being obtained through the integration of [eq. (6)]. (7)
In which, ma0 - essential oil initial mass contained throughout the plant. The extraction degree, e(t), according to Cassel & Vargas (2006) and Cassel et al. (2009) was defined by [eq. (8)]. (8)
in which, - Total extracted mass at equilibrium time, or mathematically at t → ∞. Since the present study proposes the diffusion coefficient description as a concentration function along the plant leaf, this model has no analytical solution. Therefore, Silveira et al. (2015) present the equation discretization that describes the essence oil diffusion inside the particle, [eq. 1], along with its initial and boundary conditions, eqs. (2), (3) and (4), respectively. The discretized equations are presented by: (9)
for t = 0, Ca(xi, 0) = Ca0 where i = 1, 2, 3, ..., n (10)
for x = L/2, Ca(L/2,t) = 0 (11)
for x = 0, then (12)
in which,
The ordinary differential equations system, ODEs, obtained by the equations discretization was solved by numerical integration performed in the MATLAB® software. The function used was ode23, which corresponds to the Runge-Kutta method of second and third order, using all
parameters at their default value. The initial integration condition was y(i) = Ca0 for 1 ≤ i ≤ n.
The model was then applied to the basil essential oil extraction process, whose experimental data are presented in Cassel et al. (2009). Initially, we reproduced the solutions obtained by Cassel et al. (2009), considering the constant diffusion coefficient presented by the authors. After this, different parametrizations were tested to represent the diffusion coefficient, now variant with the
concentration. The relationships tested were: D=α.Ca(x,t), D=α.Ca(x,t)+β, D=α/ Ca(x,t)+β, D=α.
Ca(x,t)2+β, presented by Silveira et al. (2015), and D=α.Ca(x,t)1/2+β, proposed in the present study.
The parameters α and β were estimated by means of the solution of an optimization problem based on the sum of squared residuals (SSR) between the simulated and experimental values, the objective function (OF) used was given by:
(13)
in which,
no - number of experimental observations (number of yield measures);
Ymi - i-th measured yield value, and
Ysi - i-th value calculated by the yield model.
An implementation of the Simplex method in MATLAB®, available in the fminsearch
routine, was used as an optimization algorithm, using the default values for all routine parameters. Since the objective function is nonlinear, the solution provided by the algorithm is sensitive to the
initial estimates employed. All tested functions with parameter (independent term) can provide
the same behavior obtained in the estimation for D constant if it is employed: null, the same
estimated value of Ca0 and = D. Thus, these values were provided to the optimization routine as
initial estimates of these functions parameters and, with this, there was no way for the algorithm to provide an SSR value higher than that obtained in the constant D estimate. In the case of the function in which the diffusion coefficient is directly proportional to the concentration, the initial estimate providing an SSR equals that obtained for constant D is inapplicable, and the initial
estimate was the same value of Ca0 and the value = D/Ca0.
The operating conditions used in the basil oil extraction simulation are presented in Table 1.
TABLE 1. Conditions used in the simulation.
Plant material mass (kg) 0.212
Plant leaf thickness (m) 4.70×10⁻⁴
Extraction time (s) 1800
After estimating the parameters of each correlation tested, the equation that gives the best relation for the diffusion coefficient as a concentration function was defined as the one with the lowest SSR value. For this function, a statistical analysis was performed to determine the confidence intervals of each of the model parameters and to verify if any of them could be discarded. For this analysis, we assumed that the measurement errors in the output variable (yield) are uncorrelated, have the same variance and null mean, in addition to having a normal distribution.
The measurement variance error, , was estimated by the equation [eq. (14)].
in which,
p - estimated parameters number.
The covariance matrix estimate of the parameters was calculated for the standard error estimation of each parameter. According to Cassol et al. (2014), from the assumed assumptions for
measurement errors, the covariance matrix of the parameter estimates, , was given by [eq. (15)].
(15)
in which,
B - matrix with the partial derivatives of each simulated yield value, Ysi, in relation to each of
the parameters, j, .
From the covariance matrix, the estimated standard error of each parameter, sp(j), according
to Montgomery & Runger (2010), was given by [eq. (16)].
(16)
in which,
- main diagonal terms of the matrix .
RESULTS AND DISCUSSION
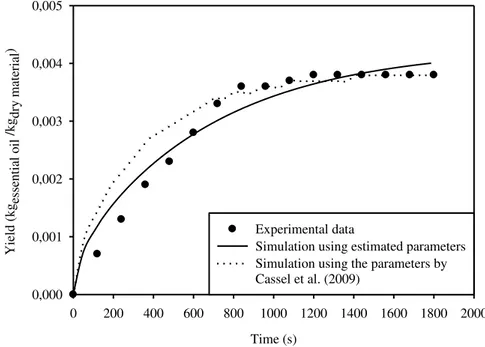
Based on experimental data from basil oil extraction, available from Cassel et al. (2009), we reproduced the yield curve as an extraction time function. Figure 1 shows the distribution obtained with the simulation in comparison to the experimental data. The diffusion coefficient estimated by
Cassel et al. (2009), equivalent to D=5.96×10⁻¹¹m2/s, and the essential oil initial concentration,
Ca0=3.82×10⁻³kg×kg-1, obtained by the analytical solution together with experimental data were
used to this end. The sum of squared errors was determined by this simulation in order to quantify
the deviation between the experimental and simulated curves, obtaining 7.03×10⁻⁶.
The D and Ca0 parameters were estimated by solving the optimization problem to minimize
the SSR, obtaining the following values: D=3.16×10⁻¹¹m2×s-1 and Ca0=4.27×10⁻³kg×kg-1, with
SSR=9.41×10⁻⁷. Figure 1 shows the distribution obtained with this simulation.
Time (s)
0 200 400 600 800 1000 1200 1400 1600 1800 2000
Yie
ld
(k
gesse
n
ti
al
oil
/
k
gd
ry
ma
te
ria
l)
0,000 0,001 0,002 0,003 0,004 0,005
Experimental data
Simulation using estimated parameters Simulation using the parameters by Cassel et al. (2009)
FIGURE 1. Yield distribution for time extraction using the parameters by Cassel et al. (2009) and the estimated parameters.
Diffusion coefficient parametrizations were evaluated, varying the concentration and adjusting for the data. Table 2 and Figure 2 show the results obtained.
The analysis of Figure 2 in conjunction with the data in Table 2 shows that only the first correlation tested showed SSR greater than the value obtained when considering the constant
diffusion coefficient (SSR=9.41×10⁻⁷). This indicates that a diffusion coefficient directly
proportional to the oil concentration was inadequate. For the second correlation, the same value was obtained for the SSR with the constant diffusion coefficient, that is, the use of this function did not improve the phenomenon description.
There was a decrease of the SSR equivalent to 1.61% in the third correlation tested when compared to the value obtained in the first simulation with the constant diffusion coefficient.
TABLE 2. Correlations for the modified diffusion coefficient.
Correlations Estimated parameters SSR
D=α.Ca(x,t) α =3.11×10
-9 m2×kg
dry material×(kgessential oil)-1×s-1
Ca0 = 5.82×10⁻³ kgessential oil×(kgdry material)-1 1.11×10
-6
D= α.Ca(x,t)+β
α = 1.60×10⁻¹³m2 kgdry material× (kgessential oil)-1×s-1
β=3.16×10⁻¹¹m2×s-1
Ca0=4.27×10⁻³kgessential oil×(kgdry material)-1
9.41×10⁻⁷
D= α/Ca(x,t)+ β
α = -2.34×10⁻¹⁵ m2×kgdry material×(kgessential oil)-1×s-1
β = 3.09×10⁻¹¹ m2×s-1
Ca0 = 4.38×10⁻³ kg
essential oil×(kgdry material)-1
9.25×10⁻⁷
D= α.Ca1/2(x,t)+ β
α = -3.54×10⁻⁹ m2×kgdry material×(kgessential oil)-1×s-1
β = 2.28×10⁻¹¹ m2×s-1
Ca0 = 3.78×10⁻³ kg
essential oil×(kgdry material)-1
1.12×10⁻⁷
D= α.Ca2(x,t)+ β α = -7.07×10
-6 m2×kg
dry material×(kgessential oil)-1×s-1
β = 1.07×10⁻¹⁰ m2×s-1
Ca0 = 3.82×10⁻³ kgessential oil×(kgdry material)-1
Extraction time (s)
Correlation D=.Ca(x,t)
0 200 400 600 800 1000 1200 1400 1600 1800 2000
Yie ld (k ge sse n ti a l oil / k gd ry ma te ria l) 0,000 0,001 0,002 0,003 0,004 0,005 Experimental data Simulated data
Extraction time (s)
Correlation D=.Ca(x,t)+
0 200 400 600 800 1000 1200 1400 1600 1800 2000
Yie ld (k ge sse n ti a l oil / k gd ry ma te ria l) 0,000 0,001 0,002 0,003 0,004 0,005 Experimental data Simulated data
Extraction time (s)
Correlation D=C(x,t)+
0 200 400 600 800 1000 1200 1400 1600 1800 2000
Yie ld (k ge sse n ti a l oil / k gd ry ma te ria l) 0,000 0,001 0,002 0,003 0,004 0,005 Experimental data Simulated data
Extration time (s)
Correlation D=.Ca(x,t)1/2+
0 200 400 600 800 1000 1200 1400 1600 1800 2000
Yie
ld
(k
gesse
n ti a l oil / k gd ry ma te ria l) 0,000 0,001 0,002 0,003 0,004 0,005 Experimental data Simulated data
Extraction time (s)
Correlation D=.Ca(x,t)2+
0 200 400 600 800 1000 1200 1400 1600 1800 2000
Yie ld (k ge sse n ti a l oil / k gd ry ma te ria l) 0,000 0,001 0,002 0,003 0,004 0,005 Experimental data Simulated data
FIGURE 2. Yield distribution for extraction time using the correlations.
The SSR values obtained for the correlations tested were, in the majority, of the order of 10-7, with an SSR decrease of 1.61% to 88.4% in relation to the results obtained with constant diffusion coefficient. It is worth noting that significantly different values were obtained in Silveira et al.
(2015), for which SEQ values were in the order of 10-5, and the range of SSR decrease between
0.86% and 7.36%. Although the operating conditions are different, the much higher percentage improvement obtained for the basil data indicates that the variation effect of diffusion coefficient with concentration is more significant for this plant than for citronella and chamomile presented in Silveira et al. (2015).
However, the quadratic relationship proved to be adequate in the discretion of essential oil extraction experimental data, as occurred in Silveira et al. (2015).
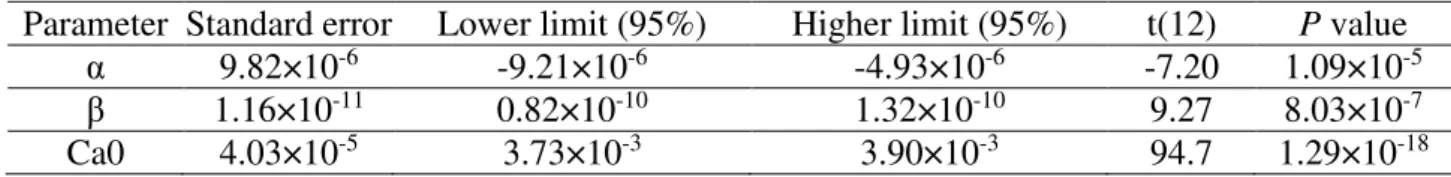
The estimated parameters statistical analysis for the fifth correlation is presented in TABLE 3.
TABLE 3. Statistical analysis of the parameters estimated for quadratic correlation applied to basil data.
Parameter Standard error Lower limit (95%) Higher limit (95%) t(12) P value
α 9.82×10⁻⁶ -9.21×10⁻⁶ -4.93×10⁻⁶ -7.20 1.09×10⁻⁵
β 1.16×10⁻¹¹ 0.82×10⁻¹⁰ 1.32×10⁻¹⁰ 9.27 8.03×10⁻⁷
Ca0 4.03×10⁻⁵ 3.73×10⁻³ 3.90×10⁻³ 94.7 1.29×10⁻¹⁸
It is noteworthy that there are 16 experimental points, but since in the initial time, the yield is always null, regardless of the value of the parameter, the number of experiments actually used in the estimation is no=15. As the number of estimated parameters equals 3, we have a number of degrees of freedom in the estimation equal to 12 (no-p). TABLE 3 shows that the hypothesis that any of the parameters is null was discarded in all the analyses since the null value is not present in the confidence interval of any of the parameters. Further, the parameter with the smallest t value (12) is
this value being much greater than t0,025,12 = 2.179 (which would correspond to a probability of
5% of null with 12 degrees of freedom). The analysis of the P value indicates that the probability
of being null is negligible and equal to 1.09 × 10⁻³%. For comparison purposes, the statistical
analysis was performed to determine the quadratic relation parameters significance estimated in Silveira et al. (2015) for citronella. The results are presented in TABLE 4.
TABLE 4. Statistical analysis of quadratic correlation parameters estimated in Silveira et al. (2015) for citronella data.
Parameter Value Standard error Lower limit (95%) Higher limit
(95%) t(8) P value
α -3.13×10⁻⁸ 2.95×10⁻⁸ -9.92×10⁻⁸ 3.67×10⁻⁸ -1.06 0.309
β 2.38×10⁻¹¹ 1.11×10⁻¹¹ 0.06×10⁻¹¹ 5.20×10⁻¹¹ 2.36 0.0359
Ca0 2.63×10⁻² 1.15×10⁻³ 2.11×10⁻² 2.64×10⁻² 20.6 9.76×10⁻¹¹
For the citronella data, there were 12 experimental points, of which 11 are effectively used in the estimation of the 3 quadratic relation parameters, and therefore have 8 degrees of freedom. The hypothesis that any of the parameters is null is verified not to be discarded with 95% confidence for
the parameter since the null value is within this parameter’s confidence interval. The P value
analysis of parameter indicates that there is a probability of 30.9% for this parameter to be null,
which is much higher than the respective probability for basil, which was negligible (1.09×10⁻³%).
It is interesting to note that the difference between the significance of the parameter in both cases
CONCLUSIONS
As verified in the literature, the consideration of the variable diffusion coefficient has shown to be an interesting and realistic approach in the different processes description, including essential oil extraction.
Like Silveira et al. (2015), the present study deals with modifications proposed to the model for parameters distributed in the solid phase for the essential oil extraction simulation. Parametric equations available in the literature for the diffusion coefficient determination as an oil concentration function were tested. Together with a new parameterization proposed in the present study. Data from oil extraction for the basil species were used to estimate the parameters, by minimizing the residues squared sum. Both the proposed correlation and the quadratic correlation were found to be significantly adequate to describe the experimental data, with a differentiation of only 0.3% in the SSR decrease. However, the quadratic relation reduced the sum of squared residuals in 88.4%, thus justifying the relevance of the consideration to the model proposed. In addition to the SSR decrease, the relevance of the quadratic correlation is confirmed in the statistical analysis significance of the quadratic correlation parameters, since all estimated parameters are significant with a probability higher than 99.9989%.
ACKNOWLEDGMENTS
The authors thank CNPq for the productivity scholarship in technological development and
innovative extension (produtividade em desenvolvimento tecnológico e extensão inovadora – DT).
REFERENCES
Amorati R, Foti MC, Valgimigli L (2013) Antioxidant activity of essential oils. Journal of
Agricultural and Food Chemistry 61(46):10835-10847. DOI: http://dx.doi.org/10.1021/jf403496k
Baser KHC, Buchbauer G (2015) Handbook of essential oils: Science, technology, and applications. 2 ed. Boca Raton, CRC Press - Taylor & Francis Group.
Busato NV, Silveira JC, Costa AOS, Costa Jr EF (2014) Estratégias de modelagem da extração de óleos essenciais por hidrodestilação e destilação a vapor. Ciência Rural 44(9):1574-1582.
DOI:http://dx.doi.org/10.1590/0103-8478cr20121330
Cassel E, Vargas RMF (2006) Experiments and Modeling of the Cymbopogon winterianus Essential Oil Extraction by Steam Distillation. Revista de la Sociedad Química de México 50(3):126-129.
Cassel E, Vargas RMF, Martinez N, Lorenzo D, Dellacassa E (2009) Steam distillation modeling for essential oil extraction process. Industrial Crops and Products 29(1):171-176.
DOI:http://dx.doi.org/10.1016/j.indcrop.2008.04.017
Cassol GO, Gallon R, Schwaab M, Coutinho EB, Severo Júnior JB, Pinto JC (2014) Statistical evaluation of non-linear parameter estimation procedures for adsorption equilibrium models. Adsorption Science & Technology 32(4):257-273. DOI: http://dx.doi.org/10.1260/0263-6174.32.4.257
El Asbahani A, Miladi K, Badri W, Sala M, Aït Addi EH, Casabianca H, El Mousadik A, Hartmann D, Jilale A, Renaud FNR, Elaissari A (2015) Essential oils: from extraction to encapsulation.
International Journal of Pharmaceutics 483(1-2):220-243. DOI:http://dx.doi.org/10.1016/j.ijpharm.2014.12.069
Favelukis M (2013) Mass transfer around axisymmetric particles of revolution in variable diffusion coefficient liquids. Industrial & engineering chemistry research 52(30):10290-10296.
Gaspar F, Lu T, Santos R, Al-Duri B (2003) Modelling the Extraction of Essential Oils with Compressed Carbon Dioxide. Journal of Supercritical Fluids 25:247-260.
DOI:http://dx.doi.org/10.1016/S0896-8446(02)00149-3
Golestani R, Raisi A, Aroujalian A (2013) Mathematical Modeling on Air Drying of Apples Considering Shrinkage and Variable Diffusion Coefficient. Drying Technology 31(1):40-51. DOI:http://dx.doi.org/10.1080/07373937.2012.714826
Hyldgaard M, Mygind T, Meyer RL (2012) Essential oils in food preservation: mode of action, synergies, and interactions with food matrix components. Frontiers in Microbiology 3(12):1-24. DOI:http://dx.doi.org/10.3389/fmicb.2012.00012
Jentzsch PV, Ramos LA, Ciobotă V (2015) Handheld raman spectroscopy for the distinction of
essential oils used in the cosmetics industry. Cosmetics 2(2):162-176. DOI:http://dx.doi.org/10.3390/cosmetics2020162
Jurado FR, Veja AF, Corona NR, Palou E, Malo AL (2015) Essential oils: antimicrobial activities, extraction methods, and their modeling. Food Engeneering Reviews 7(3):275-297.
DOI:http://dx.doi.org/10.1007/s12393-014-9099-2
Kodama S, Thawatchaipracha B, Sekiguchi H (2014) Enhancement of essential oil extraction for steam distillation by DBD surface treatment. Plasma Processes and Polymers 11(2):126-132. DOI:http://dx.doi.org/10.1002/ppap.201300047
Montgomery DC, Runger GC (2012) Estatística Aplicada e Probabilidade para Engenheiros. 5 ed. Rio de Janeiro, LTC.
Park J, Lee JW (2016) Dynamic modeling of fixed-bed adsorption of flue gas using a variable mass transfer model. Korean Journal of Chemical Engineering 33(2):438-447.
DOI:http://dx.doi.org/10.1007/s11814-015-0180-1
Romdhane M, Tizaoui C (2005) The kinetic modeling of a steam distillation unit for the extraction of aniseed (Pimpinella anisum) essential oil. Journal of Chemical Technology and Biotechnology 80(7):759-766. DOI: http://dx.doi.org/10.1002/jctb.1221
Savoia D (2012) Plant-derived antimicrobial compounds: alternatives to antibiotics. Future Microbiology 7(8):979-990. DOI: http://dx.doi.org/10.2217/fmb.12.68
Seo H, Beuchat LR, Kim H, Ryu J (2015) Development of an experimental apparatus and protocol for determining antimicrobial activities of gaseous plant essential oils. International Journal of Food Microbiology 215:95-100. DOI: http://dx.doi.org/10.1016/j.ijfoodmicro.2015.08.021
Silveira JC, Busato NV, Costa AOS, Costa Jr EF (2012) Levantamento e análise de métodos de extração de óleos essenciais. Enciclopédia Biosfera 8(15):2038-2052.