Received October 29, 2010 and accepted February 15, 2011. Corresponding author: betezootec@gmail.com
Patterns of genetic diversity of local pig populations in the State of
Pernambuco, Brazil
Elizabete Cristina da Silva1, Wilson Moreira Dutra Junior1, Patrícia Ianella2, Manoel Adrião Gomes Filho1, Cláudio José Parro de Oliveira1, Débora Nathália de Moura Ferreira1,
Alexandre Rodrigues Caetano2, Samuel Rezende Paiva2
1Universidade Federal Rural de Pernambuco – UFRPE.
2Embrapa Recursos Genéticos e Biotecnologia, Brasília, Distrito Federal, Brazil.
ABSTRACT - This study estimated the genetic diversity and structure of 12 genetic groups (GG) of locally adapted and specialized pigs in the state of Pernambuco using 22 microsatellite markers. Nine locally adapted breeds (Baé, Caruncho, Canastra, Canastrão, Mamelado, Moura, Nilo, Piau and UDB (Undefined Breed)) and 3 specialized breeds (Duroc, Landrace and Large White), totaling 190 animals, were analyzed. The Analysis of Molecular Variance (AMOVA) showed that 3.2% of the total variation was due to differences between genetic groups, and 3.6% to differences between local and commercial pigs. One hundred and ninety eight alleles were identified and apart from the Large White breed, all GG presented Hardy-Weinberg Equilibrium deviations for some loci. The total and effective allele means were lower for Duroc (3.65 and 3.01) and higher for UDB (8.89 and 4.53) and Canastra (8.61 and 4.58). Using Nei’s standard genetic distance and the UPGMA method, it was possible to observe that the Landrace breed was grouped with the local genetic groups Canastra, Moura, Canastrão, Baé and Caruncho. Due to the complex admixture pattern, the genetic variability of the 12 genetic groups can be analyzed by distributing the individuals into two populations as demonstrated by a Bayesian analysis, corroborating the results from AMOVA, which revealed a low level of genetic differentiation between the inferred populations.
Key Words: animal genetics resources, genetic variability, microsatellites loci, Sus Scrofa
www.sbz.org.br
Introduction
A great portion of the Brazilian swine herd is composed of breeds with high genetic potential for meat production (Duroc, Landrace, Large White, Hampshire and Pietrain), which were intensively introduced in the country during the 60’s, and commercial or specialized breeds (mostly composed by crossbreeding) that were more recently introduced. Naturalized pigs, i.e., animals that were locally adapted and that survived natural selection processes since the country´s Colonial Period, are facing extinction due to their characterization as fat-type pigs with low potential for lean meat production.
In recent years, the use of molecular techniques has helped in the conclusion of several studies focused on estimating the genetic variability distribution among and within endangered breeds of farm animals. Most of these studies were carried out using information from molecular markers such as microsatellites, which are considered to be extremely informative for genetic diversity studies in populations (Aranguren-Méndez et al., 2005).
Sollero et al. (2009) identified genetic diversity loss in pig breeds locally adapted in Brazil (Moura, Piau and Monteiro) with the use of a panel of microsatellite markers. Similar studies were also carried out in other countries (Calvo et al., 2000; Martínez et al., 2000; Lemus-Flores et al., 2001; Chaiwatanasin et al., 2002; Fabuel et al., 2004; Li et al., 2004; Canul et al., 2005; Kim et al., 2005; Martínez et al., 2005; Thuy et al., 2006; Vicente et al., 2008).
Material and Methods
One hundred and ninety samples of commercial and locally adapted pigs were used in the study: 176 from 82 properties of different regions in the State of Pernambuco (26 samples from the Metropolitan Region of Recife, 15 from the North and South Zona da Mata regions, 19 from the Central and Meridional Agreste regions and 116 from the city of Salgueiro and from the Sertão do Araripe region); and 14 samples as positive control from other Brazilian states (Santa Catarina, Distrito Federal and Bahia). The collection period was from January to September 2009.
The locally adapted pigs were classified into each of nine genetic groups (Baé, Caruncho, Canastra, Canastrão, Mamelado, Moura, Nilo, Piau and UDB - Undefined Breed) according to their qualitative morphological characteristics as described by Vianna (1986), Barreto (1973) and Castro et al. (2002). The UDB group was composed of 47 pigs with morphological characteristics that were too heterogenic to classify into one of the other groups. Pig samples from specialized breeds (Landrace, Large White and Duroc) from Embrapa CENARGEN´s DNA/Tissue Bank were used as outgroups to evaluate their relation with the locally adapted animals.
Genomic DNA was extracted from hair bulbs according to previously described methods (Boyce el al., 1989). Twenty two microsatellite markers were used to characterize each sample: SW830, SW936, SW857, OPN, S0005, SW24, SW72, SW455, S0068 and SW911 (Rohrer et al., 1994); S0002 (Fredholm et al., 1993); S0101, S0026 and S0178 (Rohrer et al., 1996); S0155 and S0090 (Ellegren et al., 1994); SW1517 (Alexander et al., 1996a); SW2406 (Alexander et al., 1996b); S0355, S0386, S0228 and S0097 (Robic et al., 1994).
Markers were randomly located in 17 autosomal chromosomes of the pig genome. Nineteen of these microsatellites are part of a panel recommended by FAO (Food and Agriculture Organization)/ISAG (International Society of Animal Genetics) (FAO, 2004) for the study of genetic diversity in pigs.
Four loci were excluded from the analyses (S0090,
S0386, S0228 and S0097) for presenting problems in amplification or in allele calling, so the final panel was composed of 18 loci.
PCR amplifications were carried out using 4.5 ng of genomic DNA, 0.2 to 0.23 μM of each primer and 5 μL of QIAGEN Master Mix kit, according to the manufacturer’s recommendations. The following cycling steps were used: 95°C (15 min) followed by 36 cycles of 94°C (1 min), 60°C (1:30 min) and 72°C (1 min), and one final extension step of
72°C (10 min). PCR products were submitted to capillary electrophoresis in an automated sequencer model ABI Prism 3100 (Applied Biosystems), according to the manufacturer’s recommendations.
The genetic structure of the 12 genetic groups studied was carried out using the Analysis of Molecular Variance (AMOVA) with software Arlequin (Excoffier et al., 2006) to determine the genetic differentiation between groups through FST estimations (Weir & Cockerham, 1984), which were tested with 100,000 iterations of Markov Chains and 10,000 permutations. Four contrasts were tested: (I) To separate the genetic groups by regions, without considering their phenotypic characteristics, which resulted in five populations (Metropolitan Recife, Zona da Mata, Agreste, Sertão and Embrapa’s DNA/Tissue Bank CENARGEN, DF); (II) the three main phenotypic groups (locally adapted, commercial and UDB); (III) the UDB population was grouped with the other locally adapted genetic groups, creating two groups: one with the commercial populations and another with the locally adapted ones; (IV) All the 12 genetic groups as independent populations.
The other strategy to define the population structure consisted of estimating the most probable population number (K) in the samples from data generated with the 18 microsatellites in the panel, using a Bayesian approach with the software Structure v. 2.3.3 (Pritchard et al., 2000). A K value from 1 to 15 was estimated, with five simulations for each K, tested with a burn-in of 100,000 repetitions and 500,000 iterations of Markov chain Monte Carlo Simulation (MCMC). Additional analyses were performed to test the consistence of the results (50,000, 80,000 and 100,000 of burn-in with 100,000, 150,000 and 500,000 iterations of MCMC, respectively). The tests were applied based on the admixture model with correlated alleles frequencies (Falush et al., 2003). From the data probability logarithms (P Ln (D)) obtained with the Structure software for both analyses, the best K was estimated with an ad hoc statistic named DeltaK, which is based on the changing rate of the data probability logarithm between successive K values (Evanno et al., 2005). The structure’s display graphics were made using the software Distruct (Rosenberg, 2004).
In contrast to our findings, Yang et al. (2003) found higher levels of differentiation between Chinese pig populations (FST = 7.7%). AMOVA results of five Brazilian genetic groups (Piau, Moura, Monteiro, Landrace and MS60) obtained by Sollero et al. (2009) showed that 14% of all observed diversity came from the difference between the evaluated genetic groups. In another study carried out with Mexican pigs, an FST value of 11% was found (Lemus-Flores et al., 2001). The highest genetic differentiation values for pig populations ever reported were FST = 27% (Laval et al., 2000) between European pigs, followed by 26.1% for a differentiation study also carried out with European, Korean and Chinese pigs (Kim et al., 2005).
Structure (Pritchard et al., 2000) has been satisfactorily used in several studies to estimate the number of probable subpopulations/breeds that make up a certain species (Paiva, 2005; Sollero et al., 2009; Vicente et al., 2008; Martínez et al., 2008 Santos-Silva et al., 2009). The genetic differentiation observed between genetic groups was low in all structures tested in this study. Therefore, the data probability logarithms (P ln (D)) from the software Structure were used to infer the best K with an ad hoc
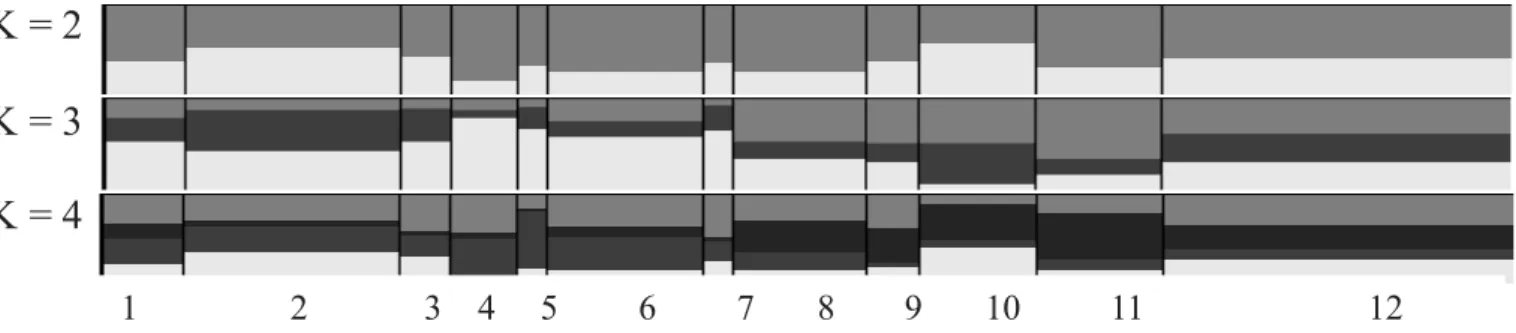
statistic named DeltaK, inferring that the best K was the one which presented the highest value (92.01) for the ∆K. In the 15 inferred populations (K), a higher probability for K = 2 was identified. It was possible to visualize the genetic variability distribution of individuals according to structures of K = 2 and K = 4. In the other inferred populations (K5-K15), admixture patterns complex and difficult to evaluate were observed.
Figure 1 presents the genetic structure distribution of the 12 pig genetic groups studied in this study from K = 2 to K = 4.
Introgression in different proportions of genetic material from specialized breeds into the locally adapted groups, as well as high levels of admixture, were observed. These results corroborate reports from Sollero et al. (2009) who showed that breeds such as Landrace and Piau share a high number of alleles, as other specialized and locally adapted swine breeds do.
Probabilities from the allocation test of individuals for the 12 pig genetic groups estimated with Structure are presented in Table 1. In cluster 1 the highest grouping probabilities were found for Canastrão (0.885) and Duroc (0.871), which can be a result of the genetic management used, since the samples from these groups came from the Sertão region of Pernambuco (Araripe and Salgueiro) and the Duroc pigs came from Embrapa Swine and Poultry, respectively.
each population, using the model proposed by Guo & Thompson (1992).
Polymorphic Information Content (PIC) and two parentage exclusion probabilities were estimated for each locus with Cervus v. 3.0 (Marshall et al., 1998). PE1 is the exclusion probability estimated when only the genotypes from the offspring and the supposed father are available, whereas PE2 is estimated with the inclusion of the genotype of one of the progenitors (the mother).
FSTAT v. 2.9.3 (Goudet, 2002) was used for estimating Wright’s F statistics (FST, FIS and FIT, Weir & Cockerham, 1984) per locus within populations. The significance of the F statistics was tested by bootstrap with 1000 resamplings, with a 99% confidence interval (CI). Bonferroni correction was used with α = 5% (0.05/18).
The genetic relation between populations was evaluated based on Nei (1972) and Reynold’s (1983) standard genetic distances, using the software TFPGA v.1.3 (Miller, 2000). Results were used to build a dendrogram with the Unweighted Pair Group Method with Arithmetic Mean (UPGMA), with a 1000 repetitions bootstrap.
Results and Discussion
In order to identify the main genetic structure among swine genetic groups from Pernambuco State a hierarchical analysis with AMOVA procedure was carried out to test the significance of four contrasts. The highest inter-population variation was observed when two groups composed of specialized and locally adapted animals (analysis III) were contrasted (FST = 3.6%, P<0.0001). When the analysis was performed with only one group composed of the 12 genetic groups (analysis IV), the FST value was 3.2% (P<0.0001). Both tests confirm a low genetic structure among swine populations sampled in the State of Pernambuco.
Cluster 1 also presented high allocation probabilities for the Landrace (0.736) and Large White (0.628) specialized breeds, as well as for other local genetic groups like Baé (0.679), Caruncho (0.602) and Canastra (0.559), and it contributed for most of all the studied groups. Local genetic groups Piau (0.573), Nilo (0.487) and Moura (0.422) were grouped in cluster 2. Cluster 3 was related to the local genetic group Nilo (0.433), while groups Mamelado (0.43) and UDB (0.476) shared cluster 4. Notably, all genetic groups, despite having presented higher proportions in some of the clusters, had some individuals allocated in other clusters.
The results of the quantitative intra-population variability analysis of the parameters: total (AT); mean (AM) and effective (AE) allele number; expected heterozygosity (He) and observed heterozygosity (Ho) according to the Hardy-Weinberg Equilibrium (HWE); Polymorphic Information Content (PIC); two paternity exclusion probabilities (EP1 and EP2); F statistics in each locus and number of genetic groups that presented significant deviations for the Hardy-Weinberg Equilibrium test, are presented in Table 2.
At analyses of intra and inter group variability, 198 alleles with the 18 loci analyzed in the 12 swine genetic
groups were identified (Table 2). All loci tested were polymorphic in all breeds with the exception of S0355, which was monomorphic in the Duroc and Large White breeds. This observation was probably due to the low number of individuals genotyped in these breeds, n = 1, each. Lemus-Flores et al. (2001) detected 5 and 7 S035 alleles in Duroc and Large White/Landrace pigs, respectively. Conversely, Martinez et al. (2005) reported that S0355 was monomorphic in six of the eleven Iberian pig populations studied.
Common alleles were observed in high frequencies among breeds in most of the tested loci. Thirteen loci presented from 1 to 2 common alleles in 100% of the populations: SW1517, SW830, S0155, S0026, S0002, SW240, SW857, S0178, OPN, S0101, SW72, SW455 and SW911. Sixteen alleles from all evaluated loci were present in 91.7% of the pig populations and four private alleles from four different loci were detected with frequencies lower than 7% (loci S1517, S0355, SW857 in the populations UDB and SW72 in Nilo).
In eight of the 12 populations (Baé, Canastra, Canastrão, Landrace, Moura, Mamelado, Nilo, Piau, UDB), the presence of rare alleles (with frequencies lower than 5%) was observed. Groups UDB, Canastra and Moura presented higher total
Figure 1 - Distribution of the genetic structure of the 12 pig genetic groups studied in this study with the software Structure/Distruct for K = 2 to K = 4.
Genetic groups Cluster 1 Cluster 2 Cluster 3 Cluster 4
Baé 0 . 6 7 9 0 . 1 2 1 0 . 1 7 3 0 . 0 2 6
Canastra 0 . 5 5 9 0 . 0 3 4 0 . 3 2 2 0 . 0 8 5
Caruncho 0 . 6 0 2 0 . 0 3 1 0 . 3 3 6 0 . 0 3 2
Canastrão 0 . 8 8 5 0 . 0 4 4 0 . 0 1 8 0 . 0 5 4
Duroc 0 . 8 7 1 0 . 0 1 1 0 . 1 0 0 0 . 0 1 8
Landrace 0 . 7 3 6 0 . 0 8 3 0 . 1 1 1 0 . 0 7 0
Large White 0 . 6 2 8 0 . 0 0 9 0 . 2 5 4 0 . 1 0 8
Moura 0 . 3 5 1 0 . 4 2 2 0 . 1 2 0 0 . 1 0 7
Mamelado 0 . 0 5 0 0 . 3 5 8 0 . 1 6 2 0 . 4 3 0
Nilo 0 . 0 2 1 0 . 4 8 7 0 . 4 3 3 0 . 0 6 0
Piau 0 . 1 1 8 0 . 5 7 3 0 . 1 0 0 0 . 2 0 9
UDB 0 . 0 4 4 0 . 2 3 4 0 . 2 4 7 0 . 4 7 6
Table 1 - Allocation probabilities of individuals in 12 genetic groups based on probabilities estimated with the software structure
allele (160, 155 and 142, respectively) and rare allele numbers (68, 63 and 45, respectively). Among the specialized breeds, the Landrace breed had the highest allele number, with 136 alleles observed in the 18 genotyped loci, from which 33 had frequency lower than 5%. This elevated total allele number detected in local groups in relation to the specialized ones may indicate that the specialized breeds have suffered an allelic diversity loss or suggest recent events of admixture that have the tendency to raise number of alleles. The rare alleles that were identified in large quantities in local groups may have resulted from mutations and/or recent gene flow.
Total allele number per loci (AT) varied from 07 (SW830 and SW72) to 20 (locus S0005). Six of the loci recommended by FAO (SW830, S0026, S0355, S0178, S0101 and SW72) showed low numbers of alleles –7 to 8 per locus. Laval et al. (2000) detected 7 to nine alleles per loci for five of these loci (S0026, S0355, S0178, S0101 and SW72) and Behl et al. (2005) also found few alleles within loci S0026, S0355, S0178 and SW72 (6 to 11 alleles).
The lowest mean allele number (AM) was 3.5 for locus S0355, which had a total of 8 alleles. Conversely, locus S0005 presented higher allele numbers in studies carried out with pig populations by Lemus-Flores et al. (2001) and Yang et al. (2003), who obtained 23 and 31 alleles respectively, and Fabuel et al. (2004), who identified 14 alleles. Observed heterozygosity (Ho) varied from 0.206 (S0355) to 0.970 (S0178), while expected heterozygosity according to the HWE (He) varied from 0.598 (SW72) to 0.939 (S0005).
Effective allele numbers varied from 1.774 (S0355) to 7.55 (S0005).
Polymorphic Information Content (PIC) estimates varied between 0.541 (SW72) and 0.9333 (S0005), with a mean value of 0.738. From the 18 microsatellite loci analyzed, nine presented high polymorphism (PIC>0.7) and only two had PIC lower than 0.6. According to Botstein et al. (1980)’s classification, markers with PIC superior to 0.5 are considered very informative; therefore, all loci used in this study were informative. The highest PIC values (0.939 and 0.903) corresponded to the microsatellites that presented higher allele numbers (S0005 and S0068, respectively).
Based on the PIC values observed and on the high combined exclusion probabilities of 0.99998 (PE1) and 0.99999 (PE2), it can be inferred that all loci can be used to compose a panel for parentage tests. Furthermore, it is worth emphasizing that the loci recommended by FAO (SW830, S0155, S0355, SW2406, SW857 and SW72) presented PE1 and PE2 values below 50%.
The fixation coefficient of populations (FST) per locus varied from zero (S0155) to 0.242 (S0355), with a mean value of 0.039, showing that only 3.9% of the total genetic variation was explained by differences between populations. For the FST- index, 66.7% of the loci presented values outside of the confidence interval (CI = 99%), with eleven loci presenting significant, though low, values to diagnose differences between the genetic groups. The mean FIS and FIT values for all loci were 0.186 and 0.214 with 38.9% and 33% of the values outside of the CI, respectively.
Loci aA
T bAM cAE dHo eHe fPIC gP E 1 hP E 2 i1FIT j2FST l3FIS mHWE
SW1517 1 2 6 . 8 0 3 . 7 5 1 0 . 5 2 3 0 . 7 7 6 0 . 7 5 3 0 . 4 1 8 0 . 6 0 0 0 . 3 2 8 0 . 0 1 6 0 . 3 1 6 6 SW830* 7 4 . 5 0 2 . 7 3 7 0 . 4 8 6 0 . 6 5 8 0 . 6 1 4 0 . 2 5 2 0 . 4 2 7 0 . 2 6 4 0 . 0 1 9 0 . 2 5 0 1 S0155* 9 6 . 2 0 2 . 7 0 9 0 . 4 9 4 0 . 6 5 3 0 . 6 3 3 0 . 2 7 5 0 . 4 6 8 0 . 2 4 3 0 . 0 0 0 0 . 2 4 6 4 S0026* 8 5 . 2 0 3 . 5 4 5 0 . 7 2 2 0 . 7 5 5 0 . 7 1 9 0 . 3 6 4 0 . 5 4 4 0 . 0 4 5 0 . 0 1 0 0 . 0 3 5 3 S0002* 9 6 . 5 0 4 . 5 8 6 0 . 9 1 1 0 . 8 2 9 0 . 8 0 5 0 . 4 8 7 0 . 6 5 9 - 0 . 0 9 5 0 . 0 3 1 - 0 . 1 3 0 2 S0355* 8 3 . 5 0 1 . 7 7 4 0 . 2 0 6 0 . 6 5 3 0 . 5 8 8 0 . 2 4 0 0 . 3 9 4 0 . 6 9 5 0 . 2 4 2 0 . 5 9 7 6 SW2406* 1 2 5 . 4 0 3 . 1 2 5 0 . 4 3 1 0 . 6 7 8 0 . 6 5 7 0 . 3 0 1 0 . 4 9 3 0 . 3 6 7 0 . 0 3 7 0 . 3 4 3 6 SW936* 1 2 6 . 2 0 4 . 0 7 4 0 . 4 9 7 0 . 8 5 1 0 . 8 3 2 0 . 5 3 8 0 . 7 0 2 0 . 4 2 1 0 . 0 5 5 0 . 3 8 8 4 SW857* 1 1 4 . 9 0 2 . 6 6 4 0 . 8 1 8 0 . 6 7 7 0 . 6 4 6 0 . 2 8 6 0 . 4 7 1 - 0 . 1 9 6 0 . 0 3 3 - 0 . 2 3 6 2 S0178* 8 4 . 9 0 3 . 0 8 9 0 . 9 7 0 0 . 7 2 1 0 . 6 8 8 0 . 3 3 0 0 . 5 1 3 - 0 . 3 3 8 0 . 0 6 2 - 0 . 4 2 7 7 O P N 1 3 6 . 3 0 3 . 9 7 6 0 . 5 1 4 0 . 7 9 3 0 . 7 6 8 0 . 4 3 7 0 . 6 1 5 0 . 3 5 5 0 . 0 2 8 0 . 3 3 7 7 S0005* 2 0 1 0 . 5 0 7 . 5 5 5 0 . 7 2 0 0 . 9 3 9 0 . 9 3 3 0 . 7 7 1 0 . 8 7 1 0 . 2 3 6 0 . 0 2 5 0 . 2 1 6 6 S0101* 8 5 . 2 0 3 . 3 5 0 0 . 4 9 2 0 . 7 1 9 0 . 6 8 6 0 . 3 2 6 0 . 5 1 0 0 . 3 1 7 0 . 0 0 1 0 . 3 1 7 6 SW24* 1 4 7 . 4 0 5 . 0 6 3 0 . 6 8 4 0 . 8 6 6 0 . 8 5 0 0 . 5 7 6 0 . 7 3 2 0 . 2 1 5 0 . 0 3 8 0 . 1 8 5 3 S0068* 1 9 1 0 . 2 0 7 . 4 0 7 0 . 7 9 0 0 . 9 1 3 0 . 9 0 3 0 . 6 9 4 0 . 8 1 9 0 . 1 3 6 0 . 0 1 0 0 . 1 2 7 8 SW72* 7 4 . 0 0 2 . 4 5 2 0 . 3 9 8 0 . 5 9 8 0 . 5 4 1 0 . 1 9 7 0 . 3 5 2 0 . 3 3 7 0 . 0 2 5 0 . 3 2 1 8 SW455 1 3 7 . 9 0 5 . 4 8 3 0 . 5 4 1 0 . 8 9 5 0 . 8 8 3 0 . 6 4 2 0 . 7 8 3 0 . 3 9 9 0 . 0 3 5 0 . 3 7 7 6 SW911* 8 5 . 7 0 4 . 2 6 7 0 . 7 2 2 0 . 8 1 9 0 . 7 9 2 0 . 4 6 3 0 . 6 3 8 0 . 1 2 3 0 . 0 3 7 0 . 0 8 9 1 Mean 1 1 6 . 1 8 3 . 9 7 8 0 . 6 0 7 0 . 7 6 6 0 . 7 3 8 0 . 9 9 9 9 8 0 . 9 9 9 9 9 0 . 2 1 4 0 . 0 3 9 0 . 1 8 6
1 CI.99% = 0.105-0.314; 2CI.99% = 0.022-0.063; 3CI.99% = 0.072-0.280; *FAO/ISAG (2004).
a Total allele number; bMean allele number; cEfective allele number; dObserved heterozygosity; eExpected heterozygosity; fPolymorphic Information Content; gPE1 = exclusion probability 1, hPE2 = exclusion probability 2. ifixation in dex of the global population; j endogamy due to the differentiation between subpopulations, in relation to the total population; linbreeding coefficient in relation to its subpopulations; m Number of genetic groups which deviated from the HWE (P<0.05)
The inbreeding coefficient within the populations (FIS) in each locus represented high inbreeding levels, except for loci S0002 (-0.130), SW857 (-0.236) and S0178 (-0.427), which presented negative FIS, suggesting an excess of heterozygous or exogamy. The positive FIS (0.186) for all loci in the populations probably reflects the subdivision of the general population in subpopulations due to the inbreeding accumulated in small populations and deviations for the Hardy-Weinberg Equilibrium (HWE).
The HWE test showed that all of the polymorphic loci deviated from HWE (P<0.05) in at least one population. Loci SW72 (8), S0068 (8) and OPN (7) presented higher number of populations in imbalance and loci SW911 and S0830, for only one population (UDB and Canastra, respectively).
According to the estimated indexes related to the genetic variability (Table 3), the mean allele number was lower for Duroc (3.65), while UDB and Canastra populations presented mean allele numbers of 8.89 and 8.61, respectively. The total AM was 6.20 alleles, whereas five of the locally adapted genetic groups and the Landrace specialized breed presented AM above the average.
Several factors may have contributed for the low Ho/He ratio in the studied populations, such as inbreeding, population subdivision, presence of null alleles or even the selection in favor of homozygous, which leads to heterozygous losses (Maudet et al., 2002). The PIC was higher in the genetic group Moura (0.717) and lower in the Large White breed (0.560) and in the Duroc breed (0.564), which also had the lowest He value.
The variability within genetic groups estimated by the inbreeding coefficient (FIS) showed that the highest value was obtained for the Duroc breed (0.250; P<0.05), and the lowest with the Large White breed (0.056), with significant effect (P>0.05). Three locally adapted pig genetic groups
(Canastra, UDB and Baé) presented high F-IS (P<0.05). In the local genetic groups, since there are no organized selection programs, it can be inferred that positive FIS observed values are a result from the inbreeding effect, which may contribute to the observed heterozygote deficits resulting from matings between related individuals that occur in the small swine farms found in Pernambuco.
The Landrace breed presented a high significant inbreeding value (FIS= 0.180) (P<0.05), as expected, since many of the individuals in the sample were known to have some degree of kinship due to local production system. The locally adapted Piau breed presented high FIS value (0.184, P<0.05). For the genetic group UDB, composed of 47 pigs, FIS was even higher (0.228, P<0.05). The positive and significant values for FIS in 11 genetic groups also showed that they are in Hardy-Weinberg disequilibrium.
Sollero et al. (2009) found negative FIS values (-0.054 and -0.055) when evaluating Landrace and Moura pigs, respectively, however, they obtained the same high value for the Piau breed (FIS = 0.126). Higher FIS values (over 0.10) were observed for Landrace, Large White and Duroc specialized breeds studied in other countries by Lemus-Flores et al. (2001) and Kim et al. (2005), respectively.
The UDB group presented 16 loci that do not fit HWE (P<0.05), while the Large White breed had only one locus that did not adhere to HWE (P<0.05). This shows a great difference in the number of loci in Hardy-Weinberg Disequilibrium among the analyzed populations, especially in the locally adapted groups that presented higher amplitude (Table 3). After the Bonferroni correction, the highest number of loci in imbalance was still observed for the genetic groups UDB and Canastra (14 and 11, respectively), and in five groups, all loci adhered to the HWE (Baé, Caruncho, Duroc, Large White and Mamelado).
Genetics groups/breeds AT aAM bAE cHo dHe ePIC fFIS gH W E
Baé 1 1 5 . 4 4 3 . 9 0 4 0 . 5 3 2 0 . 6 4 9 0 . 6 1 9 0 . 2 2 6 * 1 (0)
Canastra 2 9 8 . 6 1 4 . 5 8 0 0 . 5 4 9 0 . 7 2 0 0 . 6 9 2 0 . 2 3 0 * 16 (11)
Caruncho 0 7 5 . 5 0 4 . 0 2 4 0 . 6 2 5 0 . 7 0 7 0 . 6 7 0 0 . 1 5 3 * 6 (0)
Canastrão 0 9 5 . 7 8 4 . 1 1 7 0 . 6 3 4 0 . 7 1 2 0 . 6 6 9 0 . 1 1 9 * 3 ( 2 )
Moura 1 8 7 . 8 9 4 . 7 4 6 0 . 6 6 6 0 . 7 4 8 0 . 7 1 7 0 . 1 1 6 * 8 (4)
Mamelado 0 7 4 . 6 7 3 . 3 8 1 0 . 5 7 6 0 . 6 2 2 0 . 6 0 6 0 . 1 5 6 * 4 (0)
Nilo 1 6 6 . 2 2 3 . 7 7 6 0 . 6 2 0 0 . 6 7 9 0 . 6 3 7 0 . 1 1 3 * 9 (3)
Piau 1 7 6 . 5 6 4 . 2 3 6 0 . 6 1 5 0 . 7 1 7 0 . 6 7 8 0 . 1 8 4 * 11 (7)
UDB 4 7 8 . 8 9 4 . 5 3 9 0 . 5 6 1 0 . 7 3 2 0 . 7 0 0 0 . 2 2 8 * 16 (14)
Duroc 0 4 3 . 6 1 3 . 0 0 8 0 . 5 6 9 0 . 5 8 1 0 . 5 6 4 0 . 2 5 0 * 3 (0)
Landrace 2 1 7 . 5 6 4 . 4 1 2 0 . 5 9 2 0 . 7 1 8 0 . 6 8 7 0 . 1 8 0 * 8 (6)
Large White 0 4 3 . 7 2 3 . 0 1 7 0 . 6 8 1 0 . 5 9 9 0 . 5 6 0 0 . 0 5 6 1 (0)
Mean 6 . 2 0 3 . 9 8 0 . 6 0 0 . 6 8 0 . 6 5 0 . 1 6 7
*(P<0.05); aMean allele number; bEffective allele number; cObserved heterozygosity; dExpected heterozygosity; ePolymorphic Information Content; fInbreeding coefficient within each population; g Number of loci which deviated from the Hardy-Weinberg Equilibrium (P<0.05). Values in parentheses refer to the number of loci in disequilibrium after Bonferroni correction (P<0.003).
In the analyzed groups, the high deviated loci number is probably due to the fact that the animals were raised by small farmers in the State of Pernambuco. These farmers often carry out matings between related individuals, especially due to the small size of the herd, as the habit of trading boars and sows between nearby properties and because most of the farmers used to buy the animals in free markets, suggesting gene flow from other populations.
The high number of homozygotes observed must be due to the Wahlund Effect, which is the result of the presence of subpopulations in samples represented in each group, as reported by Lemus-Flores et al. (2001) for Mexican pig populations, which can be one of the reasons why the 11 genetic groups are in Hardy-Weinberg Disequilibrium, as well as the low sample number (Canul et al., 2005).
Overall, the nine local adapted swine genetic groups presented higher mean values for the intra-population genetic diversity parameters such as AE (4.18), AM (7.22), PIC (0.67) and He (0.70) than the ones obtained for the three specialized breeds, and were even superior to the means of the 12 genetic groups. Such remark shows the high diversity of the locally adapted populations in comparison to the specialized ones. This higher diversity may be explained by the fact that the locally adapted genetic groups are not subject to constant improvement programs for specific characteristics such as specialized breeds.
This higher diversity of the locally adapted groups results in a gene pool that makes them capable of surviving the adversities in their living environment. Despite such high diversity, the Ho (0.60) was inferior for the local genetic groups, suggesting that the low numbers of heterozygotes
in these groups are due to low numbers of breeders and the lack of breeding management practices, which lead to an increase in the degree of inbreeding, as observed by the highest mean value for the intra-population inbreeding coefficient (FIS = 0.17).
Nei’s standard genetic distance estimated that Canastra was the locally adapted breed closest to the specialized Landrace breed (0.094), and that Mamelado was the most genetically distant from Duroc (0.794). The Duroc breed presented the longest distances in relation to the other locally adapted populations, probably due to the geographic isolation, drift and sampling effects. Similar results were also obtained by Reynolds’ distance, showing that Landrace is the specialized breed with the highest relation to local breeds. The results obtained corroborate findings reported by Martinez et al. (2000), who used the same distance method and evidenced that there is a genetic differentiation between Duroc and Iberian pig breeds.
Figure 2 presents a distance tree built with the UPGMA method from Nei’s (1972) standard genetic distance matrix. Four strong groups were observed: the first one with 51% confidence formed by Landrace and Canastra, Moura, Canastrão, Baé and Caruncho; and the second group, also with 51% confidence formed by Piau, UDB, Nilo and Mamelado. There was a higher proximity between the Landrace specialized breed and the locally adapted group Canastra, showing a high bootstrapping value (77%). Large White and Duroc were more genetically distant from the other genetic groups with bootstrapping values of 73% and 100%, respectively, and composed the other two groups.
Conclusions
It can be observed that there is a weak genetic structure among all studied swine genetic groups in Pernambuco State. Landrace and Canastra, Moura, Canastrão, Caruncho and Baé are genetically close, while Duroc and Large White are the most distinct breeds, possibly because they were not part of the colonization and admixture of the local populations sampled in the region. Due to the complex admixture pattern resulting from crossbreeding between specialized and locally adapted pig breeds, the genetic variability of the 12 genetic groups can be analyzed by distributing the 190 individuals into two populations, as showed by the DeltaK statistic. This distribution corroborates the AMOVA results, which identified a low genetic differentiation level between the inferred populations. Therefore, conservation programs for pigs in this State must focus on local genetic groups in general, and not on pre-defined breeds, due to the excessive crossbreeding between the genetic groups.
Acknowledgements
The authors would like to thank CAPES/MEC for granting the scholarship to the first author; and CNPq and FACEPE for assisting in the development of this study.
References
ALEXANDER, L.J.; ROHRER, G.A.; BEATTIE, C.W. et al. Cloning and characterization of 414 polymorphic porcine microsatellites.
Animal Genetics, v.27, v.3, p.137-148, 1996a.
ALEXANDER, L.J.; TROYER, D.L.; ROHRER,G.A. et al. Physical assignments of 68 porcine cosmid and lambda clones containing polymorphic microsatellites. Mammalian Genome, n.7, v.5, p.368-372, 1996b.
ARANGUREN-MÉNDEZ, J.A.; ROMÁN-BRAVO, R.; ISEA, W. et al. Los microsatélites (STR‘s) marcadores moleculares de ADN por excelencia para programas de conservación: una revisión.
Archivos Latinoamericano de Producion Animal, v. 1 3 , n.1, p.30-42, 2005.
BARRETO, G.B. Curso de noções de saneamento rural. 2.ed. Campinas: Instituto Campineiro de Ensino Agrícola, 1973. 2 9 5 p .
BEHL, R.; SHEORAN, N.; BEHL, J. et al. Genetic analysis of Ankamali pigs of India using microsatellite markers and their comparison with other domesticated Indian pig types. Journal of Animal Breeding and Genetics, v.123, p.131-135, 2006. BOTSTEIN, D.; WHITE, R.L.; SKOLMICK, H. Construction of a genetic linkage map in man using restriction fragment length p o l y m o r p h i s m . American Journal of Human Genetics, v.32, p.314-331, 1980.
BOYCE, T.M.; ZWICK, M.E.; AQUADRO, C.F. Mitochondrial DNA in bark weevils: size, structure, and heteroplasmy. Genetics, v.123, p.825-836, 1989.
CALVO, J.H.; LOBERA, J.; OSTA, R. et al. Caracterización genética de la raza porcina chato murciano.Archivos de Zootecnia, v.49, p.53-58, 2000.
CANUL, S.M.; SIERRA, V.A.; MARTÍNEZ, M.A. et al. Caracterización genética del cerdo pelón mexicano mediante marcadores moleculares.Archivos de Zootecnia, v.54, p.267-272, 2005. CASTRO, S.T.R.; ALBUQUERQUE, M.S.N.; GERMANO, J.L.
Census of Brazilian naturalized swine breeds. Archivos de Zootecnia, v.51, p.1-5, 2002.
CHAIWATANASIN, W.; SOMCHAI, C.; SRISUWAN, C. et al. Genetic Diversity of Native Pig in Thailand Using Microsatellite Analysis.
Kasetsart Journal Natural Science, v.36, p.133137, 2002. ELLEGREN, H.B.; CHOWDHARY, M.; JOHANSSON, L. et al. A
primary linkage map of the porcine genome revels a low rate of genetic recombination. Genetics, v.137, p.1089-1100, 1994. EVANNO, G.; REGNAUT, S.; GOUDET, J. Detecting the number
o f c l u s t e r s o f i n d i v i d u a l s u s i n g t h e s o f t w a r e s t r u c t u r e : a simulation study. Molecular Ecology,v.14, p.2611-2620, 2005. EXCOFFIER, L.; LAVAL, G.; SCHNEIDER, S. Arlequin (Versão 3 .1 ) . An Integrated Software Package for Population Genetics Data Analysis. Computational and Molecular Population Genetics Lab (CMPG). Switzerland: Institute of Zoology, University of Berne, 2006. 145p.
FABUEL, E.; BARRAGÁN, C.; SILIÓ, L. et al. Analysis of genetic diversity and conservation priorities in iberian pigs based on microsatellite markers. Heredity, v.93, p.104-113, 2004. FALUSH, D.; STEPHENS, M.; PRITCHARD, J.K. Inference of
population structure using multilocus genotype data: linked loci and correlated allele frequencies. Genetics, v.164, p.1567-158, 2 0 0 3 .
FOOD AND AGRICULTURE ORGANIZATION – FAO. [2004].
Secondary Guidelines for Development of National Farm Animal Genetic Resources Management Plans Measurement of Domestic Animal Diversity: Recommended Microsatellite Markers New Microsatellite Marker Sets Recommendations of Joint ISAG/ FAO Standing Committee. In: BRADLEY, D.G.; FRIES, R.; BUMSTEAD, N. et al. (Eds.) Food and Agriculture Organization of the United Nations. Online. Available at: <http://dad.fao.org/en/refer/library/guidelin/marker.pdf> Accessed on: Feb. 02, 2009.
FREDHOLM, M.; WINTWRO, A.K.; CHRISTENDEN, K. et al. Characterization of 24 porcine (DA-DC) N microsatellites: Genotyping of unrelated animals from breeds and linkage studies.
Mammalian Genome, v.4, p.187, 1993.
GOUDET, J. [2002]. FSTAT, a program to estimate and test gene diversities and fixation indices ( v e r s i o n 2 . 9 . 3 ) . Available at: <http://www.unil.ch/izea/softwares/fstat.html>. Accessed on: Mar 15, 2010.
GUO, S.W.; THOMPSON, E.A. Performing the exact test of Hardy-Weinberg proportions for multiple alleles. Biometrics, v.48, p.361-372,1992.
KIM, T.H.; KIM, K.S.; CHOI, B.H. et al. Genetic structure of pig breeds from Korea and China using microsatellite loci. Journal of Animal Science, v.83, p.2255-2263, 2005.
LAVAL, G.; IANNUCCELLIA, N.; LEGAULT, C. et al. Genetic diversity of eleven European pig breeds. Genetic Selection Evolution, v.32, p.187-203, 2000.
LEMUS-FLORES, C.; ULLOA-ARVIZU, R.; RAMOS-KURI, M. et al. Genetic analysis of Mexican hairless pig populations.
Journal of Animal Science, v.79, p.3021-3026, 2001. LI,S.J.; YANG; S.H.; ZHAO; S.H. et al. Genetic diversity analyses of
10 indigenous Chinese pig populations based on 20 microsatellites.
Journal of Animal Science, v.82, p.368-374, 2004. M A R S H A L L , T. C . ; S L AT E , J . ; K R U K , L . e t a l . St a t i s t i c a l
conûdence for likelihood-based paternity inference in natural populations. Molecular Ecology, v.7, p.639-655, 1998. MARTÍNEZ, A.M.; PÉREZ-PINEDA, E.; VEGA-PLA. et al.
M I L L E R , M . P. T F P G A – To o l s f o r p o p u l a t i o n s g e n e t i c s a n a l y s e s. v 1 . 3 . A Wi n d o w p r o g r a m f o r t h e a n a l y s i s o f allozyme and molecular population genetic data, 2000. MAUDET, C.; LUIKART, G.; TABERLET, P. Genetic diversity
and assignment tests among seven French cattle breeds based on microsatellite DNA analysis. Journal of Animal Science, v.80, p.942-950, 2002.
N E I , M . G e n e t i c d i s t a n c e s b e t w e e n p o p u l a t i o n s . A m e r i c a n Naturalist, v.106, p.283-292, 1972.
PAIVA, S.R. Caracterização da diversidade genética de ovinos no Brasil com quatro técnicas moleculares. 2005. 108f. Tese (Doutorado em Genética e Melhoramento) - Universidade Federal de Viçosa, Viçosa, MG.
PEAKALL, R.O.D.; SMOUSE, P.E. genalex 6:genetic analysis in Excel. Population genetic software for teaching and research.
Molecular Ecology Notes, v.6, n.1, p.288-295, 2006. PRITCHARD, J.K.; STEPHENS, M.; DONNELLY, P. Inference of
population structure using multilocus genotype data. Genetics, v.155, p.945-959, 2000.
REYNOLDS, J. Estimation of the coancestry coefficient basis for a short-term genetic distance. Genetics, n.105, p.767-779, 1983. ROBIC, A.; DALENS, M.; WOLOSZYN, N. et al. Isolation of 28 new porcine microsatellites revealing polymorphism. Mammalian Genome, n.5, v.9, p.580-583, 1994.
ROHRER, G.A.; ALEXANDER, L.J.; KEELER, J.W. et al. A microsatellite linkage map of the porcine genome. Genetics, v.136, p.231, 1994.
ROHRER, G.A.; ALEXANDER, L.J.; HU, Z. et al. A comprehensive map of the porcine genome. Genome Research, v.6, p.371, 1996.
ROSENBERG, N.A. DISTRUCT: a program for the graphical display of structure results. Molecular Ecology Notes, v.4, p.137-138, 2004. SANTOS-SILVA, F.; IVO, R.; SOUSA, M.C. et al. Análise da estrutura genética de populações ovinas churras portuguesas.Archivos de Zootecnia, v.58, p.493-496, 2009.
SOLLERO, B.P.; PAIVA, S.R.; FARIA, D.A. et al. Genetic diversity of Brazilian pig breeds evidenced by microsatellite markers.
Livestock Science, v. 1 3 , p . 1 - 8 , 2 0 0 9 .
VICENTE, A.A.; CAROLINO, M.I.; SOUSA, M.C. O. et al. Genetic diversity in native and specialized breeds of pigs in Portugal assessed by microsatellites. Journal of Animal Science, v.86, p . 2 4 9 6 - 2 5 0 7 , 2 0 0 8 .
THUY, N.T.D; MELCHINGER-WILD, E.; KUSS, A.W. et al. Comparison of Vietnamese and European pig breeds using microsatellites. Journal of Animal Science, v.84, p.2601-2608, 2 0 0 6 .
VIANNA, A.T. Os suínos: criação prática e econômica. 12.ed. São Paulo: Biblioteca Rural, 1986. 384p.
WEIR, B.S.; COCKERHAM, C.C. Estimating F-statistics for the analysis of the population structure. Evolution, v.38, p . 1 3 5 8 - 1 3 7 0 , 1 9 8 4 .
YANG, S.; WANG, Z.; LIU, B.; ZHANG, G. Genetic variation and r e l a t i o n s h i p s o f e i g h t e e n C h i n e s e i n d i g e n o u s p i g b r e e d s .