Rev. Caatinga
SEVERITY OF RAMULARIA LEAF SPOT AND SEED COTTON YIELD IN
DIFFERENT SOWING TIMES
1JOÃO PAULO ASCARI2*, DEJÂNIA VIEIRA DE ARAÚJO2, LEONARDO DIOGO EHLE DIAS3, GIOVANI JUNIOR
BAGATINI2, INÊS ROEDER NOGUEIRA MENDES2
ABSTRACT – The ramularia leaf spot (RLS) disease causes cotton yield losses. Choosing a less susceptible cultivar and a sowing time that are less favorable to the pathogen contribute to the management of this disease. The objective of this work was to evaluate the severity of ramularia leaf spot on cotton cultivars sowed in two different times. The experiment was conducted in a triple factorial design (4x3x2), consisted of four cultivars, the three thirds of the plant and two sowing times, with four replications. Each plot was divided in two twin plots, one with fungicide application (with disease control) and the other without fungicide application (without disease control). The severity assessments were performed every seven days, considering each third of the plant with a diagrammatic scale. Yield was evaluated in each plot. There was a significant interaction between sowing times and the thirds of the plant in the plots without disease control for RLS severity, with the highest values of area under the disease progress curve (AUDPC) in the first sowing time (ST1) and in the lower third of the plant. The FMT705 cultivar had the highest and FM951LL the lowest value of AUDPC. The AUDPC of these cultivars were no statistically different in the second sowing time (ST2), but they had higher AUDPC values in the lower third. Highest yields were found with ST1 in plots with disease control, with no differences between the cultivars, however, lower yields were found in plots without disease control.
Keywords: Gossypium hirsutum L. Ramularia areola. Thirds of the plant.
RELAÇÃO ENTRE SEVERIDADE DA MANCHA DE RAMULÁRIA E PRODUTIVIDADE DE ALGODOEIRO EM DUAS ÉPOCAS DE SEMEADURA
RESUMO – A mancha de ramulária promove perdas de produtividade do algodoeiro, em que a escolha da cultivar menos suscetível e a época de semeadura menos favorável ao patógeno contribuem para o manejo da doença. O objetivo deste estudo foi avaliar a severidade da mancha de ramulária em cultivares de algodão conduzido em duas épocas de semeadura. O experimento foi conduzido em esquema fatorial triplo (4x3x2), sendo quatro cultivares, três terços da planta e duas épocas de semeadura, com quatro repetições. Cada parcela foi dividida em duas parcelas gêmeas, onde uma parcela recebeu aplicação de fungicidas (com controle) e a outra parcela não recebeu aplicação de fungicidas (sem controle). As avaliações de severidade foram feitas a cada sete dias, considerando cada terço da planta com auxílio de uma escala diagramática. A produtividade foi avaliada na área útil de cada parcela gêmea. Houve interação significativa entre as épocas de semeadura e terços da planta nas parcelas sem controle, onde os maiores valores da área abaixo da curva de progresso da severidade (AACPS) da mancha de ramulária foram observados na primeira época de semeadura (ES1) e no terço inferior da planta. As cultivares FMT 705 e FM 951 LL apresentaram menor e maior valor de AACPS, respectivamente. Na segunda época de semeadura (ES2), as cultivares não diferiram estatisticamente para AACPS, porém apresentaram maior valor no terço inferior. A maior produtividade ocorreu na ES1 nas parcelas gêmeas com controle, não diferindo entre as cultivares, porém foi menor quando não houve tratamento com fungicidas.
Palavras-chave: Gossypium hirsutum L. Ramularia areola. Terços da planta.
_______________ *Corresponding Author
1Received for publication in 01/20/2015; accepted in 03/28/2016.
Paper extracted from the agronomy monograph of the first author.
2Agronomy Course, Research Center for Agro-Environmental Studies and Development, Universidade do Estado de Mato Grosso, Tangara
da Serra, MT, Brazil; [email protected], [email protected], [email protected], [email protected].
Rev. Caatinga
INTRODUTION
Cotton (Gossypium hirsutum L.) has great importance in the agricultural sector (SILVA et al., 2010). This crop yields higher economic values when grown in favorable weather conditions associated with farming management, such as sowing times, spacing and density of plants, removal of crop residues and remaining plants from the previous crop, and phytosanitary control (POLIZEL et al., 2008).
The cropped area in Brazil was 976,200 hectares in 2014/2015, with a production of 3,826,500 Mg of seed cotton. The main producing regions of cotton in Brazil are: Midwest (2,461,100 Mg) and Northeast (1,250,300 Mg), in which the highest production are concentrated in the states of Mato Grosso (MT) (2,191,200 Mg) and Bahia (BA) (1,110,300 Mg), ranking Brazil as the world's fifth largest producer (CONAB, 2015).
The Brazilian Midwest region had a major development in cotton farming in the last decade, however, the use of susceptible cultivars and inadequate management of fungicide application and sowing favored the emergence of some diseases. These diseases have caused serious damage to the crops, with early occurrence and negative impacts on productivity, such as boll abortion, malformation of bolls and reduced quality of properties of fiber (CIA et al., 2008; AQUINO et al., 2008b; GILIO, 2014). Among the major diseases of cotton crops, is the ramularia leaf spot (RLS), whose etiologic agent is the fungus Ramularia areola Atk (SILVA et al., 2010).
RLS is responsible for major losses in cotton productivity because, according to Aquino et al. (2008b), the use of susceptible cultivars can reduce 75% of the yield. Gilio (2014) found yield losses of up to 36.83% with susceptible cultivars in the state of Mato Grosso.
Variations in susceptibility levels of cultivars occur probably due to emergence of new races of the pathogen and the use of cultivars that do not have resistance. (POLIZEL et al., 2008). Girotto et al. (2013) found genetic and phenotypic variability in isolates of the fungus Ramularia areola, thus, studies to establish the pathogen races are needed.
The microclimate conditions formed in the lower third of the plants (temperature between 20 and 30°C and relative humidity above 80%) (JOHNSON et al., 2013) are favorable to this pathogen and contribute to increased disease progress rate, causing premature defoliation in the lower third, progressing to the middle and upper thirds of the plant (AQUINO et al., 2008b; CURVELO et al., 2010).
Therefore, to assess RLS in each third of the plant is needed (PIZZATO et al., 2013). The disease control in Midwest region have to be carried out before the disease reach 25% of the leaf area in the
lower third, reducing the infection in the middle and upper parts of the plants (ANDRADE et al., 1999).
The use of appropriate technologies for crop implementation and management, i.e., the use of genotypes that are adapted to local conditions and less susceptible to this disease, such as TMG43WS and TMG42WS, allows good agronomic results and productivity gains (ASCARI et al., 2015). The sowing time also influences the severity of the disease, a late sowing, 35 days after the recommended time, can cause production losses of up to 49% (LACA BUENDÍA et al., 2005).
December is the most suitable month to sowing cotton in the Mato Grosso State (FIETZ et al., 2009). Gilio (2014) found higher productivity with sowing in the first half of December, with no relation with the severity of the disease in different sowing times.
In this context, studies must to be conducted to establish sowing times that reduce the disease progress, and cultivars that produce high yields due to reduced losses caused by RLS. Therefore, the objective of this work was to evaluate the severity of RLS in cotton cultivars conducted in two sowing times.
MATERIAL AND METHODS
The experiment was conducted in the experimental area of the Universidade do Estado de Mato Grosso (UNEMAT), Tangara da Serra Campus, Brazil (14°39'07"S, 57°26'02"W, and altitude of 440.0 m), which has average temperature of 24,4ºC, average annual precipitation of 1,500 mm and relative humidity ranging from 70 to 80% (DALLACORT et al., 2011). The soil of the area is classified as clayey Distroferric Red Latosol (EMBRAPA, 2013).
The experiment was conducted in a randomized block design with four replications. The area under the disease progress curve (AUDPC) was assessed with a triple factorial design (4x3x2), consisted of four cultivars, (FMT705, FMT709, IMACD8276 - late cycle, and FM951LL - medium cycle), evaluation of the disease in the three thirds of the plant (lower, middle and upper) and two sowing times (ST1 at Dec. 18, 2013 and ST2 at Jan.10, 2014), with four replications. The productivity was assessed with a double factorial design (4x2), consisted of the four cultivars and two sowing times, as described above.
Soil acidity correction and fertilization were performed according soil analysis results following recommendations of Sousa e Lobato (2004). Dolomitic lime (2 Mg ha-1) was applied for acidity
correction. Sowing fertilization was performed with 625 kg ha-1 of Mono
-Ammonium Phosphate (48% P2O5; 9% N) and 85 kg ha-1 of potassium chloride
Rev. Caatinga
30 days after sowing (DAS) with 135 kg ha-1 of urea
and 68 kg ha-1 of potassium chloride, and 50 DAS
with 135 kg ha-1 of urea and 68 kg ha-1 of potassium
chloride. The micronutrients applied were zinc sulfate (5 kg ha-1; 30% Zn) and boric acid (0.5 kg ha -1; 17% B). Sowing were performed manually and
thinning was performed 25 DAS to a final stand of 88,888 plants ha-1.
Each plot was divided in two twin plots (BERGAMIN FILHO, 2011), one with fungicide application (with disease control), aiming to maintain the disease at low severity, and the other without fungicide application (without disease control), allowing the maximum severity of the disease in the plot.
The plots were 5.0 m long and 8.0 m wide, and each twin plot consisted of four plant rows, totaling eight rows per plot, with spacing of 0.90 m. The evaluated area of the twin plots consisted of the two central rows discarding 0.50 m from each end.
The uniformity of inoculum in the area was maintained by adding a row with the cultivar FMT701, considered susceptible to the fungus R.
areola (DIAS; THEODORO, 2013) next to each
plot. Three rows with maize were added around the entire experimental area to minimize interference from external environmental factors (PIZZATO et al., 2013).
Fungicide applications were performed 67 days after emergence (DAE), when the disease first appeared in the area, and then every seven days up to 119 DAE, using a CO2-pressurized backpack sprayer
with flow rate of 150 L ha-1. Active ingredients were
used in rotation (trifloxystrobin 60 g ha-1 +
prothioconazole 70 g ha-1; pyraclostrobin 100 g ha-1;
and difeconazole 75 g ha-1) (DIAS et al., 2015). A
ethyleneoxy-based nonionic adhesive spreader (200 g L-1) was used to improve distribution and
penetration of fungicides.
Weeds were controlled with pre and post -emergent herbicides and manual weeding. Insect pests control was performed when the insect population reached the control level.
Three growth regulator applications were performed in both sowing times, the first at phenological stage F (first flowers opening period), the second at phenological stage FC (flower opening
period and first boll opening) and the third at phenological stage C (opening and formation of bolls), as proposed by Lamas e Ferreira (2006).
Six plants from each twin plot were marked for RLS severity assessments, which were performed in each third of the plant, lower (up to the 7th node of
the main branch), middle (8th to 14th node) and upper
(above the 15th node), as proposed by Aquino et al.
(2008a).
Severity assessments began 75 DAS, by the disease appearance in the area, and ended 125 DAS, when the plants had high defoliation index, with seven-day intervals, performed separately in the lower, middle, and upper thirds in both sowing times, assigning percentages of the disease according to the amount of leaf area affected with the diagrammatic scale proposed by Aquino et al. (2008a).
The averages from these results were used to calculated the AUDPC as proposed by Shaner e Finney (1977), using the equation:
Where, ni is the number of evaluations, yi is
the RLS severity in the "i" observation and ti+1-tj is
the time interval between assessments.
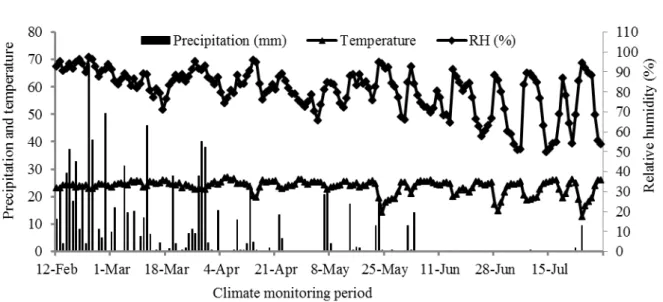
The climate data were monitored during the experiment by an Automatic Weather Station of the Instituto Nacional de Meteorologia (INMET), installed 200 meters from the experimental area (Figure 1).
Manual harvesting was performed 175 DAS, when 80-90% of bolls were opened in all thirds of the plant. Yield data was calculated based on average values of each twin plot (with and without control), analyzing separately only the factors sowing times and cultivars. The seed cotton was taken to the Laboratory of Plant Pathology, weighed in a scale with accuracy of 0.0001 kg and the yield values were extrapolated to kg ha-1.
AUDPC and yield data were subjected to analysis of variance and their means were compared by Scott-Knott test at 5% probability (p≤0.05) using the statistical program SISVAR (FERREIRA, 2011). The AUDPC normality data was adjusted by the equation .
AUDPC= yi+yi+1
2 * ti+1-ti n-1
i=1 ,
1
Rev. Caatinga
Figure 1. Precipitation (mm), temperature (°C) and relative humidity (%) averages monitored during the evaluation period of the RLS disease in cotton crops.
RESULTS AND DISCUSSION
The plants had rapid canopy closure due to the high rainfall volume from February to July 2014, and the microclimate conditions formed in the lower third were favorable to the development of the disease. The evaluations coincided with periods of air humidity (80 to 90%) and temperature (12.5 to 26.2ºC) within the ideal range for fungal growth (Figure 1), which may have contributed to the higher AUDPC in ST1. These results confirm those found by Johnson et al. (2013), who stated that the fungus
R. areola has optimal development at temperature
from 20 to 30°C and relative humidity above 80%. The frequent rainfall conditions and constant and high relative air humidity may have contributed to a longer opening time of the stomata, since the presence of water on the leaf surface cause an increase in the turgor pressure of guard-cells that allows the stomata opening (OLIVEIRA et al., 2010). Moreover, fungi may release substances such as terpenoids which increase the potassium flow in
guard cells and induce a longer opening time of the stomata, facilitating the fungus hyphae penetration (TURNER; GRANITI, 1969).
The ST1 presented higher rainfall volume and relative humidity, thus, the stomata opening time of these plants was longer, and possibly favored the fungus hyphae penetration and colonization to the leaf tissue in both cotton leaf faces, leading to a greater AUDPC. Curvêlo et al. (2010) confirm these results, in a study on infectious process of R. areola on cotton leaves via scanning electron microscopy, they found that the penetration and colonization of cotton leaf tissue occurred via stomata, and stated that it is the main route of infection of various fungal pathogens.
There was a significant interaction between sowing time (ST) and thirds of the plant (TP) in the plots without disease control, with the greatest AUDPC values in the ST1. AUDPC values were higher in the lower third of the plants in both sowing times (Table 1).
Table 1. Interaction between sowing times (ST) and thirds of the plant (TP) for the area under the disease progress curve of ramularia leaf spot (RLS), in plots without disease control (AUDPC -WC), in cotton crops.
Means with same letter in the column and capital in the line do not differ by the Scott-Knott test (p≤0.05). Data were
processed by the equation .x+0.5
The evaluations showed great severity fluctuations in the thirds of the plant, probably due to the different microclimate conditions formed and the age of the leaves, with higher AUDPC values in the lower third. These results differ from those found by Pizzato et al. (2013), who evaluated the severity of
RLS with spacing between rows of 0.45 and 0.9 m, and found a higher AUDPC value in the middle third of the plants, followed by the upper, that were not statistically different from the lower thirds. The results also differ from those found by Schaedler et al. (2013), who found higher AUDPC values of RLS
Sowing times Thirds of the Plant
Lower Middle Upper
AUDPC-WC
ST1 473.46 bC 268.85 bB 58.61 bA
ST2 219.77 aC 148.13 aB 16.76 aA
CV (%) 20.19
Rev. Caatinga
in the middle third of cotton plants grown in a greenhouse, and the fungicide treatment maintained the severity of the disease below 20% of infected leaf area in the lower third.
However, the results were similar to those found by Aquino et al. (2008b) and Pizzato et al. (2014), who reported a marked increase in inoculum source due to microclimatic conditions in the lower third of the plants favored the fungi growth, and because of the moisture accumulated by the canopy closure. They concluded that the increase of inoculum in the area raised the severity levels of the disease, which consequently caused increased infection of the middle and upper thirds successively.
Differences in fluctuation of disease severity may occur due to variations in number of leaves in the different thirds of the plant, the influence of the pathogen inoculum source in the area, cultivar susceptibility levels and climatic conditions (VOLPONI et al., 2014). Thus, a precocious defoliation in the lower part of the canopy of plants is normal (PIZZATO et al., 2013; 2014) in field conditions, with lesions on the leaf area of up to 67.20% (AQUINO et al., 2008a).
There were problems for the lower third evaluations because the high severity of disease in the canopy increased the leaf abscission rate, and the evaluation method did not consider the quantification of damages caused by RLS.
Thus, the assessment method was adapted,
attributing a maximum score of disease for this third of the plant. Pizzato et al. (2014) also adapted the assessment method, but attributing a disease severity score of zero for the lower third of the plant due to the high rate of leaf abscission.
Differences between assessment methods must be considered for comparing results, since they increase or lower AUDPC values. Thus, the middle third of the plant is considered the most reliable for assessment of severity of RLS, which preferably should be performed weekly from the time when the disease is detected in the area for monitor the pathogen in field conditions.
Regarding the sowing times evaluated, greater AUDPC values of RLS were found in ST1, considering the thirds of the plant and cultivars. Similar results were found by Gilio (2014), who evaluated the damage by RLS in different genotypes of cotton and found higher AUDPC values in the first sowing time (Dec. 15, 2012) compared to the second sowing (Jan. 15, 2013) using the cultivars FMT705, FMT707, IAC09-848, IMA08-12427 and IMA09-474. However, this author found different results for cultivars FM951LL and FMT709, with higher AUDPC in the second sowing time.
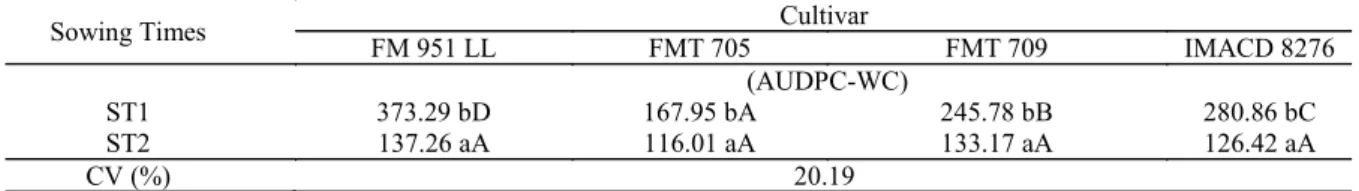
There was a significant interaction between sowing times (ST) and cultivars (Cv) for AUDPC in plots without control. ST1 presented AUDPC values higher than ST2, and the cultivar FMT705 had the lowest and FM951LL the greatest severity (Table 2).
Table 2. Interaction between sowing times (ST) and cultivars (Cv) for the area under the disease progress curve of ramularia leaf spot (RLS), in plots without disease control (AUDPC -WC), in cotton crops.
Means with same letter in the column and capital in the line do not differ by the Scott-Knott test (p≤0.05). Data were
processed by the equation .
1
x+0.5.These results confirm those found by Gilio (2014), who reported that the cultivar FMT705 is considered resistant to RLS in Tangara da Serra MT, presenting lower disease severity compared to the other cultivars. Cia et al. (2013) found that this cultivar presented resistance to RLS in the Primavera do Leste MT and susceptibility in Ituverava SP, which indicates a genetic variation of the pathogen.
Silva et al. (2011) found results similar to those from the ST2, with the cultivars FMT705, FMT709 and IMACD8276 with similar resistance levels. However, these results differ from those found in the ST1, in which only the cultivar FMT705 presented low AUDPC. The results found in ST2 differ from those found by Dias et al. (2015), who evaluated cultivars in a dense spacing (0.45 m) in a winter crop and found that the FMT709 and
IMACD8276 cultivars had the highest severity index, while the FM951LL was less susceptible to RLS.
The sowing times influenced the AUDPC of RLS in the cultivars. The ST1 had greater disease severity in all cultivars compared to the ST2 (Table 2). The susceptibility differences between cultivars can be explained by the influence that the sowing time of a region has on the genotypes and disease, as well as the possible phenotypic and genotypic variability of the fungus R. areola (CIA et al., 2013; FUZATTO et al., 2013; GIROTTO et al., 2013).
Regarding the disease action in different cultivars, is difficult to compare the results with other researches due to the influence of climatic conditions on the host physiology, as well as the possibility of genetic variations of the pathogen.
Sowing Times Cultivar
FM 951 LL FMT 705 FMT 709 IMACD 8276
(AUDPC-WC)
ST1 373.29 bD 167.95 bA 245.78 bB 280.86 bC
ST2 137.26 aA 116.01 aA 133.17 aA 126.42 aA
Rev. Caatinga
Galbieri et al. (2011) confirmed this assumptions studying the cultivar FM966LL in different locations, and finding susceptibility to RLS in Primavera do Leste MT and resistance in Ribeirão Preto SP.
R. areola genotypic variation was also found
by Pezenti et al. (2013) studying fungi isolates from a cotton crop with three cultivars. Similar results were also found by Girotto et al. (2013) assessing the
genetic variability of 16 isolates of R. areola. Despite these results, no studies have proven the existence of different races of this fungus.
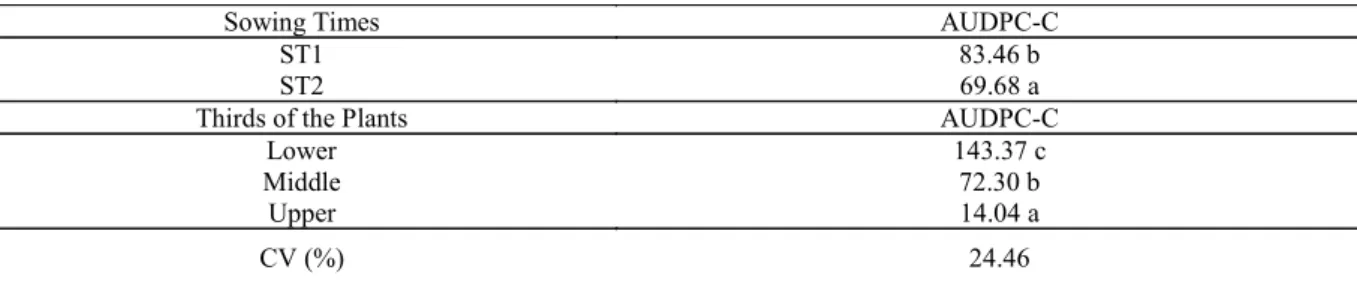
The AUDPC in plots with disease control had no significant interaction, however, sowing times (ST) and thirds of the plant (TP) were statistically different. The ST1 had higher AUDPC values (83.46) than the ST2 (69.68), with the highest value in the lower third (143.37) (Table 3).
Table 3. Area under the disease progress curve of ramularia leaf spot (RLS), in plots with disease control (AUDPC-C) in
cotton crops for sowing times (ST) and thirds of the plant.
Means with same letter in the column and capital in the line do not differ by the Scott-Knott test (p≤0.05). Data were
processed by the equation .x+0.5
The plots with disease control had lower values in thirds of the plant compared to the plots without application of fungicides. Thus, the chemical control is an important management practice in cotton production, since the lower severity of RLS may reflect in higher yield (Table 4). Considering the low AUDPC value in plots with control, Suassuna et al. (2006), Schaedler et al. (2013) and Dias et al. (2015) reported the importance of preventive chemical control of the disease using
fungicides of different active ingredients, in order to increase the efficiency of control, decrease sporulation and the spread of the fungus inoculum in the field.
Yield had no significant interaction between sowing times (ST) and cultivars (Cv) in plots without disease control, however, the sowing time differed statistically. The cotton cultivars had higher yields in ST1 (Table 4), confirming this time as the best to cotton sowing in Tangara da Serra-MT.
Table 4. Yield (kg ha-1) of cotton cultivars in plots with and without disease control with fungicides depending on sowing
times (ST).
Means with same letter in the column and capital in the line do not differ by the Scott-Knott test (p≤0.05). ns = Not
significant.
The minimum (3,027.39 kg ha-1) and
maximum (3,650.46 kg ha-1) yield in plots with
disease control were similar to the Mato Grosso State average (3,894 kg ha-1) (CONAB, 2015). ST1 may
have had the highest yield due to the influence by the weather conditions during the experiment (Figure 1), which were favorable to the development of plants. The yield of the two sowing times in plots with disease control were higher than those found by Pizzato et al. (2013) for the FMT701 cultivar (2,939 kg ha-1) in Tangará da Serra MT.
Silva Filho et al. (2008) assessed the economic importance of cotton in Mato Grosso State
through the crop adaptability and stability and found average yields of 2,048 kg ha-1 (Primavera do Leste)
and 5,449 kg ha-1 (Campo Verde).
The average yield in ST2 was about 17% lower than the ST1. According to Fietz et al. (2009), December is the most suitable month for sowing cotton in Mato Grosso State. Moreover, Laca Buendía et al. (2005) found cotton yield losses of 29.45% (sowed in December, 17) and 49.06% (sowed in December, 30) in Uberaba MG, compared to the first half of November.
Based on these results, is important to conduct field experiments in cotton regions, in order
Sowing Times AUDPC-C
ST1 83.46 b
ST2 69.68 a
Thirds of the Plants AUDPC-C
Lower 143.37 c
Middle 72.30 b
Upper 14.04 a
CV (%) 24.46
1
Sowing Times Yield (kg ha
-1
)
With control Without control
ST1 3,650.46a 2,525.26ns
ST2 3,027.39b 2,428.94ns
Rev. Caatinga
to indicate the best sowing time in each region. The results presented in this study may contribute to a better understanding about the RLS disease in cotton cultivars as well as assist in define sowing times, cultivars to be used and monitoring of RLS.
CONCLUSIONS
The first sowing time (December 18, 2013) presented greater severity of RLS disease, according to the area under the disease progress curve (AUDPC), and higher yield compared to the second sowing (January 10, 2014).
The cultivar FMT705 was less susceptible to RLS, followed in order of increasing susceptibility by the cultivars FMT709, IMACD8276 and FM951LL. The lower third of the plants presented the highest AUDPC of ramularia leaf spot in the two sowing times for all cultivars.
The recommendations for Mato Grosso State are cotton sowing time in December, the cultivar FMT705, which had less susceptible to RLS, and monitoring the disease carried out in the middle third of the plant, preferably with seven-day intervals.
REFERENCES
ANDRADE, P. C.; NETO, D. C.; MACHADO, A. R. Controle químico de doenças em algodão no Mato Grosso. Fitopatologia Brasileira, Brasília, v. 25, n. 1, p. 262, 1999.
AQUINO, L. A. et al. Elaboração e validação de escala diagramática para quantificação da mancha de ramulária do algodoeiro. Summa Phytopathologica, Botucatu, v. 34, n. 4, p. 361-363, 2008a.
AQUINO, L. A. et al. Controle alternativo da mancha de ramulária do algodoeiro. Revista Summa Phytopathologica,Botucatu, v. 34, n. 2, p. 131-136, 2008b.
ASCARI, J. P. et al. Influência da mancha de ramulária nos caracteres vegetativos e produtivos de cultivares de algodoeiro. In: JORNADA CIÊNTIFICA DA UNEMAT, 6., 2015, Cáceres. Anais... Cáceres: UNEMAT, 2015. p. 1-5.
BERGAMIN FILHO, A. Avaliação de danos e perdas. In: AMORIN, L; REZENDE, J. A. M.; BERGAMIN FILHO, A. (Eds.). Manual de fitopatologia: Princípios e conceitos. 4. ed., Piracicaba: Editora Agronômica Ceres, 2011. p. 672 -690.
CIA, E. et al. Reação de cultivares e linhagens de algodoeiro às principais doenças que ocorrem em
regiões produtoras do Brasil. Revista Ceres, Viçosa, v. 55, n. 6, p. 518-524, 2008.
CIA, E. et al. Reação de genótipos de algodoeiro à mancha de ramulária em diferentes épocas e ambientes. Summa Phytopathologica, Botucatu, v. 39, n. 3, p. 193-197, 2013.
CONAB. Acompanhamento da safra brasileira de grãos: Décimo levantamento, Safra 2014/15. 2. ed. Brasília, DF: CONAB, 2015. 108 p.
CURVÊLO, C. R. S. et al. Microscopia eletrônica de varredura do processo infeccioso de Ramularia
areola em folhas de algodoeiro. Tropical Plant
Pathology, Viçosa, v. 35, n. 2, p. 108-113, 2010.
DALLACORT, R. et al. Distribuição das chuvas no município de Tangará da Serra, médio norte do Estado de Mato Grosso, Brasil. Acta Scientiarum Agronomy, Maringá, v. 33, n. 2, p. 193-200, 2011.
DIAS, A.; THEODORO, G. F. Progresso de
Ramularia areola em cultivares de algodoeiro no
Cerrado Sul-Matogrossense. In: CONGRESSO BRASILEIRO DE ALGODÃO, 9., 2013, Brasília. Anais... Brasília: Embrapa Algodão, 2013. 1p.
DIAS, L. D. E. et al. Controle de mancha de ramulária em algodão adensado. Revista Cultivar
-Grandes Culturas, Pelotas, v. 1, n. 187, p. 8-11, 2015.
EMBRAPA. Empresa Brasileira de Pesquisa Agropecuária. Sistema brasileiro de classificação de solos. 3. ed. Brasília, DF: Embrapa informação tecnológica, 2013. 353 p.
FERREIRA, D. F. Sisvar: a computer statistical analysis system. Ciência e Agrotecnologia, Lavras, v. 35, n. 6, p. 1039-1042, 2011.
FIETZ, C. R.; COMUNELLO, É.; LAMAS, F. M. Análise da época de semeadura do algodoeiro em Mato Grosso com base na precipitação provável. 1. ed. Dourados: Embrapa Agropecuária Oeste, 2009. 5 p. (Circular Técnica, 16).
FUZATTO, G. M.; CIA, E.; KONDO, J. I. Estabilidade fenotípica, um complemento relevante na avaliação e classificação de genótipos de algodoeiro para resistência a doenças. Summa Phytopathologica, Botucatu, v. 39, n. 2, p. 117-121, 2013.
GALBIERI, R. et al. Desempenho de genótipos de algodoeiro na presença ou não de rotação de cultura
com Crotalaria spectabilis, em área infestada com
Meloidogyne incognita. Tropical Plant Pathology,
Rev. Caatinga
GILIO, T. A. S. Divergência genética em genótipos de algodoeiro e quantificação de danos causados pela mancha de ramulária. 2014. 69 f. Dissertação (Mestrado em Genética e Melhoramento de Plantas) – Universidade do Estado de Mato Grosso, Tangará da Serra, 2014.
GIROTTO, L. et al. Identification of phenotypic and genotypic variability among the isolates of
Ramularia areola of Brazilian Cotton. American
Journal of Plant Sciences, Temuco, v. 4, n. 9, p. 1893-1898, 2013.
JOHNSON, I. et al. Epidemiol ogy of grey mildew and Alternaria blight of cotton. Archives of Phytopathology and Plant Protection, Berlin, v. 46, n. 18, p. 2216-2223, 2013.
LACA BUENDÍA, J. P. et al. Avaliação de épocas de plantio para genótipos precoces de algodoeiro herbáceo no município de Uberaba-MG. Fazu em Revista, Uberaba, v. 1, n. 2, p. 3-10, 2005.
LAMAS F. M.; FERREIRA A. C. B. Reguladores de crescimento na cultura do algodoeiro. 1. ed. Brasília, DF: Embrapa Agropecuária Oeste, 2006. 4 p. (Comunicado Técnico, 121).
OLIVEIRA, M. I. P. et al. Comportamento estomático em plantas mamoneira e algodoeiro sob deficiência hídrica em diferentes temperaturas. In: CONGRESSO BRASILEIRO DE MAMONA, 4.
SIMPÓSIO INTERNACIONAL DE
OLEAGINOSAS ENERGÉTICAS, 1., 2010, João Pessoa. Anais... Brasília: Embrapa Algodão, 2010. p. 1224-1229.
PEZENTI, L. F. et al. Phenotypic variability among isolates of Ramularia areola from Brazilian cotton. Tropical Plant Pathology, Viçosa, v. 38, n. 4, p. 329-321, 2013.
PIZZATO, J. A. et al. Epidemiologic study of
Ramularia areola under different soil covers and
spacings, for cotton crops. American Journal of Plant Sciences, Temuco, v. 4, n. 11, p. 2049-2059, 2013.
PIZZATO, J. A. et al. Geostatistics as a methodology for studying the spatiotemporal dynamics of
Ramularia areola in cotton crops. American
Journal of Plant Sciences, Temuco, v. 5, n. 9, p. 2472-2479, 2014.
POLIZEL, A. C. et al. Reação de genótipos de algodoeiro quanto à severidade de manchas foliares. Bioscience Journal, Uberlândia, v. 24, n. 3, p. 8-12, 2008.
SCHAEDLER, L. S. et al. Eficácia de fungicidas no controle de Ramularia areolain vitro e em casa de vegetação. Enciclopédia Biosfera, Goiânia, v. 9, n. 17, p. 1227-1240, 2013.
SHANER, G.; FINNEY, R. E. The effect of nitrogen fertilization on the expression of slow mildewing resistence in knox wheat. Phytopathology, Saint Paul, v. 67, n. 8, p. 1051-1056, 1977.
SILVA FILHO, J. L. et al. Comparação de métodos para avaliar a adaptabilidade e estabilidade produtiva em algodoeiro. Pesquisa Agropecuária Brasileira, Brasília, v. 43, n. 3, p. 349-355, 2008.
SILVA, J. C. et al. Avaliação do comportamento de cultivares de algodoeiro à mancha de ramulária. In: CONGRESSO BRASILEIRO DO ALGODÃO, 8., 2011, São Paulo. Anais... Brasília: Embrapa Algodão, 2011. p. 336-341.
SILVA, R. R.; THEODORO, G. F.; STAUDT, R. C. Avaliação da incidência de doenças em algodoeiros cultivados na região de chapadão do sul. Revista Brasileira de Oleaginosas e Fibrosas, Campina Grande, v. 14, n. 2, p. 91-95, 2010.
SOUSA, D. M. G.; LOBATO, E. Cerrado: correção do solo e adubação. 2. ed. Brasília, DF: EMBRAPA, 2004. 416 p.
SUASSUNA, N. D.; COUTINHO, W. M.; MORELLO, C. L. Resistência genética de algodoeiro à mancha de ramulária. 1. ed. Brasília: Embrapa Algodão, 2006. 4 p. (Comunicado Técnico, 273).
TURNER, N. C.; GRANITI, A. Fusicoccin: a fungal toxin that opens stomata. Nature, Frederick, v. 223, n. 1, p. 1070-1071, 1969.