Application and validation of a warning system for grapevine downy mildew control
using fungicides
Erlei Melo Reis
1, Olavo Roberto Sônego
2& Cristiano de Sales Mendes
31Faculdade de Agronomia e Medicina Veterinária, Universidade de Passo Fundo, 99001 970 Passo Fundo, RS, E-mail: [email protected]; 2Embrapa Uva e Vinho, Cx. Postal 130, CEP 95700 000, Bento Gonçalves, RS; 3COODETEC – Cooperativa Central de Pesquisa Agrícola, Cascavel, PR
Autor para correspondência: Erlei Melo Reis ([email protected]) Data de chegada: 20/01/2010. Aceito para publicação em: 20/01/2013.
1633
RESUMO
Palavras-chave adicionais: Plasmopara viticola, Vitis vinifera, sistema de previsão, controle químico. A maioria dos sistemas de aviso para o controle de doenças de
pl a nt a s u t ili za m c omo fu nda men to o mod elo c lim á ti co ba sea do n a s i n t e ra ç õ e s e n t re a d u r a ç ã o d o m ol h a m en t o fo l i a r e a temp era tu r a médi a ness e perí odo so bre a intens ida de da doe nça a lvo. N o desenvolvimento de u m modelo de aviso pa ra o controle do míldio da videira foi u sado uma equ ação gerada por Lala ncette
et al., (7). Com esta equação foi elaborada uma tabela de períodos c r ít i c o s e p r og r a m a do u m a p a r e lh o c o mp u t a do r i z a do , o qu a l registra, através de sensores eletrônicos, a du ração do molhamento fo li a r , a t e m pe r a t u r a m éd i a ne s s e pe r í o do e a u t o m a ti c a m en t e ca lcula o valor diário de probabilidade de ocorrência da infecçã o.
Reis, E.M.; Sônego, O. R.; Mendes, C. S. Aplicação e validação de um sistema de aviso para o controle do míldio da videira, com fungicidas. Summa Phytopathologica, v.39, n.1, p.10-15, 2013.
O sistema foi validado na Embrapa Uva e Vinho, em Bento Gonçalves – RS, conduzido nas safras a grícolas de 2000 /01, 200 2/03 e 2 003/ 2004 utilizando-se o cultivar Isabel. O sistema convencional utilizado pelos produtores foi compa ra do com o modelo de a viso utilizando como critério indicador do momento para a aplicação e reaplicação de fu ngicida s, diferentes soma s dos valores diá rios de severidade (SVDS). O SVDS de 12 – 14, experimentos conduzidos em 200 3/04 mostrou -se promissor pa ra indica r a primeira e o interva lo da s a plica ções de fu ngicida s, tendo redu zido em 3 7 ,5 % o nú mero de aplicações e ma ntendo eficácia de controle da doença em folhas e ca chos, semelhante ao sistema convenciona l.
Grape (Vitis vinifera L.) cultivation in Brazil consists of around 57,000 hectares, with a mean yield of 15 t/ha (10). Fungal diseases are the main factors contributing to yield reduction. Downy mildew caused by the Oomycete Plasmopara viticola (Berk. & Curt.), a Stramenopile, is considered the most important disease affecting grape in Brazil on account of frequent severe epidemics and destruction (6). The main method for controlling downy mildew is fungicide application. At the present in Brazil, useful technical information for the critical timing of fungicide treatments to control the disease is not
available and a scientific basis for timing fungicides is lacking. In general, from 8 to 10 sprayings are used per season for downy mildew control. The cost of chemical control is approximately 36% of the total cost of grape production (4). At present, fungicide applications are timed according to a pre-fixed calendar, not considering the pathogen biology, the plant phenologic stages or the suitability of micro-climate conditions for mildew epidemics. In several other countries, disease risk information is available to growers. This piece of information is often derived from disease simulation models that predict the risk of Most wa rning systems for pla nt disea se control a re ba sed on
weather models dependent on the relationships between leaf wetness du ra tion a nd mea n air tempera tu re in this period considering the target disease intensity. For the development of a warning system to control grapevine downy mildew, the equation generated by Lalancette
et al. (7) was used. This equation was employed to elaborate a critical period table and program a computerized device, which records, though electronic sensors, leaf wetness duration, mean temperature in this period and automatically calculates the daily value of probability of infection occurrence. The system was valida ted a t Embrapa Uva e
Reis, E.M.; Sônego, O. R.; Mendes, C. S. Application and validation of a warning system for grapevine downy mildew control using fungicides. Summa Phytopathologica, v.39, n.1, p.10-15, 2013.
Vinho, in Bento Gonçalves – RS, during the growing seasons 2000/ 0 1, 2 0 02 /0 3 a nd 20 03 /20 04 , u sing the gra pe cu ltiva r Isa bel. The conventional system u sed by loca l growers was compared with the new warning system by using different cumulative daily disease severity values (CDDSV) as the criterion to schedule fungicide application and reapplication. In experiments conducted in 2003/04, CDDSV of 12 – 14 showed promising to schedule the first spraying and the interval between fungicide applications, reducing by 3 7.5 % the nu mber of applications and mainta ining the same control efficiency in leaves and bunches, similarly to the conventional system.
Additional keywords: Plasmopara viticola, Vitis vinifera, forecaster system, chemical control. ABSTRACT
disease based on micro-climate data from weather stations in vineyards, regional climate conditions, pathogen biology and ecology, and grape phenology (13, 14).
Warning systems based on micro-climate models can be developed by u sing pu blish ed data, contain in g information su ch as the relationships of vineyard weather factors related to the host infection by the pathogen (11). Warning systems are often based on tables that describe the interaction between leaf wetness duration, mean air temperature during the wet period and their relationship to predict the disease progress. Examples of such models for various pathogens include those developed for diseases affecting potato and tomato by Hyre (5), potato by Wallin (17), tomato by Madden et al. (9), apple scab by Ellis et al. (3), and carrot by Abraham et al. (1).
The aims of the present study were to develop and validate a warning system to rationalize the control of grape downy mildew using fungicides. A validated model has the potential to increase the chemical control efficiency, decrease the required number of fungicide sprayings, lower the cost of crop production and reduce the negative impact of chemicals on the environment.
MATERIAL AND METHODS
The model development
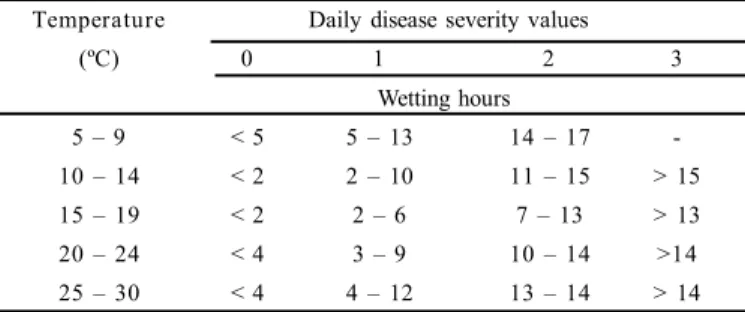
The following equation of Lalancette et al. (7) was evaluated as a basis of a warning system to time fungicide sprayings against downy mildew: S = (-0.071 + 0.018T-0.0005T2+0.01) (1+(exp(-(0.24wp)) + (0.07wpT)) – (0.0021*(wp*T2))*1/ (-1.2)*11.2, where S = downy mildew leaf severity, T = mean air temperature during the leaf wetness period, and wp = hours of continuous leaf wetness. Four classes of daily disease severity value (DDSV), designated as 0, 1, 2, and 3, were used to correspond respectively to zero, light, moderate and severe infection risk, as proposed by Sutton (16). Five classes of temperature range were used and indicated in Table 1. This equation was employed in combination with Excel 6.0 electronic sheet (Micorsoft 2000, Microsoft Corporation) to elaborate Table 1. Leaf wetness values were calculated for each DDSV based on the data for the disease severity in each temperature range. The effect of temperature was estimated for increments of 1.0oC and the variation of wetness, for increments of 1.0 h. Estimated values of leaf wetness duration are shown in Table 1, which illustrates the interactions among four temperature ranges and 19 leaf wetness duration periods. This table was uploaded in an automatic weather station (AWS) equipped with a Colpam 40 (www.elomed.com.br) data logger which calculated leaf wetness duration to indicate the current DDSV. These scores were used to validate the model in field experiments.
Model validation experiments
Validation experiments were conducted at Embrapa Uva e Vinho in Bento Gonçalves, RS, in 3.0 x 2.0 m vine spacing using the grape cultivar Isabel (Vitis labrusca L.), moderately susceptible to downy mildew.
Experiment 1: Season 2000/01
In the first step, the following treatment programs were tested: 1) Control without fungicide application; 2) Fungicide applied according to the growers’ conventional method of spraying at 7 - 10 day interval (first application with shoots of 15 cm long); 3) Timed fungicide applications according to the cumulative daily disease severity values (CDDSV), recorded and calculated by the data logger, as triggered by
a CDDSV of 8 - 12; 4) As previously, but triggered by DDSVS of 13 - 16; 5) As previously, but triggered by a CDDSV of 17 - 20; and 6) As previously, but triggered by a CDDSV of 21 - 24. Dimethomorph (150 g.L-1) at 150 g.100L-1 water was applied at a rate of 50 to 1000 L.ha-1 depending on the grape canopy growth. The system triggered the first and subsequent sprayings.
Experiment 2: Season 2002/03
In this season, the following treatments were compared: 1) Control without fungicide applications; 2) Sprayings timed according to the grower’s conventional method using mancozeb (3.0 kg.ha-1) and cymoxanil + maneb (ready mix) (2.5 kg.ha-1) at every 7 – 8 days; 3) Spraying of mancozeb (3.0 kg /ha) triggered by a CDDVS of 12 – 14; and 4) Spraying of fungicide cymoxanil + maneb (2.5 kg.ha-1) triggered by CDDVS of 12 – 14. Applications were performed with an air blast sprayer delivering 600 to 800 L.ha-1 according to the grape canopy development.
Experiment 3. Season 2003/04
In this season, the following treatments were tested: 1) Control without fungicide application; 2) Sprayings according to the grower’s conventional method, applying cymoxanil + maneb (2.5 kg.ha-1) at every 7 – 8 days; 3); Spraying of cymoxanil + maneb (2.5 kg.ha-1) triggered by CDDSV of 12 – 14. Fungicides were applied by using the same equipment as in Experiment 2.
Experimental design
The tested vineyards were divided into plots comprising three rows each, three vines in a completely randomized block design and four replicates. The area under the disease progress curves (AUDPC) and Tukey’s multiple range test for mean comparison were used (2). Disease assessment - In the growing season2000/01, the severity of downy mildew was weekly assessed on the leaves of four shoots per vine for three vines/plot. These data were used to draw the disease progress curves and calculate the AUDPC.
In 2002/03 and 2003/04, both leaf incidence and severity were assessed for 100 leaves taken arbitrarily from each plot, and the disease severity was evaluated for bunches according to the scale 0 – 5, where 0 = absence of symptoms; 1 = up to 5% of the bunch infected; 2 = 6 – 10%; 3 = 11 – 25%; 4 = 26 - 50%; 5 = more than 50% of the bunch infected.
Environmental data - A Colpam – 40 (AWS) data logger with sensors to measure leaf wetness duration and mean air temperature was installed in a control plot at the beginning of flowering for each experiment. The sensors were placed among the foliage and protected from direct sunlight.
RESULTS AND DISCUSSION
The model system
Warning systems for grape downy mildew have been developed and reported in other countries (8, 13, 14, 15). However, the technical information in these reports did not contain sufficient details for their validation in the field in Rio Grande do Sul State.
Treatments AUDPC
0 10 20 30 40 50 60
0 10 20 30 40 50 60 70
Assessments (Days after bud burst)
D
is
eas
e
sev
er
it
y
(
%
)
Check 1,025.0 a Firecasting CDDSV (21-24) 709.0 a Forecasting CDDSV (17-20) 670.0 b Forecasting CDDSV (13-16) 612.0 b Forecasting CDDSV (8-12) 596.0 b Conventional system 500.0 b develop a warning system. Madden et al. (9) described a system to
forecast grape downy mildews based on their previous study. Most predicting systems, based on models using micro-climate data, utilize a critical period definition to forecast events by P. viticola infection. A population of fungal spores do not synchronically germinate in response to free water and temperature, so that different infection proportions (rates) and, in consequence, different disease intensities occur due to environmental factors. Each individual spore in a pathogen ic population has specific wetness duration and temperature requirements to successfully complete infection (16). On the other hand, different disease intensities can be obtained through different inoculum concentrations, different temperatures and/or different leaf wetness durations. Hence, the interactions between leaf wetness duration and mean temperature during this period are the fundamental key of the warning systems based on the micro-climate effect on the infection process. Thus, they are named micro-climate models to forecast the infection process in plants (16).
The micro-climate model is based on the requirement for infection to occur and the plant disease triangle to be completed. In other words, the following are required at the same time and site: the host plant (susceptible green tissues of grapevine), the pathogen (P. viticola), and a favorable environment. Mendes et al. (12) reported that spores of P. viticola are disseminated by the air every week throughout the year in Bento Gonçalves County – RS. Thus, leaf infection may potentially begin soon after the buds bu rst provided that th e microclimate con ditions, mainly leaf wetness and temperature, are favorable. In the present investigation, the model described in Table 1 was employed to determin e favorableness of these variables for infection and optimal times to apply fungicides against downy mildew in vineyards near Bento Gonçalves.
Model validation experiments Experiment 1: Season 2000/01
In this season, downy mildew symptoms were first detected on October 19, when CDDSV was 32. At 65 days after bud burst, the estimated disease severity was 49% for the leaves in control plots but only 18 to 35% for the various fungicide treatments (Figure 1).
The best leaf mildew control treatment, with the lowest AUDPC, was the conventional system; however, it was not statistically different from treatments with CDDSV 8-12, 13-16 or 17-20. In the control treatment, the leaf disease severity reached the highest value, but this gave an AUDPC score similar to that of treatment with CDDVS 21-24 (Figure 1).In the conventional treatment, seven sprays were used and in the treatments timed by the warning system, 4, 3 and 2 applications were done, respectively, for treatments with CDDVS of 8-12, 13-16 and 17-20 (Figure 1).
Based on the data analysis for this experiment, a CDDSV of 12 -14 was proposed to experiments conducted in the subsequent seasons, which promoted similar control as the conventional treatments.
Considering the fungicides used in the 2000-2001 season (Cymoxanil + maneb 250g/100L), cost of R$ 70.00/ha (Sônego, personal information, 2001), and comparing the number of sprays with the
Table 1. Table of critical leaf wetness periods showing the relationship between mean air daily temperature (ºC) and leaf wetness duration to produce different daily disease severity values (DDSV) of grape downy mildew caused by Plasmopara viticola
DDSV = 0, no symptoms; 1 = leaf severity range from 0.1 to 0.5 %; 2 = 0.6 to 1.0 %; ad 3 = >1.0 %.
Temperature Daily disease severity values
(ºC) 0 1 2 3
Wetting hours
5 – 9 < 5 5 – 13 14 – 17
-10 – 14 < 2 2 – 10 11 – 15 > 15
15 – 19 < 2 2 – 6 7 – 13 > 13
20 – 24 < 4 3 – 9 10 – 14 >14
25 – 30 < 4 4 – 12 13 – 14 > 14
Figure 1. Disease progress curves and areas under the disease progress curve (AUDPC) for grape downy mildew considering leaf severity in the treatments. (CDDSV = cumulative daily disease severity value). Cultivar Isabel, 2000/01 season. Means followed by the same letter do not differ according to Tukey’s (P< 0.05) multiple range test.
traditional method, the warning system may lead to a reduction in costs of up to R$ 490.00/ha, also reducing the amount of chemical released in the environment, and showing the same downy mildew control efficiency.
Experiment 2: Season 2002/03
In this experiment, only four treatments were compared. In this case, the first symptoms were found on October 14, 2002 (29 days after bud burst). Severity of downy mildew in the control plots reached a value of 100% by 65 days after bud burst (Figure 2). At this time, disease severity in the various fungicide treatments was 23.6 to 26.3%. AUDPC value of the control was statistically higher than the AUDPC values of the fungicide treatments, which did not significantly differ (Figure 2). These data indicated that the DDSVS value of 12 – 14 was effective for timing the initial and subsequent fungicide applications, resulting in control similar to that of the conventional system.
As regards the effect of treatments on the disease incidence in the grape bunches, the most severe disease was found in control plots and
the disease severity in the various fungicide treatments detected in each instance was markedly and statically lower than in the controls (Table 2). The other treatments were similar (Table 2). The control efficiency in the conventional treatment (79.3%) was statistically similar to that of the treatment with mancozeb 70.6%. On the other hand, mancozeb alone showed control efficiency (72.6%) lower than the mixture cymoxanil + maneb (93.4%). The conventional method received seven sprayings, while in the other treatments, only six sprayings were used.
Experiment 3: Season 2003/04
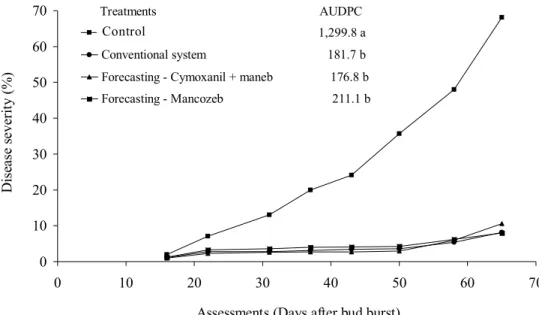
The first leaf downy mildew symptoms were observed on October 10, 2003 (25 days after bud burst). In this season, the treatment timing based on CDDSV of 12 – 14 was assessed in the preceding season. Effectiveness of treatments timed according to the warning system was compared to that of the conventional spraying method and untreated controls. Eight sprayings were used in the conventional method and five were required when the warning system was used.
Treatments AUDPC
0
20
40
60
80
100
0
10
20
30
40
50
60
70
Assessments (Days after bud brust)
D
is
ea
se
s
ev
er
it
y
(
%
)
Check 3,267.4 a
Conventional 511.1 bc
Forecasting- Cymoxanil + maneb 465.9 c Forecasting - Mancozeb 696.7 b
Figure 2. Disease progress curves and areas under the disease progress curves (AUDPC) for grape downy mildew considering leaf severity in the treatments, cultivar Isabel, 2002/03 growing season. Means followed by the same letter do not differ according to Tukey’s (P< 0.05) multiple range test.
Table 2. Comparison of the warning system with the conventional method on the downy mildew incidence and control in grape bunches. Cultivar Isabel, 2002/03 growing season in Experiment 2
Conventional system, application of mancozeb alternated with cymoxanil + maneb at 7 - 8 days interval; application of mancozeb or cymoxanil + maneb according to CDDVS = cumulative daily disease severity values. NA = number of fungicide applications in the treatment.
*Means followed by the same letter in the column do not differ according to Tukey’s (5%) multiple range test.
Treat ments Applications(NA)
Incidence (%)
Control (% )
12 October 19 November 27 January M e ans
Check NA = 0 0 53. 5 73 .7 84 .5 70,6 a 0.0
Conventional system (6 – 8 days) 7 5.2 19 .5 19 .5 14.7 b 79 .2
Mancozeb (CDDSV 12 –14) 6 18 .2 21 .2 22 .5 20.7 b 70 .6
Cymoxanil + maneb (CDDSV 12 –14) 6 3.2 5.5 5.5 4.7 c 93 ,3
C.V. (%) 35 .8 23 .8 16 .5
Severity of downy mildew on the foliage was statistically similar for the treatments: conventional and CDDVS of 12-14, independent of the used fungicide (Figures 3 and 4).
The use of micro-climate model resulted in good control of downy mildew while, in comparison to the conventional method, the required number of sprayings was reduced by 14.3% in the 2002/03 growing season and by 3.5% in 2003/04 season. We co n clu de t h at th e war n in g system co u ld con t rib u te to t h e sustainability of the grape production in Rio Grande do Sul on account of the reduced cost and the protection for the environment by using less amount of chemicals.
Th e experimen tally developed an d validated model was
Treatments AUDPC
0 10 20 30 40 50 60 70
0 10 20 30 40 50 60 70
Assessments (Days after bud burst)
D
is
eas
e
sev
er
it
y
(
%
)
Check 1,299.8 a
Conventional system 181.7 b
Forecasting - Cymoxanil + maneb 176.8 b
Forecasting - Mancozeb 211.1 b
Treatments AUDPC
0 20 40 60 80 100
15 22 29 40
Assessments (Days after bud burst)
D
is
eas
e
in
ci
d
en
ce
(
%
)
Check 655.3 a
Forecasting system 177.6 b
Conventional system 132.0 b
Figure 3. Disease progress curves and areas under the disease progress curves (AUDPC) for grape downy mildew considering leaf severity in the treatments, cultivar Isabel, 2003/04 growing season. Means followed by the same letter do not differ according to Tukey’s (P< 0.05) multiple range test.
Figure 4. Disease progress curves and areas under the disease progress curves (AUDPC) for grape downy mildew considering leaf incidence in the treatments, cultivar Isabel, 2003/04 growing season. Means followed by the same letter do not differ according to Tukey’s (P< 0.05) multiple range test.
investigated in a commercial grape orchard in Farroupilha – RS, based on the CDDSV of 12 – 14 as a criterion to schedule the first and further fungicide applications. The grower’s conventional method required vines to be sprayed 13 times, and according to the new model only eight applications result in similar disease control.
REFERENCE GUIDELINES
01. Abraham, V.; Kushalapa, A.C.; Carisse, O.; Bourgeois, G.; Auclair, P. Comparison of decision methods to initiate fungicide applica-tion against Cercospora blight of carrot. Phytoprotection, Qué-bec, v.76, n.3, p. 91-99, 1995.
Control
02. Campbell, C. L. ; Madden, L. V. Introduction to plant disease epide mio log y. New York , J ohn Wiley, 1 99 0. 532 p.
03. Ellis, M.A.; Madden, L.V.; Wilson, L.L. Evaluation of an electro-nic apple scab predictor for scheduling fungicides with curative activity. Plant Disease, Saint Paul, v.68, n. p.1055-1057, 1984. 04. Freire, L.M.M.; Freire, J .M.; Ca lda rt, V.Z. Tr ans for maç ão na estr utura produt iva dos vitic ultore s da se rra Gaúcha 1
985-1 9 9 985-1. Bento G onça lves: EMBRAPA, CN PUV 1 9 9 2 . 4 4 p.
(EMB.CNPUV-D oc.7 ).
05 . H y re , R. A. Pr og re ss i n forecasting la te blight of pota to and toma to. Plant D is eas e Re po rt er, Beltsville, v.38 , n. p.2 45 -2 5 3 ,1 9 5 4 .
06. Kuhn, G.B.; LovateL, J.L.; Prezotto, O.P; Rivaldo, O.F.; Mande-lli, F.; Sônego, O.R. O cultivo da videira: informações básicas. 2.ed. Bento Gonça lves: Embra pa -CN PUV, 199 6. 60 p. (circular técnica, 1 0).
07. Lalancette, M. A.; Ellis, M. A.; Madden, L.V. Development of an infection efficiency model for Plas mo par a vitic ola on Ameri-can gra pe ba sed on temperatu re a nd dura tion of lea f wetness.
Phytopat hology, Saint Paul, v. 78, n. p.794-800, 1988. 08 . Madden, L.; Pennypa ck eR, S. P.; Mcna b, A. A. Fa st, a
fore-cast system for Alte r na r ia s o la n i on toma to. Phyt o pat ho lo -gy, Sa int Pa ul, v. 6 8, n. p.13 5 4 -1 3 5 8, 1 97 8 .
09 . Ma dden, L.V.; Ellis, M.A.; La la ncette, N .; H u ghes, G.; Wil-son, L.L. Eva lu a tion of a disea se wa rning system for downy mi ldew of gr a pes . P lan t D is e as e, Sa i nt Pa u l, v. 8 4 , n. p .. 5 4 9 -5 5 4 , 2 0 0 0 .
1 0. Mello, L. M. R. de. I - Ca da stro vitícola. In.: MELLO , L.M.
R . de . I ( Ed .) . C ad as t r o v i t í c o l a do R i o G r a n de d o S ul . 1 9 9 5 a 2 0 0 0. Ver sã o 1 .0 . Bento G o nça lves: Embra pa Uva e Vinho; Ibra vin, 2 00 1 . 1 CD -Rom.
11 . Me nd es, C . S. Fl ut ua ç ã o an ual d o in ó c ul o n o ar, de s e n-v o ln-v i m e n t o e n-v a l i d a ç ã o d e u m s is t e m a d e p r e n-v i s ã o d o m í ld i o d a v i d e ir a. 2 0 0 2 . 1 2 3 p .D i s s er t a ç ã o ( M e st r a d o) – Universidade de Passo Fu ndo.
1 2 . M e nde s , C . S.; Re is, E.M.; Sô nego , O. R. Flut uação anual
de esporangiosporos de Plasm opara viticola, no ar, em
Ben-t o Gonç alv es , R S. S um m a Phy top tho log ica, B ot ucat u, v.2 9 , n.4, p.3 62- 36 4, 2 00 3.
13. Muckensturm, N.; Magnien, C.; Jacquin, D. MILVIT: un nouveau modèle de prévision des risques mildiou. Phytoma, Paris, v. 419, p. 3 4-36, 1 99 0.
14. Orlandini, S.; Gozzini, B.; Rosa, M.; Egger, E.; Storchi, P.; Marac-chi, G.; Miglietta, F. PLASMO: A simulation model for control of
Pla smopa ra v itico la on grapevine. BulletinOEPP/EPPO , Ho-bok en, v. 2 3, p.619 -626 , 19 93.
15. Rosa, M.; Genesio, R.; Gozzini, B.; Maracchi, G.; Orlandini, S. PLASMO: a computer program for grapevine downy mildew de-velopment foreca sting. C o mput e rs and E lec t ro nic s in Agr i-cult ure, Amsterda n, v.9 , p.20 5-21 5. 1 99 3.
16. Sutton, J. C. Predictive value of weather variables in the epidemi-ology and management of foliar diseases. Fit opato logia Brasi-leira, Brasília, DF, v.13 , n. p.305-312 , 1988.