Revista Brasileira de
Engenharia Agrícola e Ambiental
Campina Grande, PB, UAEA/UFCG – http://www.agriambi.com.br
v.22, n.1, p.10-15, 2018
Water depths for different soybean cultivars in center pivot
Ricardo Gava
1, Sebastião F. de Lima
1, Osvaldir F. dos Santos
2,
Jefferson L. Anselmo
3, Mayara F. Cotrim
1& Irineu E. Kühn
1 DOI: http://dx.doi.org/10.1590/1807-1929/agriambi.v22n1p10-15A B S T R A C T
Reductions in soybean yields are mainly linked to the occurrence of dry spells, which are becoming more frequent due to climate change. Thus, the aim of this study was to evaluate soybean cultivars irrigated with different water depths under center pivot. The experiment was conducted during the 2014/15 growing season, under center-pivot irrigation in Chapadão do Sul, MS, Brazil. The design was a randomized block in split plot with four replicates, where plots consisted of 4 water depths (0, 50, 75 and 100% of crop evapotranspiration - ETc) and the subplots of 6 soybean cultivars (NA 5909 RR, DM 5958 IPRO, Anta 82 RR, M 7110 IPRO, Desafio RR, M 7739 IPRO). The cultivar Desafio RR was the one that best responded to irrigation, increasing yield to 6174 kg ha-1 against 3798 kg ha-1 under
rainfed condition. The highest yield under rainfed condition was obtained by the cultivar NA 5909 RR, reaching 4806 kg ha-1. This shows that some cultivars can respond positively to
irrigation, resulting in increased yield, depending on the genetic characteristics of each one.
Lâminas de irrigação para diferentes cultivares
de soja em pivô central
R E S U M O
As reduções de produção de soja no Brasil estão ligadas principalmente à ocorrência de veranicos, os quais estão cada vez mais frequentes devido às mudanças climáticas. Sendo assim, objetivou-se com este trabalho avaliar diferentes lâminas de irrigação em cultivares de soja irrigadas em pivô central. O trabalho foi realizado no ano agrícola 2014/15, no município de Chapadão do Sul, MS. O delineamento foi em blocos casualizados em esquema de parcelas subdivididas com quatro repetições, onde as parcelas constaram de 4 lâminas de irrigação (0, 50, 75 e 100% da Evapotranspiração da Cultura - ETc), e as subparcelas de 6 cultivares de soja (NA 5909 RR, DM 5958 IPRO, Anta 82 RR, M 7110 IPRO, Desafio RR, M 7739 IPRO). A cultivar Desafio RR foi a que mais respondeu à irrigação, alcançando produtividade de 6174 kg ha-1 com a reposição de 50% da ETc, contra 3798 kg ha-1 na condição
de sequeiro. A maior produtividade no sequeiro foi com a cultivar Na 5909 RR, chegando a 4806 kg ha-1, indicando que a resposta da cultura à irrigação está relacionada principalmente
às características genéticas de cada cultivar. Key words:
Glycine max (L.) Merrill. drought
water deficit
Palavras-chave:
Glycine max (L.) Merrill. veranico
déficit hídrico
1 Universidade Federal do Mato Grosso do Sul. Chapadão do Sul, MS. E-mail: [email protected] (Corresponding author); [email protected]; [email protected]; [email protected]
2 Universidade Estadual Paulista ‘Júlio de Mesquita Filho’. Botucatu, SP. E-mail: [email protected]
3 Fundação de Apoio à Pesquisa Agropecuária de Chapadão. Chapadão do Sul, MS. E-mail: [email protected]
Introduction
Soybean (Glycine max) has an important role in the global economy, also standing out in the national scene as the crop with highest increase in the last three decades, occupying about 49% of the planted area, and its main cultivation regions are Mid-West and South (MAPA, 2016).
Given the importance of this crop in the national and international contexts, many cultivars are available in the market, and the choice on those that best adapt to a certain region takes into consideration its edaphoclimatic conditions, which are preponderant for a good yield. Guimarães et al. (2008) claimed that the yield of a crop is defined by the interaction between plant genotype, production environment and management.
However, the choice on the best cultivar may not always result in high yields, as reported by Gava et al. (2015), who observed that water deficit is a factor that must be taken into consideration in the management of this crop, because it can cause a drastic reduction in yield when it occurs during crop cycle or even in grain filling.
Soybean, despite being traditionally cultivated under rainfed conditions, i.e., exclusively based on rainfalls, may be subjected to dry spells during its development, resulting from rainfall irregularity (Flumignan et al., 2015).
Hence, water supplementation for the soybean crop presents itself as a possible alternative to increase yields when the rainfall does not meet the water demand necessary for its development. Given the above, this study aimed to evaluate soybean cultivars under different irrigation depths in the Cerrado region of Mato Grosso do Sul.
Material and Methods
The experiment was carried out at the Agricultural Research Support Foundation of Chapadão, in the municipality of Chapadão do Sul-MS, Brazil (18° 46’ 49” S; 52° 38’ 51” W; 810 m). The climate of the region is defined as tropical with dry season (Aw) according to Köppen’s classification, with mean annual temperature of 25 °C and mean annual rainfall between 1,600 and 1,800 mm.
The soil was classified as dystrophic Red Latosol, with clayey texture, and its chemical properties obtained using the methodology of Raij et al. (2001), in the 0-20 cm layer, were: 33.4 mg dm-3 of P (resin); 35.7 g dm-3 of OM; 5.5 of pH (CaCl
2);
K+, Ca2+, Mg+2 and H+Al = 0.32; 3.23; 1.34 and 3.54 cmol c dm
-3,
respectively, and 57.9% of base saturation.
The physical-hydraulic characteristics, necessary for correct irrigation management, were determined through soil water
retention curves, using the Richards’ pressure plate apparatus (Richards, 1949). Water contents equivalent to field capacity for the layers of 0-0.15 and 0.15-0.30 m were 0.413 and 0.383 cm3 cm-3, respectively. Water contents equivalent to the
permanent wilting point in these same layers were 0.282 and 0.262 cm3 cm-3; the values of total water availability in the soil
(TWA) were 1.76 and 1.74 mm cm-1; and soil density values,
determined through the volumetric ring method, were 1.34 and 1.44 g cm-3, respectively.
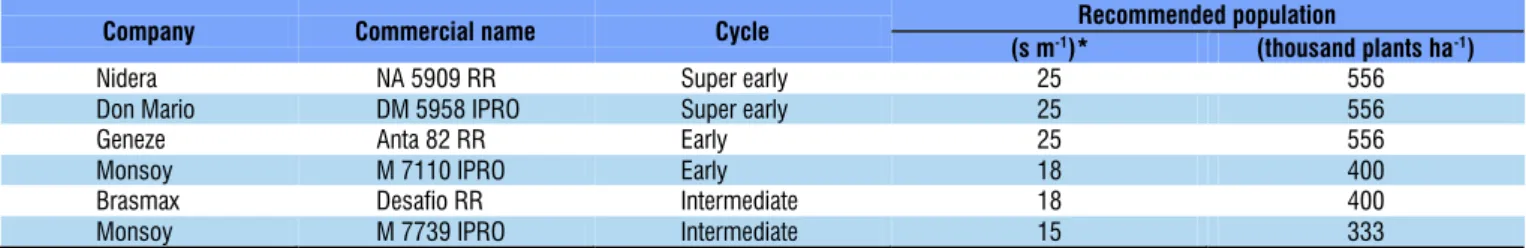
The experiment was conducted in randomized block design in split-plot scheme, in which plots consisted of four irrigation depths (0, 50, 75 and 100% of ETc) and subplots of six soybean cultivars with different cycles (NA 5909 RR, 100 days; DM 5958 IPRO, 100 days; Anta 82 RR, 115 days; M 7110 IPRO, 115 days; Desafio RR, 125 days; M 7739 IPRO, 125 days), with four replicates. Experimental units consisted in five 5-m-long central rows spaced by 0.45 m. Sowing was performed in no-till system, employing fertilization with 150 kg ha-1 of the
11-52-00 NPK formulation in the row and, subsequently, 150 kg ha-1
of KCl as top-dressing. The population of each cultivar was determined according to the population recommended by the respective companies (Table 1) and sown on October 15, 2014. A center-pivot system was used for irrigation and its management was based on climate characteristics, following the FAO Penman-Monteith method, according to Allen et al. (1998). Irrigations were applied only when the crop was close to the lower limit of Actual Water Storage Capacity in the Soil (AWSC). Therefore, irrigation interval was not fixed; instead, it was based on the moment at which the crop had consumed all the easily available water.
The f factor, also called fraction of available water in the soil (FAW), or even Easily Available Water, was calculated following the methodology of Allen et al. (1998), using the FAW tabulated for the soybean crop of 0.45. To guarantee an initial plant stand in all plots, rainfed treatments were irrigated up to the phenological stage V2.
The following biometric characteristics were evaluated: a) plant height - determined as the vertical distance between soil and the tip of the main stem; b) first pod height - measured as the vertical distance between soil and first pod; c) number of pods per plant - determined through manual count of the total number of pods per plant; d) number of grains per plant - determined through manual count of the total number of grains per plant; e) number of grains per pod - determined based on the data of the items c and d, as the quotient between the mean values of grains per plant and pods per plant; f) hundred-grain weight - based on the count and weight of a hundred grains, corrected for moisture content of 13%, determined using an electronic sampler at the moment of
* s m-1 - Seeds per linear meter
Company Commercial name Cycle Recommended population
(s m-1)* (thousand plants ha-1)
Nidera NA 5909 RR Super early 25 556
Don Mario DM 5958 IPRO Super early 25 556
Geneze Anta 82 RR Early 25 556
Monsoy M 7110 IPRO Early 18 400
Brasmax Desafio RR Intermediate 18 400
Monsoy M 7739 IPRO Intermediate 15 333
evaluation; g) yield - obtained through the manual harvest of two 4-m-long central rows, totaling an experimental unit of 3.6 m2, with later correction of weight for moisture content of 13%.
The data were subjected to analysis of variance and means were compared by Tukey test at 0.05 probability level.
Results and Discussion
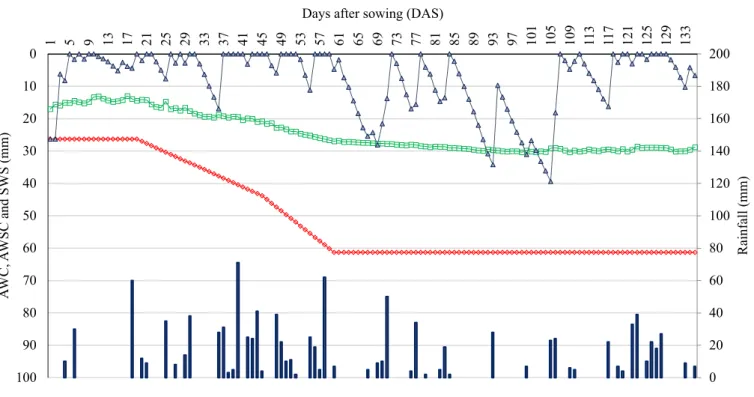
As demonstrated in Figure 1, soil water storage (SWS) was inferior to the actual water storage capacity in the soil (AWSC) in a few moments, due to the high rainfall occurred in the period, which consequently reduced the necessity of irrigation.
As mentioned in the previous item, there were dry periods immediately after sowing (Figure 1); therefore, irrigations were applied in plants under rainfed conditions to guarantee the initial stand for all treatments.
Only 10 irrigations were necessary along the cycle, which concentrated in short periods without rainfall, especially the initial stage, until 18 DAS, intermediate stage from 61 to 72 DAS, and final stage from 85 to 107 DAS (Figure 1).
Due to these minor occurrences, it is possible to observe in Table 2 that the cumulative irrigation depths were considerably small; however, applied in important periods, they resulted in significant differences.
Despite the low occurrence of water deficit, it can influence the cultivars in different ways, due to the different phenological
cycles. According to Gava (2014), the occurrence of water deficit only in the phenological stage of grain filling leads to a reduction of yield similar to that of areas under deficit during the entire cycle.
Thus, sowing under rainfed conditions in this region should be performed only when the soil is under satisfactory moisture conditions, due to the risks of occurrence of water deficit.
Based on the analysis of possibility of water deficit occurrence, late sowing dates are recommended, when the rainy period has already been reestablished. Hence, irrigation contributes not only to the improvement of yield, but also to allowing early sowing dates in the first and second seasons, reducing the total number of irrigations since it makes better use of the rainy period.
However, the soybean crop is very sensitive to photoperiod and care must be taken with very early or very late planting dates. Thinking of that, Fietz & Rangel (2008) analyzed together photoperiod and historic occurrence of water deficit in the region and concluded that, under rainfed conditions, the best sowing date for soybean is in November. This can be a limiting factor for producers who intend to conduct two seasons in the year without irrigation, because it retards the sowing of the second season, and may even make it unviable.
The results of the present study demonstrate that, for all response variables, there was interaction between cultivars and irrigation depths, except for the number of grains per pod and 100-grain weight (Table 3).
Table 4 allows to analyze all the results through comparison of means, performed using the test of means.
The increase in irrigation depth did not influence PH for the cultivars with super early cycle, unlike the others, for which the treatments with supplementary irrigation obtained better results (Table 4). The use of irrigation in these cultivars
Figure 1. Mean values of rainfall, available water capacity (AWC), actual water storage capacity in the soil (AWSC) and soil water storage (SWS) during the experimental period
0 20 40 60 80 100 120 140 160 180 200 0
10
20
30
40
50
60
70
80
90
100
1 5 9 13 17 21 25 29 33 37 41 45 49 53 57 61 65 69 73 77 81 85 89 93 97 101 105 109 113 117 121 125 129 133
Rainfall (mm)
A
WC,
A
WSC and SWS (mm)
Days after sowing (DAS)
Rainfall AWC AWSC SWS Rainfed Irrigation depths (%ETc) Rainfall
50 75 100
mm
42 55 73 90 1081
Table 3. Analysis of variance for plant height (PH), first pod height (FPH), number of pods per plant (POD), number of
grains per plant (GRA), number of grains per pod (GP), hundred-grain weight (HGW) and yield (Y) Source
of variation
Degrees of freedom
Mean square of response variables
PH FPH POD GRA GP HGW Y
Blocks 3 1.69E+1 6.40E-1 2.75E+1 1.31E+2 5.00E-2 1.29E+0 1.01E+5
C 5 6.14E+2** 2.77E+1** 4.09E+3** 1.93E+4** 3.10E-1** 2.40E+1** 9.08E+5**
Res. (A) 15 3.69E+1 3.70E+0 2.59E+1 2.25E+2 5.00E-2 2.21E+0 1.27E+5
L 3 4.04E+2** 4.83E+0ns 1.18E+2ns 6.19E+2ns 5.00E-2ns 2.14E+1** 6.02E+6**
C*L 15 6.52E+1** 3.91E+0* 3.24E+2** 2.10E+3** 3.00E-2ns 2.32E+0ns 6.06E+5**
Res. (B) 54 1.38E+1 2.07E+0 6.86E+1 3.47E+2 3.00E-2 1.93E+0 1.69E+5
Total 95
CV (%) Plot 8.20 15.64 13.60 16.66 8.85 8.50 7.69
CV (%) Subplot 5.01 11.70 22.13 20.67 7.52 7.94 8.90
NSNot significant (p > 0.05); *Significant (p < 0.05); **Significant (p < 0.01); CV - Coefficient of variation; C: - Cultivars; L - Irrigation depths
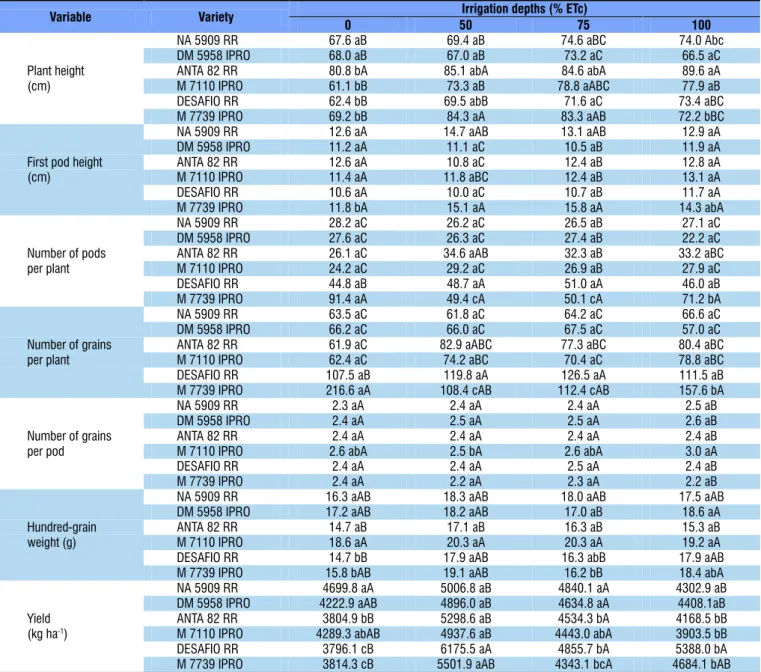
Table 4. Mean values of plant height, first pod height, number of pods per plant, number of grains per plant, number
of grains per pod, hundred-grain weight and yield of the soybean cultivars as a function of the irrigation depths
Variable Variety Irrigation depths (% ETc)
0 50 75 100
Plant height (cm)
NA 5909 RR 67.6 aB 69.4 aB 74.6 aBC 74.0 Abc
DM 5958 IPRO 68.0 aB 67.0 aB 73.2 aC 66.5 aC
ANTA 82 RR 80.8 bA 85.1 abA 84.6 abA 89.6 aA
M 7110 IPRO 61.1 bB 73.3 aB 78.8 aABC 77.9 aB
DESAFIO RR 62.4 bB 69.5 abB 71.6 aC 73.4 aBC
M 7739 IPRO 69.2 bB 84.3 aA 83.3 aAB 72.2 bBC
First pod height (cm)
NA 5909 RR 12.6 aA 14.7 aAB 13.1 aAB 12.9 aA
DM 5958 IPRO 11.2 aA 11.1 aC 10.5 aB 11.9 aA
ANTA 82 RR 12.6 aA 10.8 aC 12.4 aB 12.8 aA
M 7110 IPRO 11.4 aA 11.8 aBC 12.4 aB 13.1 aA
DESAFIO RR 10.6 aA 10.0 aC 10.7 aB 11.7 aA
M 7739 IPRO 11.8 bA 15.1 aA 15.8 aA 14.3 abA
Number of pods per plant
NA 5909 RR 28.2 aC 26.2 aC 26.5 aB 27.1 aC
DM 5958 IPRO 27.6 aC 26.3 aC 27.4 aB 22.2 aC
ANTA 82 RR 26.1 aC 34.6 aAB 32.3 aB 33.2 aBC
M 7110 IPRO 24.2 aC 29.2 aC 26.9 aB 27.9 aC
DESAFIO RR 44.8 aB 48.7 aA 51.0 aA 46.0 aB
M 7739 IPRO 91.4 aA 49.4 cA 50.1 cA 71.2 bA
Number of grains per plant
NA 5909 RR 63.5 aC 61.8 aC 64.2 aC 66.6 aC
DM 5958 IPRO 66.2 aC 66.0 aC 67.5 aC 57.0 aC
ANTA 82 RR 61.9 aC 82.9 aABC 77.3 aBC 80.4 aBC
M 7110 IPRO 62.4 aC 74.2 aBC 70.4 aC 78.8 aBC
DESAFIO RR 107.5 aB 119.8 aA 126.5 aA 111.5 aB
M 7739 IPRO 216.6 aA 108.4 cAB 112.4 cAB 157.6 bA
Number of grains per pod
NA 5909 RR 2.3 aA 2.4 aA 2.4 aA 2.5 aB
DM 5958 IPRO 2.4 aA 2.5 aA 2.5 aA 2.6 aB
ANTA 82 RR 2.4 aA 2.4 aA 2.4 aA 2.4 aB
M 7110 IPRO 2.6 abA 2.5 bA 2.6 abA 3.0 aA
DESAFIO RR 2.4 aA 2.4 aA 2.5 aA 2.4 aB
M 7739 IPRO 2.4 aA 2.2 aA 2.3 aA 2.2 aB
Hundred-grain weight (g)
NA 5909 RR 16.3 aAB 18.3 aAB 18.0 aAB 17.5 aAB
DM 5958 IPRO 17.2 aAB 18.2 aAB 17.0 aB 18.6 aA
ANTA 82 RR 14.7 aB 17.1 aB 16.3 aB 15.3 aB
M 7110 IPRO 18.6 aA 20.3 aA 20.3 aA 19.2 aA
DESAFIO RR 14.7 bB 17.9 aAB 16.3 abB 17.9 aAB
M 7739 IPRO 15.8 bAB 19.1 aAB 16.2 bB 18.4 abA
Yield (kg ha-1)
NA 5909 RR 4699.8 aA 5006.8 aB 4840.1 aA 4302.9 aB
DM 5958 IPRO 4222.9 aAB 4896.0 aB 4634.8 aA 4408.1aB
ANTA 82 RR 3804.9 bB 5298.6 aB 4534.3 bA 4168.5 bB
M 7110 IPRO 4289.3 abAB 4937.6 aB 4443.0 abA 3903.5 bB
DESAFIO RR 3796.1 cB 6175.5 aA 4855.7 bA 5388.0 bA
M 7739 IPRO 3814.3 cB 5501.9 aAB 4343.1 bcA 4684.1 bAB
Means followed by different letters, lowercase in the row and uppercase in the column, differ by Tukey test (p < 0.05)
led to increment in PH from 4.3 to 27.5%, comparing rainfed conditions with irrigation depth equal to 100% ETc. Santos & Carlesso (1998) report that water deficit affects plant behavior in different ways for the same crop, depending on genotype, duration, severity and development stage. The cultivar Anta
82RR showed the highest PH values compared with the others, regardless of irrigation.
without supplementation. The absence of supplementary irrigation had similar effect to irrigation depth of 100% ETc on FPH, which did not vary between cultivars. With irrigation depths of 50 and 75% ETc, the highest values were found in the cultivars M7739IPRO and NA909RR.
Comparing the data of rainfed treatments with those obtained by Souza et al. (2010), who studied the same variables and in the same type of soil, but in a region with lower rainfall regime, it is possible to observe some differences between these characteristics. The values of plant height and number of pods per plant were similar. However, hundred-grain weight and yield were much lower, demonstrating that soybean productive potential is directly related to its water requirements. Peluzio et al. (2012) also report that, even under conditions of irrigation, plant height and hundred-grain weight may show large differences between cultivars, due to the genetic variability.
Regardless of the supplementary irrigation depths, POD was higher in cultivars with intermediate cycle. This occurs because of the higher potential of vegetative growth observed in materials that remained for longer time at the field, such as formation of lateral branches, regardless of plant height. Without supplementary irrigation, the cultivar M7739IPRO showed the highest number of pods per plant (Table 3), resulting from the probable greater plasticity of this genetic material. It is important to consider that, without irrigation, there was a reduction in plant stand, leading to spaces that favored materials with greater plasticity.
Considering that the variation in POD directly influences GRA, the cultivars with intermediate cycle also showed the highest values of this variable. The cultivar M7739IPRO was also the one that showed highest GRA (Table 4).
For GP, which is a characteristic with greater genetic control, there was variation only at the irrigation depth of 100% ETc, and the cultivar M7110IPRO showed the highest value (Table 4). Studying 48 soybean genotypes in irrigated area, Santos et al. (2011) claimed that the number of grains per pod has greater contribution from the genetic variability than the yield itself.
HGW is a characteristic that depends on agroclimatic conditions during pod filling. For the irrigation depths, only the cultivars with intermediate cycle showed difference and, under rainfed conditions, there was lower accumulation of mass in the grains. Regardless of irrigation, the cultivar M7110IPRO showed the highest values of HGW. These results corroborate those of Gava et al. (2017), who evaluated the performance of soybean cultivars in different plant populations and under conditions of irrigation, and claimed that under rainfed conditions the yield and hundred-grain weight were damaged by water deficit. According to these authors, irrigation in the soybean crop allows yield increments superior to 60% compared with rainfed conditions, making the activity feasible.
Yield was not affected by the use of irrigation depths in the super early cultivars, due to the availability of water in the soil, which was higher in the cycles of these plants (Figure
1). For cultivars with early and intermediate cycles, which have longer vegetative cycle, supplementary irrigation depths contributed to the yield, and the irrigation depth of just 50% ETc was already sufficient to cause the highest grain yields in all cultivars. Nevertheless, Gava et al. (2016) report that, for sandy soils, irrigations of up to 150% ETc still result in increase of yield.
Comparing the yield between the cultivars, at the best irrigation depth (50% ETc), the highest values were obtained in the cultivars with intermediate cycle, while without supplementary irrigation this response was observed in super early cultivars and in M7110IPRO, which is early. These results agree with those of Nunes et al. (2016), who found the best yields for water deficit of 50% ETc.
One of the factors that can explain the inferior yield at the highest irrigation depths may be related to the lower aeration of the root system, and thus to its lower development or deepening. Sartori et al. (2016) showed that, comparing the root systems in irrigated area and area under rainfed conditions, root length values were lower in the irrigated area, despite being in a sandy loam soil. However, lateral growth was larger, demonstrating that roots tend to concentrate more in surface when irrigation depths are close to or higher than 100% ETc. Another important factor for soybean yield in irrigated areas that is directly related to the genetic characteristic is the resistance of the cultivar to soil pests, such as nematodes (Inomoto, 2011).
The region where the study was conducted has concentration of rainfalls in the soybean production period. Hence, water deficits occur in low intensity due to dry spells. Despite that, the study demonstrates that irrigation can contribute a lot in these periods.
Conclusions
1. The use of supplementary irrigation favored soybean cultivars with early and intermediate cycle.
2. Soybean cultivars responded differently to the presence or absence of supplementary irrigation.
Literature Cited
Allen, R. G.; Pereira, L. S.; Raes, D.; Smith, M. Crop evapotranspiration: Guidelines for computing crop water requirements. Rome: FAO, 1998. 301p. Irrigation Paper, 56
Fietz, C. R.; Rangel, M. A. S. Época de semeadura da soja para a região de Dourados - MS, com base na deficiência hídrica e no fotoperíodo. Engenharia Agrícola, v.28, p.666-672, 2008. https:// doi.org/10.1590/S0100-69162008000400006
Flumignan, D. L.; Almeida, A. C. dos S.; Garcia, R. A. Necessidade de irrigação complementar da soja na região sul de Mato Grosso do Sul. Dourados: Embrapa Agropecuária Oeste, 2015. 8p. Circular Técnica, 34
Gava, R.; Anselmo, J. L.; Neale, C. M. U.; Frizzone, J. A.; Leal, A. J. F. Different soybean plant populations under central pivot irrigation. Engenharia Agrícola, v.37, p.441-452, 2017. https://doi. org/10.1590/1809-4430-eng.agric.v37n3p441-452/2017
Gava, R.; Frizzone, J. A.; Snyder, R. L.; Almeida, B. M. de; Freitas, P. S. L. de; Rezende, R. Estratégias de manejo de deficit hídrico na cultura da soja. Revista Brasileira de Engenharia de Biossistemas, v.10, p.305-315, 2016. https://doi.org/10.18011/ bioeng2016v10n3p305-315
Gava, R.; Frizzone, J. A.; Snyder, R. L.; Jose, J. V.; Fraga Júnior, E. F.; Perboni, A. Estresse hídrico em diferentes fases da cultura da soja. Revista Brasileira de Agricultura Irrigada, v.9, p.349-359, 2015. https://doi.org/10.7127/rbai.v9n600368
Guimarães, F. de S.; Rezende, P. M. de; Castro, E. M. de; Carvalho, E. de A.; Andrade, M. J. B. de; Carvalho, E. R. Cultivares de soja
[Glycine max (L.) Merrill.] para cultivo de verão na região de
Lavras-MG. Ciência e Agrotecnologia, v.32, p.1099-1106, 2008. https://doi.org/10.1590/S1413-70542008000400010
Inomoto, M. M.; Siqueira, K. M. S.; Machado, A. C. Z. Sucessão de cultura sob pivô central para controle de fitonematoides: Variação populacional, patogenicidade e estimativa de perdas. Tropical Plant Pathology, v.36, p.178-185, 2011.
MAPA - Ministério da Agricultura, Pecuária e Abastecimento. Soja. Disponível em: <http://www.agricultura.gov.br/vegetal/culturas/ soja>. Acesso em: 20 Jan. 2016.
Nunes, A. C.; Bezerra, F. M. L.; Silva, R. A. e; Silva Júnior, J. L. C. da; Gonçalves, F. B.; Santos, G. A. Agronomic aspects of soybean plants subjected to deficit irrigation. Revista Brasileira de Engenharia Agrícola e Ambiental, v.20, p.654-659, 2016. https:// doi.org/10.1590/1807-1929/agriambi.v20n7p654-659
Peluzio, J. M.; Pires, L. P. M.; Cancellier, L. L.; Afférri, F. S.; Colombo, G. A.; Teixeira Júnior, T.; Ribeiro, G. R. dos S. Genetic divergence among soybean cultivars in irrigated lowland in the State of Tocantins. Ciência Rural, v.42, p.395-400, 2012. https://doi. org/10.1590/S0103-84782012000300002
Raij, B. van; Andrade, J. C.; Cantarella, H.; Quaggio, J. A. Análise química para avaliação da fertilidade de solos tropicais. Campinas: Instituto Agronômico, 2001. 285p.
Richards, L. A. Methods of measuring soil moisture tension. Soil Science, v.68, p.95-112. 1949. https://doi.org/10.1097/00010694-194907000-00008
Santos, E. R. dos; Barros, H. B.; Ferraz, E. de C.; Cella, A. J. S.; Capone, A.; Santos, A. F. dos; Fidelis, R. R. Divergência entre genótipos de soja, cultivados em várzea irrigada. Revista Ceres, v.58, p.755-764, 2011. https://doi.org/10.1590/S0034-737X2011000600012 Santos, R. F.; Carlesso, R. Deficit hídrico e os processos morfológico e
fisiológico das plantas. Revista Brasileira de Engenharia Agrícola e Ambiental, v.2, p.287-294, 1998. https://doi.org/10.1590/1807-1929/agriambi.v2n3p287-294