Integrated method for adaptability and phenotypic stability analysis
Edmar Soares de Vasconcelos1*, Múcio Silva Reis2, Cosme Damião Cruz3, Tuneo Sediyama2 and Carlos Alberto Scapim4
1Departamento de Agronomia, Universidade Estadual do Oeste do Paraná, Rua Pernambuco, 1777, Marechal Cândido Rondon, Paraná, Brazil. 2Departamento de Fitotecnia, Universidade Federal de Viçosa, Viçosa, Minas Gerais, Brazil. 3
Departamento de Biologia Geral, Universidade Federal de Viçosa, Viçosa, Minas Gerais, Brazil. 4Departamento de Agronomia, Universidade Estadual de Maringá, Maringá, Paraná, Brazil. *Author for correspondence. E-mail: [email protected]
ABSTRACT. The objectives of this study were a description of the Centroid Method, which is used to investigate the phenotypic adaptability of genotypes and the inclusion of new ideotypes therein, creating the Integrated Method for adaptability and phenotypic stability analysis, as well as a comparison of the two methods in a study example. As an applied example of the new proposal, grain yield data of 14 soybean genotypes from experiments at four locations in the state of Minas Gerais were used. In a comparison, the qualitative and quantitative gains of the Centroid Method with seven ideotypes were higher than of the Centroid Method with only four ideotypes for adaptability analysis. With the incorporation of the new ideotypes into the Centroid Method other concepts for the adaptability and phenotypic stability analysis are represented and the modified method was designated “Integrated Method of Adaptability and Stability Analysis”. CS 801 genotype was classified as the genotype with best adaptability to the environments Viçosa, Florestal, São Gotardo and Rio Paranaiba. The stability of the genotypes CAC 1, CS 741, Splendor, UFV 16, UFV 19, UFVP IV-6, UFVP IV-8, UFVP V-15, UFVP V-7, and UFV98700739 was classified as general.
Keywords: centroid, genotype-environment interaction, ideotypes.
RESUMO. Método integrado para análise de adaptabilidade e estabilidade fenotipica. Os objetivos deste trabalho foram apresentar uma modificação ao método original do Centróide inserindo novos ideótipos, gerando uma proposta denominada Método Integrado para análise adaptabilidade e estabilidade fenotípica e comparar as duas metodologias. Como exemplo de aplicação da nova proposta foi utilizado dados de produtividade de grãos de quatorze genótipos de soja obtidos em experimentos conduzidos em quatro locais, no Estado de Minas Gerais. O novo método do Centróide com sete ideótipos propiciou ganhos qualitativos e quantitativos perante o método original do Centróide que possuía apenas quatro ideótipos para análise de adaptabilidade. Os novos ideótipos inseridos ao método do Centróide original permitem que esse represente outros conceitos para a análise da adaptabilidade e estabilidade fenotípica, sendo designado por Método Integrado de análise de adaptabilidade e estabilidade. CS 801 foi classificado como o genótipo de melhor adaptabilidade aos ambientes Viçosa, Florestal, São Gotardo e Rio Paranaíba. Os genótipos CAC 1, CS 741, Splendor, UFV 16, UFV 19, UFVP IV-6, UFVP IV-8, UFVP V-15, UFVP V-7 e UFV98700739 foram classificados como de estabilidade geral.
Palavras-chave: centróide, interação genótipos por ambientes, ideótipos.
Introduction
The breeding programs of many species are based on at least three steps: choice of parents to generate the base population, selection of superior plants from this population and their evaluation in a certain number of environments. In this last stage the reliability of the genotype classification in different environments is one of the most urgent challenges faced by breeders, and lacking consistency will lead to a phenomenon known as the interaction of genotype and environment (GE) (OLIVEIRA et al., 2003).
result, many alternatives are being and have been proposed, several of which were described by Cruz et al. (2004).
The regression-based methods are widely used in studies evaluating adaptability and phenotypic stability of genotypes in several cultivated plant species, although their limitations have frequently been reported in the literature. Crossa (1990) argues that the linear regression analysis is not informative if linearity fails, since it depends strongly on the group of genotypes and environments included. Moreover, there is a tendency to simplify the response models, explaining the variation due to the interaction in a single dimension, when in reality it can be rather complex. Furthermore, unlike the Centroid Method (ROCHA et al., 2005), these procedures do generally not report on specific interactions of genotypes with environments (if positive or negative), hampering the exploitation of the interaction effects.
The Centroid Method allows the analysis of the genotypes and permits a better exploitation of the GE interaction. The method consists of a comparison of the Cartesian distance values between genotypes and reference points (ideotypes) that were created based on experimental data. These ideotypes represent genotypes with maximum general adaptability, maximum specific adaptability to favorable or unfavorable environments and the genotypes of minimal adaptability (ROCHA et al., 2005). This method has already been used to study the GE interaction in eucalyptus (ROCHA et al., 2005), soybean (BARROS et al., 2008; PELÚZIO et al., 2008) and in alfalfa (VASCONCELOS et al., 2008).
In the original form (ROCHA et al., 2005), the Centroid Method did not include the stability analysis of genotypes. In most breeding programs, the objectives are adaptability with high stability. Nascimento et al. (2009) proposed a modification of the Centroid method that includes different ideotypes. The integration of new ideotypes for stability analysis results in the Integrated Method for adaptability and phenotypic stability analysis.
The objectives of this study were a description of the Centroid Method, which is used to investigate the phenotypic adaptability of genotypes and the inclusion of new ideotypes therein, creating the Integrated Method for adaptability and phenotypic stability analysis, as well as a comparison of the two methods.
Material and methods
To use the Centroid Method of adaptability analysis (four ideotypes), the environments should be classified as favorable and unfavorable based on
the environmental index proposed by Finlay and Wilkinson (1963) apud Cruz et al. (2004). The environmental index is the difference between the mean of each environment and the overall mean of the experiment. If the difference is negative, the environment is classified as unfavorable and favorable if the difference is positive.
The Centroid Method of adaptability analysis is a procedure to calculate the distance between the evaluated genotypes and the determined ideotypes. These ideotypes are based on the data to be analyzed for each environment (ROCHA et al., 2005). The method uses four ideotypes, namely:
1 - Ideotype with maximum general adaptability (ideotype I): maximal responses in all environments, with highest yields measured in each environment.
2 - Ideotype with maximum specific adaptability to favorable environments (ideotype II): maximal response in favorable and minimal response in unfavorable environments, calculated by the highest yield values in favorable and lowest in unfavorable environments.
3 - Ideotype with maximum specific adaptability to unfavorable environments (ideotype III): maximal response to unfavorable environments and minimal in favorable environments, obtained by lowest yields in favorable environments and highest in unfavorable environments.
4 - Ideotype with a minimal adaptability (ideotype IV): minimal response in all environments, with lowest yields measured in each environment.
The distance from the genotypes to each ideotype is calculated based on the theorem of Pythagoras, where the hypotenuse is the square root of the square sum of the adjacent and the opposite catheter.
Assuming an experiment that evaluated the yields of various genotypes (among them genotype i), used to establish ideotype k, in E different locations (A, B, ..., E), the distance between i and k can be computed by:
i k
22 k i 2 k i k
i, A -A B -B ... E E
d
where:
Ai, Bi and Ei represent the yield of genotype i in the E environments, respectively, while Ak, Bk and Ek represent the yield value determined for ideotype k in the E environments, respectively.
7
1 k
ik ik
ik 1/d 1/d
P
where:
Pik: probability that genotype i is similar to ideotype k; g: number of genotypes; dik: distance from genotype i to ideotype k; and id: number of ideotypes established.
The Centroid Method of adaptability analysis also recommends the use of principal component analysis (CRUZ et al., 2004) to verify the genotype distribution in the Cartesian plane. The method of principal components serves as a means of evaluation of the differential response of the genotypes. This methodology is used in the original data set containing the mean of the g genotypes and of the four ideotypes established for each environment (ROCHA et al., 2005).
The ideotypes established in the Centroid Method for adaptability analysis do not fully meet the needs of breeders, and are imperfect in terms of yield stability. It is therefore suggested here to include three other ideotypes in the Centroid Method for adaptability analysis, which would be:
5 - Ideotype with maximum phenotypic stability (ideotype V): moderate response to each environment; yields are the mean values observed in each environment.
6 - Ideotype with maximal specific adaptability to favorable environments and stability in adverse environments (ideotype VI): maximal response in favorable environments and intermediate response in unfavorable environments, with highest yields in favorable environments and moderate yields in unfavorable environments.
7 - Ideotype with maximal specific adaptability to unfavorable environments and stability in favorable environments (ideotype VII): maximal response in adverse environments and moderate in favorable environments; yield is intermediate in favorable environments and maximal in unfavorable environments.
The inclusion of these new ideotypes resulted in the creation of the Integrated Method for adaptability and phenotypic stability analysis.
The use of the principal component analysis to verify the genotype distribution in the Cartesian plane now includes the three new ideotypes, increasing the plotted centroids to seven, together with the g genotypes.
As an application of the Integrated Method for adaptability and phenotypic stability analysis, we used grain yield data of soybean cultivars and lines obtained in the final evaluation experiments (EFIS)
of agronomic performance, of the soybean breeding program of the Department of Plant Science of the Universidade Federal de Viçosa (UFV), conducted in the state of Minas Gerais, in the 2006/2007 growing season. The experiments were conducted at four sites (environments): in Viçosa, Florestal, São Gotardo and Rio Paranaíba.
The complete randomized block design was used in all field experiments, with four replications. The plots consisted of four 5-m rows, spaced 0.5 m apart. The yield was evaluated in an area of 4.0 m2 of the two central rows, discarding 0.5 m at either end of the rows. Based on the plot production, the yield was calculated in kg ha-1.
The following plant material was evaluated: UFV-16, UFV-19, Splendor, CAC-1, UFV98-700739, UFVS-2002290, UFV P IV-6, UFV P IV-8, UFV P IV-15, UFV P V-15, UFV P V-7, CS 741, CS 801, and CS 802. Statistical analyses were performed using software GENES (CRUZ, 2006).
Results and discussion
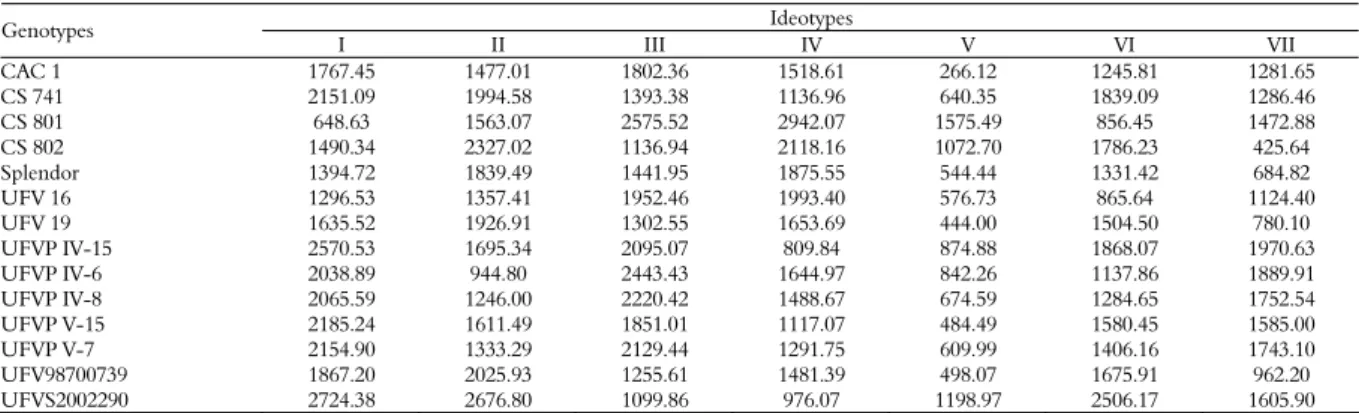
The mean yield was determined for each ideotype and the grain yield of each genotype at all locations (Table 1). The yield values of the ideotypes were assigned with a view to achieve the objectives of representativeness of the different genotype classes, e.g., the ideotype with maximal adaptation (ideotype I) represents a genotype with the highest yield in all environments (ROCHA et al., 2005). The yield values for this ideotype were therefore the highest in all environments (1,950.00, 2,503.13, 4,898.13 and 2,377.50 kg ha-1 in Viçosa, Florestal, São Gotardo and Rio Paranaíba, respectively) (Table 1).
Ideotype V consisted of yield values equivalent to the mean genotype yield of each environment (1,702.01, 1,436.53, 3,575.76 and 2,037.14 kg ha-1 for Viçosa, Florestal, São Gotardo and Rio Paranaíba, respectively) (Table 1). This ideotype represents the group of genotypes which contributed little to the GE interaction, expressing a concept of stability similar to that of Wricke, as proposed by Cruz et al. (2004).
Table 1. Mean grain yield (kg ha-1) of soybean lines and cultivars,
with early/mean cycle, originated in the final trials of the UFV soybean breeding program, conducted at different locations in the state of Minas Gerais, in the 2006/2007 growing season, and mean yield determined for the ideotypes defined by the Integrated Method for adaptability and phenotypic stability analysis.
Genotypes Viçosa Florestal São Gotardo Rio Paranaíba CAC 1 1881.25 1268.75 3676.88 2055.00 CS 741 1384.38 1621.88 3113.13 1790.63 CS 801 1478.13 2262.50 4898.13 2003.13 CS 802 1731.25 2503.13 3465.63 2029.38
Splendor 1771.88 1850.00 3678.75 2368.75 UFV 16 1950.00 1528.13 4079.38 2132.50
UFV 19 1818.75 1746.88 3455.63 2306.88 UFVP IV-15 1459.38 743.75 3206.88 1736.25 UFVP IV-6 1709.38 834.38 4015.63 1645.63 UFVP IV-8 1625.00 809.38 3785.00 2146.88 UFVP V-15 1721.88 995.75 3381.25 1990.00 UFVP V-7 1559.38 846.88 3630.00 2003.75 UFV98 700739 1803.13 1603.13 3268.75 2377.50 UFVS2002290 1934.38 1496.88 2405.63 1933.75 Ideotype I 1950.00 2503.13 4898.13 2377.50 Ideotype II 1384.38 743.75 4898.13 1645.63 Ideotype III 1950.00 2503.13 2405.63 2377.50 Ideotype IV 1384.38 743.75 2405.63 1645.63 Ideotype V 1702.01 1436.53 3575.76 2037.14 Ideotype VI 1702.01 1436.53 4898.13 2037.14 Ideotype VII 1950.00 2503.13 3575.76 2377.50
Ideotype I - Ideotype with maximal general adaptability; Ideotype II - maximal specific adaptability to favorable environments; Ideotype III - maximal specific adaptability to unfavorable environments; Ideotype IV - minimal adaptability; Ideotype V - maximal phenotypic stability; Ideotype VI - maximal specific adaptability to favorable environments and stability in unfavorable environments; and, Ideotype VII - maximal specific adaptability to unfavorable environments and stability in favorable environments.
The method of Wricke is used routinely in stability studies of performance of different genotypes. Studies as those of Prado et al. (2001), Oliveira et al. (2004) and Silva and Duarte (2006) used this methodology, demonstrating the efficiency of this method to determine the stability of the evaluated genotypes.
The inclusion of new ideotypes resulted in the Integrated Method for adaptability and phenotypic stability analysis, which represent concepts of adaptability and stability generated by different analysis methods. For example, ideotype I represents the genotype identified as the most adapted and stable by the method of Lin and Binns, modified by Carneiro
(CRUZ; CARNEIRO, 2006), since it was close to the maximal performance extracted from the yield data.
Ideotype VI represents the genotypes of greatest adaptability and stability by methods of bi-segmented regression (CRUZ et al., 1989; SILVA; BARRETO apud CRUZ et al., 2004; VERMA et al., 1978).
The distances between the determined ideotypes and genotypes are given in Table 2. The distance between the ideotype and the genotype is directly associated to the probability that the said genotype would be classified as belonging to the ideotype class, since the probability calculation depends on the estimated distance between the two.
One of the main features of the Centroid Method for adaptability analysis is to obtain a multivariate distance, involving several environments (ROCHA et al., 2005). For example, genotype CS 801 is at a distance of 2942.07 from ideotype IV (minimal adaptability), and this is the longest in the set of distances. The probability that this genotype belongs to this class of adaptability is 0.06 (lowest probability value in Table 3).
Another method of adaptability and stability analysis that makes use of distances as well is the method of Lin and Binns modified by Carneiro (CRUZ; CARNEIRO, 2006). However, this method considers the distance between the established ideotype (ideotype I) and the other evaluated genotypes.
A probability measure of belonging to each genotype class (ideotype) was computed so that the sum of probabilities for each evaluated genotype equaled 1.00 (100% probability) (Table 3).
This is because the probability values are obtained by the inverse proportion of the genotype-to-ideotype distance, and the inverse of the total distance from the genotype to all ideotypes. The classification of each genotype is therefore determined by its proximity to a given ideotype, as evidenced also by Rocha et al. (2005).
Table 2. Mean distance from the ideotypes to the soybean lines and cultivars with early/medium cycle, originated in the final trials of the UFV soybean breeding program, conducted at different locations in the state of Minas Gerais, in the 2006/2007 growing season.
Ideotypes Genotypes
I II III IV V VI VII
CAC 1 1767.45 1477.01 1802.36 1518.61 266.12 1245.81 1281.65
CS 741 2151.09 1994.58 1393.38 1136.96 640.35 1839.09 1286.46
CS 801 648.63 1563.07 2575.52 2942.07 1575.49 856.45 1472.88
CS 802 1490.34 2327.02 1136.94 2118.16 1072.70 1786.23 425.64
Splendor 1394.72 1839.49 1441.95 1875.55 544.44 1331.42 684.82
UFV 16 1296.53 1357.41 1952.46 1993.40 576.73 865.64 1124.40
UFV 19 1635.52 1926.91 1302.55 1653.69 444.00 1504.50 780.10
UFVP IV-15 2570.53 1695.34 2095.07 809.84 874.88 1868.07 1970.63
UFVP IV-6 2038.89 944.80 2443.43 1644.97 842.26 1137.86 1889.91
UFVP IV-8 2065.59 1246.00 2220.42 1488.67 674.59 1284.65 1752.54 UFVP V-15 2185.24 1611.49 1851.01 1117.07 484.49 1580.45 1585.00
UFVP V-7 2154.90 1333.29 2129.44 1291.75 609.99 1406.16 1743.10
UFV98700739 1867.20 2025.93 1255.61 1481.39 498.07 1675.91 962.20 UFVS2002290 2724.38 2676.80 1099.86 976.07 1198.97 2506.17 1605.90
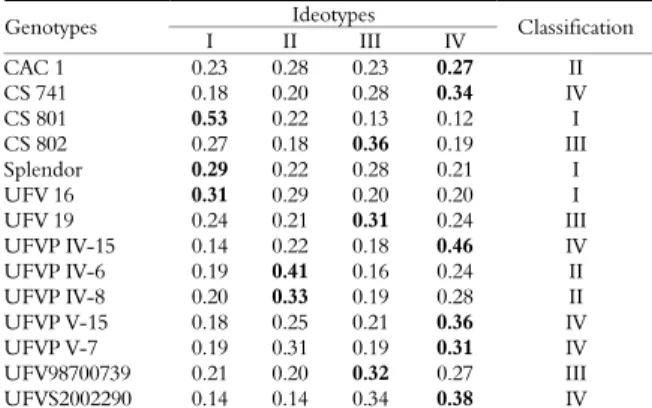
Table 3. The classification of soybean lines and cultivars with early/medium cycle, originated in the final tests of the UFV soybean breeding program, conducted at different locations in the state of Minas Gerais, in the 2006/2007 growing season, and probability of being similar to the ideotypes determined by the Integrated Method for adaptability and phenotypic stability analysis.
Ideotypes Genotypes
I II III IV V VI VII Class CAC 1 0.07 0.09 0.07 0.08 0.48 0.10 0.10 V CS 741 0.09 0.09 0.13 0.16 0.29 0.10 0.14 V CS 801 0.29 0.12 0.07 0.06 0.12 0.22 0.13 I CS 802 0.11 0.07 0.14 0.08 0.15 0.09 0.37 VII Splendor 0.11 0.08 0.11 0.08 0.28 0.11 0.22 V UFV 16 0.12 0.12 0.08 0.08 0.28 0.18 0.14 V UFV 19 0.09 0.08 0.11 0.09 0.34 0.10 0.19 V UFVP IV-15 0.08 0.12 0.10 0.25 0.23 0.11 0.10 IV UFVP IV-6 0.10 0.21 0.08 0.12 0.23 0.17 0.10 V UFVP IV-8 0.09 0.15 0.09 0.13 0.28 0.15 0.11 V UFVP V-15 0.08 0.11 0.09 0.15 0.35 0.11 0.11 V UFVP V-7 0.09 0.14 0.09 0.14 0.30 0.13 0.11 V UFV98700739 0.09 0.08 0.13 0.11 0.33 0.10 0.17 V UFVS2002290 0.08 0.08 0.20 0.23 0.18 0.09 0.14 IV
I - Ideotype with maximal general adaptability; II - Ideotype with maximal specific adaptability to favorable environments; III - Ideotype with maximal specific adaptability to unfavorable environments; IV - Ideotype with minimal adaptability; V - Ideotype with maximal phenotypic stability; VI - Ideotype with maximal specific adaptability to favorable environments and stability in unfavorable environments; and, VII - Ideotype with maximal specific adaptability to unfavorable environments and stability in favorable environments.
There is variation between the genotype classification by the Integrated Method for adaptability and phenotypic stability analysis (Table 3) and the Centroid Method for adaptability analysis (Table 4). As example, CAC 1, CS 741, Splendor, UFV 16, UFV 19, UFVP IV-6, UFVP IV-8, UFVP V-15, UFVP V-7, and UFV98700739 can be cited as genotypes with high phenotypic stability (ideotype V) by the Integrated Method for adaptability and phenotypic stability analysis (with seven ideotypes), whereas these genotypes were classified as belonging to classes I, II, III and IV by the Centroid Method for adaptability analysis (with only four ideotypes).
The stability of the genotypes CAC 1, CS 741, Splendor, UFV 16, UFV 19, UFVP 6, UFVP IV-8, UFVP V-15, UFVP V-7, and UFV98700739 was classified as general (classification generated by the Integrated Method for adaptability and phenotypic stability analysis) (Table 3).
Maximal adaptability to the evaluated environments was observed in genotype CS 801, i.e., the distance was shortest to ideotype I, indicating greatest adaptability to all environments. The adaptability of genotype CS 802 to unfavorable environments was classified as maximal and the performance in favorable environments as stable. UFVP IV-15 and UFVS2002290 were classified as genotypes with minimal adaptability and reduced phenotypic stability, since the probability of belonging to class IV was highest, that is, they were closest to ideotype IV.
The study of Rocha et al. (2005) suggested that a good grouping would be obtained if the probability
were over 50%, for only four ideotypes. As the number of ideotypes increased from four to seven in the Integrated Method for adaptability and phenotypic stability analysis, a probability above 29% would be necessary for a reliable grouping. Since, 29% probability in the case of seven ideotypes correspond to 50% probability for four ideotypes. In this study, five values were above 30% (Table 3).
Several other authors also found excellent groupings using the Centroid Method for adaptability analysis. Vasconcelos et al. (2008) found a clustering probability above 80% for alfalfa. In a study with soybean cultivars in the state of Tocantins, Pelúzio et al. (2008) found a cluster probability of 50%. These results show that the Centroid Method for adaptability analysis allows the classification of the genotypes under study.
When the Centroid method for adaptability analysis was used grouping values above 50% were observed (Table 4). But when the Integrated Method for adaptability and phenotypic stability analysis was used, no classification probability was found above 50% (Table 3). This is plausible, since the number of ideotypes in this analysis was raised, which increases the total distance between each genotype and the ideotypes.
Table 4. Classification and the probability of soybean lines and cultivars with early/medium cycle, from the final testing of the soybean breeding program of the UFV, conducted at different locations in the state of Minas Gerais, in the 2006/2007 growing season, being similar to the ideotypes determined in the Centroid Method for adaptability analysis.
Ideotypes Genotypes
I II III IV Classification CAC 1 0.23 0.28 0.23 0.27 II CS 741 0.18 0.20 0.28 0.34 IV CS 801 0.53 0.22 0.13 0.12 I CS 802 0.27 0.18 0.36 0.19 III Splendor 0.29 0.22 0.28 0.21 I UFV 16 0.31 0.29 0.20 0.20 I UFV 19 0.24 0.21 0.31 0.24 III UFVP IV-15 0.14 0.22 0.18 0.46 IV UFVP IV-6 0.19 0.41 0.16 0.24 II UFVP IV-8 0.20 0.33 0.19 0.28 II UFVP V-15 0.18 0.25 0.21 0.36 IV UFVP V-7 0.19 0.31 0.19 0.31 IV UFV98700739 0.21 0.20 0.32 0.27 III UFVS2002290 0.14 0.14 0.34 0.38 IV
Ideotype I - maximal general adaptability; Ideotype II - maximal specific adaptability to favorable environments; Ideotype III - maximal specific adaptability to unfavorable environments; and, Ideotype IV - minimal adaptability;
clustering probabilities of 0.46 and 0.38 groups, respectively, no change was observed in groups generated by both methods. The grouping of all other genotypes was different, when the Centroid Method was used to analyze the adaptability and the Integrated Method for adaptability and phenotypic stability analysis.
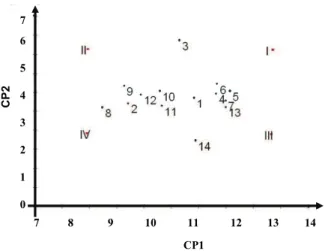
The distances from each genotype to each ideotype are plotted in Figure 1. In spite of the existing distortion in the diagram (because the first two axes of principal component analysis explained 83% of the existing variation in the data), it is possible to verify that the ideotypes were distributed in the shape of an arrow (Figure 1), while in the Centroid Method there were only the ideotypes I, II, III and IV, forming a square (Figure 2).
Figure 1 shows that ideotype IV (low stability and low adaptability) is at the beginning of the arrow from left to right and from bottom to top, in the same direction, and ideotype I (maximal adaptability and stability) is at the end point of the arrow, with the intermediary ideotype V (high phenotypic stability). The ideotypes II (maximal adaptability to environments favorable to unfavorable environments and minimal) and VI (maximal adaptability to environments favorable and unfavorable environments the mean) represent the upper side of the arrow. The ideotypes VII (maximal adaptability to unfavorable environments and mean in favorable environments) and III (maximal adaptability to unfavorable environments and minimal to favorable environments) are on the lower side of the arrow. Nascimento et al. (2009) obtained a different arrangement, this is possible because the arrangement can vary according to the data, since the ideotypes are established in agreement with the group of genotypes assessed and the environments of evaluation.
The analysis of the diagram shows the genotype distribution among the ideotypes. However, the best classification is given by the calculation of probabilities, since there is no interference of distortion, as it happens in the graphical representation.
There are no differences between the locations of genotypes plotted by the Integrated Method for adaptability and phenotypic stability analysis (Figure 1) and plotted with the Centroid method for adaptability analysis (Figure 2). The difference between these two methods is only in the new ideotypes and the resulting differences in classification.
8 9 10 11 12 13 14
7
6
5
4
3
2
1
CP
2
CP1
8 9 10 11 12 13 14
7
6
5
4
3
2
1
CP
2
CP1
Figure 1. Biplot of the Integrated Method for adaptability and phenotypic stability analysis, of the principal components 1 (PC
1) and 2 (PC 2), originating from yield analysis (kg ha-1
) of soybean cultivars and lines with early/mean cycle, from the final tests of the soybean breeding program of the UFV, conducted at different locations in the state of Minas Gerais, in the 2006/2007 growing season.
1- CAC 1; 2- CS 741; 3- CS 801; 4- CS 802; 5- Splendor; 6- UFV 16; 7- UFV 19; 8- UFVP IV-15; 9- UFVP IV-6; 10- UFVP IV-8; 11- UFVP V-15; 12- UFVP V-7; 13- UFV98700739 and 14- UFVS2002290. Ideotype I - Ideotype with maximal general adaptability; Ideotype II - maximal specific adaptability to favorable environments; Ideotype III - maximal specific adaptability to unfavorable environments; Ideotype IV - minimal adaptability; Ideotype V - maximal phenotypic stability; Ideotype VI - maximal specific adaptability to favorable environments and stability in unfavorable environments; and, Ideotype VII - maximal specific adaptability to unfavorable environments and stability in favorable environments.
7 8 9 10 11 12 13 14 7
6
5
4
3
2
1
0 C
CP1
CP
2
7 8 9 10 11 12 13 14 7
6
5
4
3
2
1
0 C
CP1
7 8 9 10 11 12 13 14 7
6
5
4
3
2
1
0 C
CP1
CP
2
Figure 2. Centroid biplot of the principal components 1 (PC 1) and 2 (PC 2), originating from the analysis of grain yield (kg ha-1)
of soybean cultivars and lines with early/mean cycle, from the final tests of the UFV soybean breeding program, conducted at different locations in the state of Minas Gerais, in the 2006/2007 growing season.
1- CAC 1; 2- CS 741; 3- CS 801; 4- CS 802; 5- Splendor; 6- UFV 16; 7- UFV 19; 8- UFVP IV-15; 9- UFVP IV-6; 10- UFVP IV-8; 11- UFVP V-15; 12- UFVP V-7; 13- UFV98700739 and 14- UFVS2002290. Ideotype I – with maximal general adaptability; Ideotype II - maximal specific adaptability to favorable environments; Ideotype III - maximal specific adaptability to unfavorable environments; Ideotype IV - minimal adaptability;
and quantitative order. The quantitative gain is given by the additional ideotypes, without discarding the preexisting, resulting in an enhanced interpretation.
In the qualitative aspect, the new points probably have a greater biological significance than the preexisting. In cases where the environments were random, the existence of genotypes classified into II and III would be little likely. The additional genotypes, by taking the mean into consideration, give a clearer picture of the biology of the genotypes, eg., genotypes with high performance in favorable environments and mean performance in unfavorable environments.
Conclusion
The Centroid Method with seven ideotypes resulted in qualitative and quantitative gains, compared to the Centroid Method with only four ideotypes for adaptability analysis. With the insertion of the new ideotypes, the Centroid Method represents a different concept of analysis of adaptability and phenotypic stability, and is henceforth designated “Integrated Method for adaptability and phenotypic stability analysis”. The Integrated Method for adaptability and phenotypic stability analysis classified the adaptability of genotype CS 801 as best in the environments Viçosa, Florestal, São Gotardo and Rio Paranaíba. The stability of the genotypes CAC 1, CS 741, Splendor, UFV 16, UFV 19, UFVP IV-6, UFVP IV-8, UFVP V-15, UFVP V-7 e UFV98700739 was classified as general. The adaptability to unfavorable environments and stability in favorable environments of genotype CS 802 was classified as maximal. Low adaptability and low phenotypic stability was observed in the lines UFVP IV-15 and UFVS2002290.
References
BARROS, H. B.; SEDIYAMA, T.; TEIXEIRA, R. C.; CRUZ, C. D. Análises paramétricas e não-paramétricas para determinação da adaptabilidade e estabilidade de genótipos de soja. Scientia Agraria, v. 9, n. 3, p. 299-309, 2008.
CROSSA, J. Statistical analyses of multilocation trials. Advances in Agronomy, v. 44, n. 1, p. 55-85, 1990.
CRUZ, C.D. Programa GENES: estatística experimental e matrizes. 1. ed. Viçosa: UFV, 2006. v. 1.
CRUZ, C. D.; CARNEIRO, P. C. S. Modelos biométricos aplicados ao melhoramento genético. 2. ed. Viçosa: UFV, 2006.
CRUZ, C. D.; REGAZZI, A. J.; CARNEIRO, P. C. S. Modelos biométricos aplicados ao melhoramento genético. 3. ed. Viçosa: UFV, 2004. v. 1.
CRUZ, C. D.; TORRES, R. A. A.; VENCOVSKY, R. An alternative approach to the stability analysis proposed by Silva
and Barreto. Revista Brasileira de Genética, v. 12, n. 3, p. 567-580, 1989.
MAIA, M. C. C.; VELLO, N. A.; ROCHA, M. M.; PINHEIRO, J. B.; SILVA, N. F. Adaptabilidade e estabilidade de linhagens experimentais de soja selecionadas para caracteres agronômicos através de método uni-multivariado. Bragantia, v. 65, n. 2, p. 215-226, 2006. NASCIMENTO, M.; CRUZ, C. D.; CAMPANA, A. C. M.; TOMAZ, R. S.; SALGADO, C. C.; FERREIRA, R. P. Alteração no método centroide de avaliação da adaptabilidade genotípica. Pesquisa Agropecuária Brasileira, v. 44, n. 3, p. 263-269, 2009.
OLIVEIRA, A. B.; DUARTE, J. B.; PINHEIRO, J. B. Emprego da análise AMMI na avaliação da estabilidade produtiva em soja. Pesquisa Agropecuária Brasileira, v. 38, n. 3, p. 357-364, 2003.
OLIVEIRA, A. M. S.; HAMAWAKI, O. T.; OLIVEIRA NETO, J. O.; PENNA, J. C. V.; JULIATTI, F. C.; SOUZA, S. A. Estabilidade fenotípica de cultivares de soja no Brasil Central. Bioscience Jornal, v. 20, n. 2, p. 9-19, 2004. PELÚZIO, J. M.; FIDELIS, R. R.; GIONGO, P.; SILVA, J. C.; CAPPELLARI, D.; BARROS, H. B. Adaptabilidade e estabilidade de cultivares de soja em quatro épocas de semeadura no sul do Estado do Tocantins. Revista Ceres, v. 55, n. 1, p. 34-40, 2008.
PRADO, E. E. P.; HIRIMOTO, D. M.; GODINHO, V. P. C.; UTUMI, M. M.; RAMALHO, A. R. Adaptabilidade e estabilidade de cultivares de soja em cinco épocas de plantio no cerrado de Rondônia. Pesquisa Agropecuária Brasileira, v. 36, n. 4, p. 625-635, 2001.
ROCHA, R. B., MURO-ABAD, J. I.; ARAÚJO, E. F.; CRUZ, C. D. Avaliação do método do Centróide para estudo de adaptabilidade ao ambiente de clones de Eucalyptus grandis. Ciência Florestal, v. 15, n. 3, p. 255-266, 2005.
SILVA, W. C. J.; DUARTE, J. B. Métodos estatísticos para estudo de adaptabilidade e estabilidade fenotípica em soja. Pesquisa Agropecuária Brasileira, v. 41, n. 1, p. 23-30, 2006.
VASCONCELOS, E. S; BARIONI JÚNIOR, W.; CRUZ, C. D.; FERREIRA, R. P.; RASSINI, J. B.; VILELA, D. Seleção de genótipos de alfafa pela adaptabilidade e estabilidade da produção de matéria seca. Acta Scientiarum. Agronomy, v. 30, n. 3, p. 339-343, 2008.
VERMA, M. M.; CHAHAL, G. S.; MURTY, B. R. Limitations of conventional regression analysis: a proposed modification. Theoretical and Applied Genetics, v. 53, n. 2, p. 89-91, 1978.
Received on September 16, 2009. Accepted on November 26, 2009.