Effects of polymer-coated slow-release urea on performance, ruminal
fermentation, and blood metabolites in dairy cows
Gustavo Delfino Calomeni1, Rodrigo Gardinal1, Beatriz Conte Venturelli1, José Esler de Freitas Júnior2, Thiago Henrique Annibale Vendramini1, Caio Seiti Takiya1, Heraldo Namorato de
Souza3, Francisco Palma Rennó1,4
1 Universidade de São Paulo, Faculdade de Medicina Veterinária e Zootecnia, Programa de Pós-graduação em Medicina Veterinária, Pirassununga, SP, Brasil.
2 Universidade Federal da Bahia, Escola de Medicina Veterinária e Zootecnia, Salvador, BA, Brasil. 3 Petrobras – CENPES, Rio de Janeiro, RJ, Brasil.
4 Bolsista de Produtividade em Pesquisa do CNPq – Nível 1C.
ABSTRACT - The objective of this experiment was to quantify the effects of feeding polymer-coated slow-release urea on nutrient intake and total tract digestion, milk yield and composition, nutrient balances, ruminal fermentation, microbial protein synthesis, and blood parameters in dairy cows. Sixteen Holstein cows (580±20 kg of live weight (mean ± standard deviation); 90 to 180 days in milk (DIM); and 28 kg/d of average milk yield) were used in a replicated 4 × 4 Latin square experimental design. The animals were assigned to each square according to milk yield and DIM. The animals were randomly allocated to receive one of the following experimental diets: 1) control (without urea addition); urea (addition of 1% on the diet DM basis); polymer-coated slow release urea 1 (addition of 1% on the diet DM basis); and polymer-coated slow release urea 2 (addition of 1% on the diet DM basis). All diets contained corn silage as forage source and a 50:50 forage:concentrate ratio. Milk and protein yield, production of volatile fatty acids, and propionate decreased when cows were fed diets containing urea. Addition of urea decreased nitrogen efficiency and nitrogen excreted in the feces. However, the diets did not change the cows’ microbial protein synthesis, ruminal pH, or ammonia concentration. The inclusion of urea in cow diets decreases milk and protein yield due to lower production of volatile fatty acids. No advantages are observed with supplementation of polymer-coated slow-release urea when compared with feed-grade urea.
Key Words: nitrogen balance, nitrogen efficiency, non-protein nitrogen
ISSN 1806-9290
www.sbz.org.br R. Bras. Zootec., 44(9):327-334, 2015
Received January 16, 2015 and accepted June 25, 2015. Corresponding author: [email protected] http://dx.doi.org/10.1590/S1806-92902015000900004
Copyright © 2015 Sociedade Brasileira de Zootecnia. This is an Open Access article distributed under the terms of the Creative Commons Attribution License (http://creativecommons.org/licenses/by/4.0/), which permits unrestricted use, distribution, and reproduction in any medium, provided the original work is properly cited.
Introduction
Non-protein nitrogen (NPN) is not presented as assembled amino acids forming peptides, but bacteria can use NPN and carbohydrates to produce high-quality protein. Among several compounds characterized as NPN, urea is highlighted by the low cost, availability and ease of use, being widely included in animal nutrition, especially in ruminants (Santos et al., 2001).
Urea is an important source of rumen degradable protein (RDP) and has a high density of protein equivalent (262 to 292%). However, urea is used inefficiently by ruminants when compared with other true protein sources (Broderick and Reynal, 2009), and this fact is related to the rate at which urea is degraded in the rumen. Urea rapidly solubilizes in the ruminal environment and the utilization
of NH3 may be incomplete by rumen bacteria, leading to
accumulation and absorption of ammonia and subsequent excretion of nitrogen in the urine (Highstreet et al., 2010).
During the past 40 years, several technologies have been developed to synchronize the rate of NPN release with the degradation rate of carbohydrates in the rumen to maximize the efficiency of microbial protein synthesis. Compounds with slow release of NPN developed previously, such as biuret (Löest et al., 2001), starea (Bartley and Deyoe, 1975), urea-formaldehyde (Prokop and Klopfenstein, 1977), and urea covered by linseed oil (Forero et al., 1980) did not present the same advantages as urea when used in ruminant nutrition. This fact was probably due to a large portion of NPN by these compounds bypassing the rumen without being converted into ammonia, reducing microbial protein synthesis.
Polymer-coated slow-release urea in ruminant feeding may improve the use of available N, promoting fermentation and microbial protein synthesis, with positive responses on animal performance. Cherdthong et al. (2011) reported increased dry matter intake, digestibility, and 3.5% fat-corrected milk yield when dairy cattle were fed urea-calcium slow-release urea when compared with feed-grade urea. In addition, Xin et al. (2010) found that slow-release urea increased the milk protein content and decreased milk urea N without changing milk yield, when compared with feed-grade urea. However, Galo et al. (2003) did not report any effect of a polymer-coated slow release urea on dry matter intake and digestibility. The comparison between experiments is complex because the result depends on forage source, concentrate level of diet, type of slow-release urea used, and level of inclusion. Several experiments reported decreased ruminal NH3 concentrations when slow-release
urea was fed (Cherdthong et al., 2011; Ribeiro et al., 2011; Taylor-Edwards et al., 2014) compared with feed-grade urea. In the literature, studies frequently compare the effects of only one type of slow-release urea with feed-grade urea and no one has used corn silage as the only forage source, as found in Brazilian dairy cows’ rations, which modifies the rumen energy availability.
The objectives of the present study were to quantify the effects of two types of polymer-coated slow-release urea in diets for lactating cows primarily on ruminal fermentation, microbial protein synthesis, nutrient balance, and blood parameters; and the effects on milk yield and composition. The hypothesis was that polymer-coated slow-release urea in diets for lactating cows would improve nutrient utilization, ruminal fermentation, and microbial protein synthesis, changing their productive performance when compared with feed-grade urea.
Material and Methods
This study was approved by the Bioethics Committee of the School of Veterinary Medicine and Animal Sciences at Universidade de São Paulo, in accordance with the ethical principles of animal experimentation.
Sixteen Holstein cows (580±20 kg of live weight, mean ± standard deviation) in mid-lactation (90 to 120 days in milk, DIM), were randomly assigned to a replicated 4 × 4 Latin square design. Experimental periods consisted of 14 days of adaptation and seven days of data collection. Animals were distributed to each square according to milk yield and DIM. Live weights were measured using a livestock scale (Brete ME 2.80, Coimma®, Dracena -
Brazil) for large animals, after milking and before feeding.
This parameter was recorded at the beginning and at the end of the each experimental period.
The animals were randomly allocated to receive one of the experimental diets: control (CT; without urea); urea (addition of 1% feed-grade urea on the diet DM basis); slow-release urea 1 (SRU1; addition of 1% polymer-coated slow-release urea on the diet DM basis); and slow-release urea 2 (SRU2; addition of 1% polymer-coated slow-release urea on the diet DM basis). Both SRU1 and SRU2 are coated urea with the same slow-release polymers (Coated urea synthetic polymer®, Petrobras - Petróleo Brasileiro S.A.),
which differs each other, only because SRU2 contains sulfur (2.95%) in its composition. Diets were formulated to meet the nutrient requirement of cows according NRC (2001) recommendations (Table 1). Treatments contained approximately 50.15% of corn silgage (forage source) and 49.85% of grain mixture.
Throughout the experiment, cows were housed in individual pens in a free-stall barn, containing sand beds and fans. Diets were fed as a total mixed ration twice daily, at 08.00 h and 13.00 h. Amounts of feed offered and orts of each cow were weighted daily and were restricted to 5 to 10% of intake as-fed basis. Cows were mechanically milked twice daily, at 06.30 h and 15.30 h, and the milk production was recorded electronically during the experimental period. Milk production was measured by an automatic milk meter (ICAR, DeLaval – Tumba, Sweden), which sent information to a herd management software (Alpro, DeLaval – Tumba, Sweden).
Milk subsamples were deproteinized according to Broderick and Clayton (1997) and were stored at –20 °C for analysis of purine derivatives. Two urine samples were collected from all cows, on days 16 and 17 of each experimental period, at approximately 9.00 and 14.00 h. The 10 mL aliquots of urine were diluted immediately with 90 mL 0.036 N sulfuric acid and stored at –20 °C for later analysis. The daily urinary excretion of creatinine was estimated based on the proposition of 24.05 mg/kg live weight. Thus, with the average daily excretion of creatinine and creatinine concentration (mg/dL) in spot urine sample, the total daily urine volume was estimated, in liters per animal per day, for the calculation of nitrogen balance (Chizzotti et al., 2008). The concentrations of allantoin and uric acid in the urine and milk were determined by colorimetry, according to the methodology described by Chen and Gomes (1992). Total excretion of purine derivatives, in mmol/day, was calculated as the sum of the
amounts of allantoin and uric acid excreted in the urine and milk (Orellana Boero et al., 2001).
Six fecal grab samples of each cow were collected during 48 h, every eight hours, on days 17 and 18 of each experimental period, and were combined (wet weight basis) to form a single sample. Total fecal excretion for each animal was determined based on concentration of indigestible ADF (iADF; Casali et al., 2008). For analysis of concentrations of iADF, samples of feed, orts, and feces were placed in bags of nonwoven fabric (NWF 100 g/m2)
with dimensions of 4 × 5 cm (Casali et al., 2008). The aliquots were placed in all the bags, at a ratio of 20 mg/cm2
of surface (Nocek and Russell, 1988). The samples were incubated in the rumen of cannulated dry cows receiving the same diet used in this study for 288 h (12 days), for the determination of iADF.
Blood samples were collected in sterile vacutainer tubes by puncturing the coccygeal vein or artery on day 19 of the experimental period, prior to the morning feeding. After clot formation, the samples were centrifuged at 2,000 x g for 15 min, for biochemical determinations. The obtained supernatant serum was transferred to indentified plastic tubes, and stored at –20 ºC until laboratory analysis. Blood serum was analyzed for glucose, total protein, albumin, urea, urea N, creatinine, and aspartate aminotransferase. Thes analyses were performed using comercial kits (Laborlab® and CELM®) using enzymatic colorimetric
endpoint method or kinetic. The reading was performed in automatic biochemistry analyzer (SBA-200 automatic biochemistry - CELM®, São Caetano do Sul, Brazil).
In the evaluation of ruminal fermentation, the samples of rumen fluid were collected using a esophageal gavage 3 h after the morning feeding. Immediately after collection, to avoid saliva contamination, the first 250 mL suctioned were discarded and rumen pH values were determined using a potentiometer. The samples were temporarily placed on ice and then processed for determination of ammonia nitrogen (NH3-N) and short-chain fatty acids (acetic, propionic, and
butyric acids). The collected ruminal fluid was centrifuged at 2,000 x g during 15 min, and 2 mL of the supernatant were pipetted and stored in trial tubes containing 1 mL of 1 N sulfuric acid for later determination of the NH3-N concentration, and 1 mL in tubes containing 0.4 mL of formic acid for determination of short-chain fatty acids. The NH3-N concentration was determined by the method with
salicylic acid (Verdouw et al., 1978). Ruminal volatile fatty acids were measured with a gas chromatograph (GC-2014, Shimadzu, Tokyo, Japan) equipped with a capillary column (Stabilwax, Restek, Bellefonte, USA). The gases used were helium (8.01 mL/min flow) as carrier gas, hydrogen (pressure
Table 1 - Ingredient and nutrient composition of experimental diets
Ingredient (%DM)
Treatment
CT U SRU1 SRU2
Corn silage 50.15 50.15 50.15 50.21
Ground corn 22.8 27.98 27.98 28.00
Soybean meal 15.69 9.52 9.52 9.52
Whole raw soybean 8.01 8.01 8.01 8.03
Urea - 0.99 -
-Slow-release urea 1 - - 0.99
-Slow-release urea 2 - - - 0.99
Ammonium sulfate 0.10 0.10 0.10
-Sodium bicarbonate 0.80 0.80 0.80 0.8
Magnesium oxide 0.09 0.09 0.09 0.09
Mineral-vitamin mix1 1.98 1.98 1.98 1.98
Limestone 0.14 0.14 0.14 0.14
Salts 0.24 0.24 0.24 0.24
Chemical composition
Dry matter2 63.07 63.15 63.15 63.10
Organic matter 92.05 91.35 91.35 91.44
Crude protein 17.96 18.09 18.09 18.10
Rumen degradable protein (%CP)3 62.35 64.38 64.38 64.44
Rumen undegradable protein (%CP)3 37.65 35.62 35.62 35.56
Rumen degradable protein (%DM)3 11.20 11.64 11.64 11.67
Rumen undegradable protein (%DM)3 6.76 6.44 6.44 6.45
Ether extract 4.08 4.05 4.05 4.06
Non-fiber carbohydrates 37.72 39.88 39.88 39.91
Neutral detergent fiber 32.30 32.13 32.13 32.17
Acid detergent fiber 22.17 21.77 21.77 21.79
Lignin 2.85 2.84 2.84 2.85
Ash 7.94 8.65 8.65 8.55
Total digestible nutrients3 72.57 72.08 72.08 72.15
Net energy for lactation3 (Mcal/kg) 1.77 1.73 1.73 1.73
Gross energy (Mcal/kg of DM) 3.88 3.82 3.82 3.83 CT - control; U - urea; SRU1 - slow-release urea 1; SRU2 - slow-release urea 2.
1 Containing per kilogram: Ca - 190 g; P - 73 g; Mg - 44 g; S - 30 g; Na - 62 g; Zn - 1,350 mg;
Cu - 340 mg; Mn - 940 mg; Fe - 1,064 mg; Co - 3 mg; I - 16 mg; Se - 10 mg; F (max.) - 730 mg.
2 As-fed basis.
of 60 kPa) as fuel gas, and synthetic air (pressure of 40 kPa) as oxidizer gas. The steamer temperature was set at 220 °C, the ionization detector flames at 250 °C, and the separation column at 145 °C for 3 min, which was then raised by 10 °C/min up to 200 °C.
The absorbable purine derivatives (PDabs, mmol/d) were calculated as follows: PDabs = (PD – 0.385 * LW0.75)/0.84,
in which LW = live weight; 0.84 = recovery of PDabs as PD; and 0.385*LW0.75 = endogenous excretion of PD (Chen and
Gomes, 1992). The ruminal synthesis of nitrogen compounds (Nmic, gN/d) was calculated based on the absorbable purine derivatives, using the equation from Chen and Gomes (1992): Nmic = (70*PDabs)/(0.83*0.134*1,000), in which 70 = N purine derivative content (mg N/mol); 0.134 = N purine derivative/microbial N ratio (Valadares et al., 1999); and 0.83 = intestinal digestibility of microbial purines. Crude protein was obtained by multiplying the total nitrogen content by 6.25.
Non-fiber carbohydrates (NFC) were estimated according to Hall (1998): NFC = 100 − [(% CP − % CPurea + % UREA) + %EE + %Ash + %NDF, in which NFC = non fiber carbohydrates; %CP = percentage of crude protein; %CPurea = urea equivalent crude protein; %EE = ether extract; and %NDF = percentage of neutral detergent fiber.
Total digestible nutrients were calculated according to NRC (2001): TDN = dNFC + dCP + (dFA*2.25) + dNDF − 7; in which TDN = total digestible nutrients; dNFC = digestible non fiber carbohydrates; dFA = digestible fatty acids; and dNDF = digestible neutral detergent fiber. dCP, dNFC, dNDF, and dFA represent the total of these digestible nutrients.
Energy values were calculated according to Harvatine and Allen (2006): Digestible energy (DE) intake = gross energy (GE) intake × GE digestibility. The intake of net energy for lactation (NEL) was calculated according to
NRC (2001): Milk NEL (Mcal/d) = milk yield (kg) × [0.0929 × (Fat %) + 0.0563 × (True Protein %) + 0.0395 × (Lactose %)]. NEL body weight gain and NEL available for maintenance were calculated according to NRC (2001): NEL available for maintenance = NEL intake − NEL milk − NEL body weight gain.
The data were subjected to SAS (Statistical Analysis System, version 9.1.3), checking the normality of residuals and homogeneity of variance by PROC UNIVARIATE. Data were analyzed by PROC MIXED, according to the following model:
Yijkl = µ + si + cj + pk + αl+ eijkl,
in which Yijkl = dependent variable; µ = overall mean; si= square effect (i = 1 to 4); Cj= cow effect (j = 1 to 16); pk = effect of period (k = 1 to 4); αl = effect of treatment (l = 1 to 4); and eijkl = residual error. Effects of square, cow, and treatment were considered as fixed effects. Animal and square interaction was considered as random effect.
The period × treatment interaction was evaluated, but was removed from the statistical model when not significant (P>0.05). Data points with Studentized Residuals greater than 3 were considered outliers and excluded from analysis.
To determine differences between treatments, orthogonal contrasts were performed, in which C1 = control vs. diets containing urea; C2 = urea vs. polymer-coated slow-release urea 1 and 2; and C3 = polymer-coated slow-release urea 1 vs. polymer-coated slow-release urea 2. Significance level was set at 5%.
Results
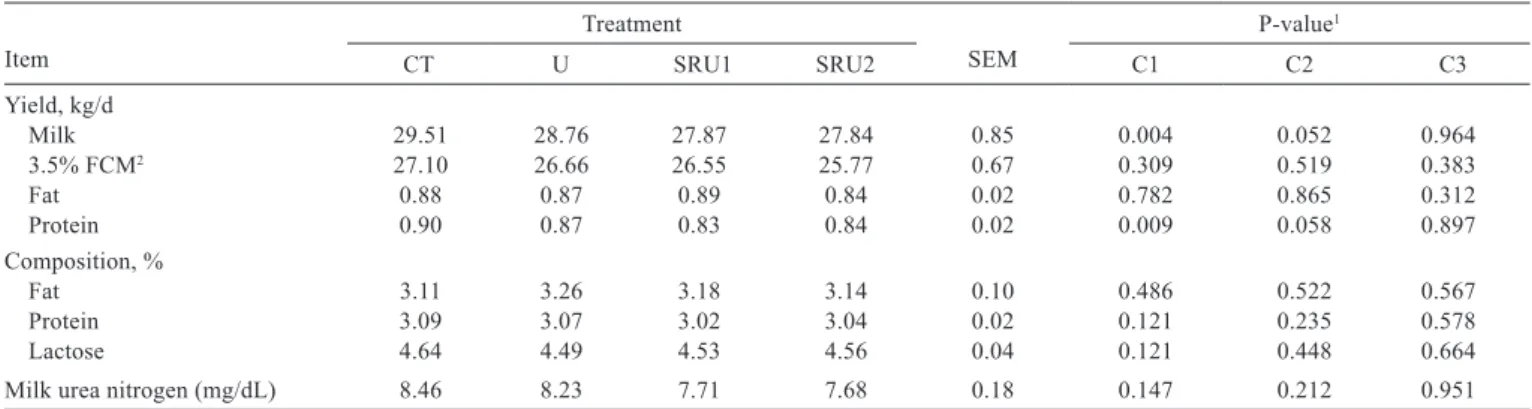
Cows fed the CT diet presented higher milk yield (P<0.01) than cows fed diets containing urea: 29.5 vs. 28.1 kg/d, respectively (Table 2). Milk protein yield (kg/d) was higher for cows fed CT than cows fed diets with urea.
Table 2 - Yield and composition of milk from cows fed different urea sources
Item
Treatment
SEM
P-value1
CT U SRU1 SRU2 C1 C2 C3
Yield, kg/d
Milk 29.51 28.76 27.87 27.84 0.85 0.004 0.052 0.964
3.5% FCM2 27.10 26.66 26.55 25.77 0.67 0.309 0.519 0.383
Fat 0.88 0.87 0.89 0.84 0.02 0.782 0.865 0.312
Protein 0.90 0.87 0.83 0.84 0.02 0.009 0.058 0.897
Composition, %
Fat 3.11 3.26 3.18 3.14 0.10 0.486 0.522 0.567
Protein 3.09 3.07 3.02 3.04 0.02 0.121 0.235 0.578
Lactose 4.64 4.49 4.53 4.56 0.04 0.121 0.448 0.664
Milk urea nitrogen (mg/dL) 8.46 8.23 7.71 7.68 0.18 0.147 0.212 0.951
CT - control; U - urea; SRU1 - slow-release urea 1; SRU2 - slow-release urea 2; SEM - standard error of the mean.
1 Probability for the contrast used to test the effect of: C1 - control vs. urea sources, C2 - urea vs. coated slow-release urea 1 and coated slow-release urea 2; C3 -
polymer-coated slow-release urea 1 vs. polymer-polymer-coated slow-release urea 2.
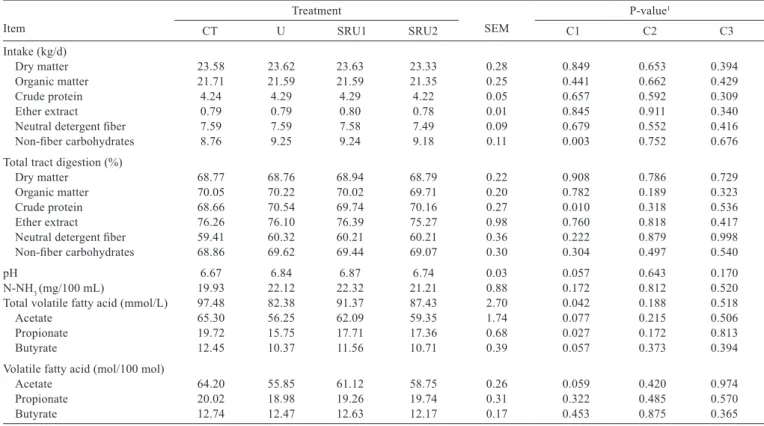
The only difference observed in nutrient intake is related to non-fiber carbohydrate intake, which was higher for cows fed urea sources than cows fed CT (P<0.01). The total tract digestion of CP increased when cows were fed diets containing urea (P = 0.01). Total concentration of volatile fatty acids (mol/100 mol) was decreased when cows were fed diets containing urea. Furthermore, cows fed CT had higher concentration of propionate in the rumen than cows fed urea treatments. Urea decreased propionate production (Table 3).
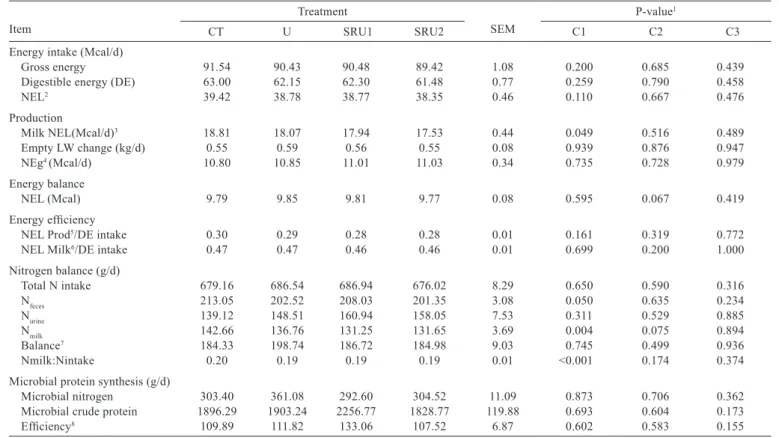
No differences were observed in energy intake among diets; however, cows fed CT needed higher net energy for lactation than cows fed urea sources (Table 4). Nitrogen excreted in the feces and milk was higher for cows fed CT than cows fed the other treatments. Nitrogen use efficiency decreased when cows were fed urea sources. Microbial protein synthesis was not influenced by treatments.
No differences were found in blood parameters when cows were fed different urea sources. However, aspartate aminotransferase increased when cows were fed SRU2 compared with SRU1 (C3, Table 5).
Discussion
Polymer-coated slow-release urea is hydrolyzed to ammonia more slowly than feed-grade urea and could be used more efficiently by rumen microorganisms, improving animal productive performance. However, regardless of the urea source used in the experiment, milk and protein yield decreased with addition of urea to the diets. Brito and Broderick (2007) and Broderick and Reynal (2009) reported a linear reduction in milk production with replacement of true protein by feed-grade urea. Furthermore, it was expected that the use of polymer-coated slow-release urea would not reduce milk production (Highstreet et al., 2010), as described in the present experiment.
The decrease in milk yield may be explained by lower volatile fatty acid production, mainly due to decreased propionate production (which is the mainly gluconeogenic precursor in ruminants) when cows were fed urea. To obtain isoproteic diets, after inclusion of urea sources, adjustments in the levels of soybean meal and ground corn were made, and diets containing urea had higher NFC values than the CT treatment. We expected that higher availability of
Table 3 - Nutrient intakes, total tract digestion, and ruminal fermentation of cows fed different urea sources
Item
Treatment
SEM
P-value1
CT U SRU1 SRU2 C1 C2 C3
Intake (kg/d)
Dry matter 23.58 23.62 23.63 23.33 0.28 0.849 0.653 0.394
Organic matter 21.71 21.59 21.59 21.35 0.25 0.441 0.662 0.429
Crude protein 4.24 4.29 4.29 4.22 0.05 0.657 0.592 0.309
Ether extract 0.79 0.79 0.80 0.78 0.01 0.845 0.911 0.340
Neutral detergent fiber 7.59 7.59 7.58 7.49 0.09 0.679 0.552 0.416
Non-fiber carbohydrates 8.76 9.25 9.24 9.18 0.11 0.003 0.752 0.676
Total tract digestion (%)
Dry matter 68.77 68.76 68.94 68.79 0.22 0.908 0.786 0.729
Organic matter 70.05 70.22 70.02 69.71 0.20 0.782 0.189 0.323
Crude protein 68.66 70.54 69.74 70.16 0.27 0.010 0.318 0.536
Ether extract 76.26 76.10 76.39 75.27 0.98 0.760 0.818 0.417
Neutral detergent fiber 59.41 60.32 60.21 60.21 0.36 0.222 0.879 0.998
Non-fiber carbohydrates 68.86 69.62 69.44 69.07 0.30 0.304 0.497 0.540
pH 6.67 6.84 6.87 6.74 0.03 0.057 0.643 0.170
N-NH3 (mg/100 mL) 19.93 22.12 22.32 21.21 0.88 0.172 0.812 0.520
Total volatile fatty acid (mmol/L) 97.48 82.38 91.37 87.43 2.70 0.042 0.188 0.518
Acetate 65.30 56.25 62.09 59.35 1.74 0.077 0.215 0.506
Propionate 19.72 15.75 17.71 17.36 0.68 0.027 0.172 0.813
Butyrate 12.45 10.37 11.56 10.71 0.39 0.057 0.373 0.394
Volatile fatty acid (mol/100 mol)
Acetate 64.20 55.85 61.12 58.75 0.26 0.059 0.420 0.974
Propionate 20.02 18.98 19.26 19.74 0.31 0.322 0.485 0.570
Butyrate 12.74 12.47 12.63 12.17 0.17 0.453 0.875 0.365
CT - control; U - urea; SRU1 - slow-release urea 1; SRU2 - slow-release urea 2; SEM - standard error of the mean.
1 Probability for the contrast used to test the effect of: C1 - control vs. urea sources, C2 - urea vs. coated slow-release urea 1 and coated slow-release urea 2; C3 -
NFC in diets containing urea would increase propionate production, but the results in this experiment indicated a decrease in propionate production when cows were fed urea sources. This result suggests that the addition of urea reduced ruminal fermentation.
The decrease in milk protein yield and milk yield, coupled with the lower fermentative capacity, can be attributed to insufficient amounts of metabolizable protein
reaching the duodenum when urea replaced true protein (Brito and Broderick, 2007; Broderick and Reynal, 2009). The insufficient metabolizable protein indicates that urea utilization, regardless of source, would decrease ruminal flow of non-ammonia nitrogen, essential amino acids, and total amino acids, resulting in lower microbial protein synthesis. The higher microbial efficiency with diets containing true protein sources can be explained by higher
Table 4 - Energy and nitrogen balances and microbial protein synthesis of cows fed different urea sources
Item
Treatment
SEM
P-value1
CT U SRU1 SRU2 C1 C2 C3
Energy intake (Mcal/d)
Gross energy 91.54 90.43 90.48 89.42 1.08 0.200 0.685 0.439
Digestible energy (DE) 63.00 62.15 62.30 61.48 0.77 0.259 0.790 0.458
NEL2 39.42 38.78 38.77 38.35 0.46 0.110 0.667 0.476
Production
Milk NEL(Mcal/d)3 18.81 18.07 17.94 17.53 0.44 0.049 0.516 0.489
Empty LW change (kg/d) 0.55 0.59 0.56 0.55 0.08 0.939 0.876 0.947
NEg4 (Mcal/d) 10.80 10.85 11.01 11.03 0.34 0.735 0.728 0.979
Energy balance
NEL (Mcal) 9.79 9.85 9.81 9.77 0.08 0.595 0.067 0.419
Energy efficiency
NEL Prod5/DE intake 0.30 0.29 0.28 0.28 0.01 0.161 0.319 0.772
NEL Milk6/DE intake 0.47 0.47 0.46 0.46 0.01 0.699 0.200 1.000
Nitrogen balance (g/d)
Total N intake 679.16 686.54 686.94 676.02 8.29 0.650 0.590 0.316
Nfeces 213.05 202.52 208.03 201.35 3.08 0.050 0.635 0.234
Nurine 139.12 148.51 160.94 158.05 7.53 0.311 0.529 0.885
Nmilk 142.66 136.76 131.25 131.65 3.69 0.004 0.075 0.894
Balance7 184.33 198.74 186.72 184.98 9.03 0.745 0.499 0.936
Nmilk:Nintake 0.20 0.19 0.19 0.19 0.01 <0.001 0.174 0.374
Microbial protein synthesis (g/d)
Microbial nitrogen 303.40 361.08 292.60 304.52 11.09 0.873 0.706 0.362
Microbial crude protein 1896.29 1903.24 2256.77 1828.77 119.88 0.693 0.604 0.173
Efficiency8 109.89 111.82 133.06 107.52 6.87 0.602 0.583 0.155
CT - control; U - urea; SRU1 - slow-release urea 1; SRU2 - slow-release urea 2; SEM - standard error of the mean.
1 Probability for the contrast used to test the effect of: C1 - control vs. urea sources, C2 - urea vs. polymer-coated slow-release urea 1 and polymer-coated slow-release urea 2;
C3 - polymer-coated slow-release urea 1 vs. polymer-coated slow-release urea 2.
2 Caculated according to NRC (2001): NEL (Mcal/kg) = [0.703 × NE (Mcal/kg)] – 0.19.
3 NEL for milk production calculated according to NRC 2001: NEL (Mcal/kg of milk) = 0.360 + [0.0969 × (fat %)]. 4 NEg = live weight change or net energy gain (estimated according to NRC, 2001).
5 NEL Prod = NEL(intake) – NEL(body weight gain) – NEL(milk). 6 NELmilk = MilkNEL + NEg.
7 Nitrogen balance = Total nitrogen intake – (N
feces + Nurine+ Nmilk).
8 Efficiency of microbial protein synthesis (microbial crude protein/TDN intake).
Table 5 - Blood metabolites of cows fed different urea sources
Item (mg/dL)
Treatment
SEM
P-value1
CT U SRU1 SRU2 C1 C2 C3
Glucose 64.31 65.81 64.12 69.56 4.41 0.479 0.752 0.156
Total cholesterol 201.87 205.75 205.38 213.56 11.79 0.495 0.706 0.472
Total protein 5.55 5.57 5.79 5.65 0.13 0.356 0.273 0.382
Albumin 2.46 2.34 2.37 2.37 0.06 0.075 0.606 0.999
Urea 44.44 42.31 45.50 49.75 2.80 0.662 0.129 0.290
Urea nitrogen 22.22 19.86 21.90 21.05 0.66 0.398 0.316 0.648
Creatinine 1.28 1.27 1.26 1.28 0.03 0.789 0.925 0.623
Aspartate aminotransferase (IU/L) 61.18 65.62 56.62 66.62 3.35 0.665 0.358 0.052
CT - control; U - urea; SRU1 - slow-release urea 1; SRU2 - slow-release urea 2; SEM - standard error of the mean.
1 Probability for the contrast used to test the effect of: C1 - control vs. urea sources, C2 - urea vs. polymer-coated slow-release urea 1 and polymer-coated slow-release urea 2;
available nitrogen from peptides or amino acids (Wanapat et al., 2009). However, in the present study, no differences were observed in microbial protein synthesis and efficiency when urea was added to the diet.
Although no differences occurred for nutrient intake, an increase in total tract digestibility of CP was observed for cows fed diets containing urea. This fact is related to the level of dietary rumen digestible protein. When urea sources are added to the diet, true protein (soybean meal) is replaced with a NPN 100% soluble in the rumen (NRC, 2001), thereby generating an increase in CP digestibility, with a decrease in excretion of nitrogen in the feces (Table 4). However, despite higher digestibility of CP, feeding urea provided a lower efficiency of nitrogen utilization, demonstrating that even though urea was being hydrolyzed in the rumen, it was not converted into microbial protein as expected. The excess ammonia in the rumen was absorbed by the epithelium and metabolized to urea by the liver and excreted in the urine, which explains the higher N excreted in the urine for cows fed diets containing urea.
The role of NPN utilization in nutrition of dairy cows would be, after being degraded in the rumen, to supply N-NH3 to ruminal bacteria as a source of nitrogen
for the amino acid synthesis. However, the high release of ammonia can overcome the capacity of utilization by ruminal microorganisms as a nitrogen source, decreasing the productive performance with urea addition. The use of slow-release urea, theoretically, would improve the pattern of ammonia release and utilization, causing a reduction in the levels of ruminal ammonia, an increase microbial protein synthesis, a decrease in the excretion of nitrogen in the urine and, thus, an increase in nitrogen use efficiency, leading to higher milk yield and milk composition improvements. Nevertheless, in all evaluated parameters, there were no differences between cows fed slow-release urea and cows fed conventional urea.
The ruminal ammonia concentration, excretion of nitrogen in the urine, nitrogen use efficiency, microbial protein synthesis, and blood urea nitrogen were similar among cows fed different urea sources, demonstrating, in this situation of management, the lack of advantages of using polymer-coated slow-release urea sources.
Conclusions
Feeding urea, regardless of source, decreases milk and protein yield due to lower production of volatile fatty acids. No advantages are observed with supplementation of polymer-coated slow-release urea when compared with feed-grade urea.
References
AOAC - Association of Official Analytical Chemists. 1990. Official methods of analysis. 15th ed. AOAC, Arlington.
Bartley, E. E. and Deyoe, C. W. 1975. Starea as a protein replacer for ruminants - review of 10 years of research. Feedstuffs 47:42-44. Brito, A. F. and Broderick, G. A. 2007. Effects of feeding different
protein supplements on production and nutrient utilization in dairy cows. Journal of Dairy Science 90:1816-1827.
Broderick, G. A. and Clayton, M. K. 1997. A statistical evaluation of animal and nutritional factors influencing concentrations of milk urea nitrogen. Journal of Dairy Science 80:2964-2971.
Broderick, G. A. and Reynal, S. M. 2009. Effect of source of rumen-degraded protein on production and ruminal metabolism in lactating dairy cows. Journal of Dairy Science 92:2822-2834. Casali, A. O.; Detmann, E.; Valadares Filho, S. C.; Pereira, J. C.;
Henriques, L. T.; Freitas, S. G. and Paulino, M. F. 2008. Influência do tempo de incubação e do tamanho de partículas sobre os teores de compostos indigestíveis em alimentos e fezes bovinas obtidos por procedimentos in situ. Revista Brasileira de Zootecnia 37:335-342. Chen, X. B. and Gomes, M. J. 1992. Estimation of microbial protein
supply to sheep and cattle based on urinary excretion of purine derivatives - an overview of technical details. (Occasional publication). In: International Feed Research Unit. Rowett Research Institute, Bucksburnd, Aberdeen. 21p.
Cherdthong, A.; Wanapat, M. and Wachirapakorn, C. 2011. Effects of urea–calcium mixture in concentrate containing high cassava chip on feed intake, rumen fermentation and performance of lactating dairy cows fed on rice straw. Livestock Science 136:76-84. Chizzotti, M. L.; Valadares Filho, S. C.; Valadares, R. F. D.; Chizzotti,
F. H. M. and Tedeschi, L. O. 2008. Determination of creatinine excretion and evaluation of spot urine sampling in Holstein cattle. Livestock Science 113:218-225.
Forero, O.; Owens, F. N. and Lusby, K. S. 1980. Evaluation of slow-release urea for winter supplementation of lactating range cows. Journal of Animal Science 50:532-538.
Galo, E.; Emanuele, S.; Sniffen, C.; White, J. and Knapp, J. 2003. Effects of a polymercoated urea product on nitrogen metabolism in lactating Holstein dairy cattle. Journal of Dairy Science 86:2154-2162. Hall, M. B. 1998. Making nutritional sense of nonstructural
carbohydrate. p.108-112. In: Proceedings of the Annual Florida Ruminant Nutrition Symposium. Florida University Press, Gainesville.
Harvatine, K. J. and Allen, M. S. 2006. Effects of fatty acid supplements on milk yield and energy balance of lactating dairy cows. Journal of Dairy Science 89:1081-1091.
Highstreet, A.; Robinson, P. H.; Robison, J. and Garrett, J. G. 2010. Response of Holstein cows to replacing urea with a slowly rumen released urea in a diet high in soluble protein. Livestock Science 129:179-185.
Löest, C. A.; Titgemeyer, E. C.; Drouillard, J. S.; Lambert, B. D. and Trater, A. M. 2001. Urea and biuret as nonprotein nitrogen sources in cooked molasses blocks for steers fed prairie hay. Animal Feed Science and Technology 94:115-126.
NRC - National Research Council. 2001. Nutrient requirements of dairy cattle. 7th ed. National. Academy Science, Washington, DC. Nocek, J. E. and Russell, J. B. 1988. Protein and energy as an integrated
system. Relationship of ruminal protein and carbohydrate availability to microbial synthesis and milk production. Journal of Dairy Science 71:2070-2107.
Prokop, M. J. and Klopfenstein, T. J. 1977. Slow ammonia release urea. Nebraska Beef Cattle Report No. EC 77-218 Nebraska. Ribeiro, S. S.; Vasconcelos, J. T.; Morais, M. G.; Ítavo, C. B. C. F.
and Franco, G. L. Effects of ruminal infusion of slow-release polymer-coated urea or concentional urea on apparent nutriente digestibility, in situ degradability, and rumen parameters in cattle fed low-quality hay. 2011. Animal Feed Science and Technology 164:53-61.
Santos, G. T.; Cavalieri, F. L. B. and Modesto, E. C. 2001. Recentes avanços em nitrogênio não proteico na nutrição de vacas leiteiras. p.199-228. In: Anais do 2o Simpósio Internacional em
Bovinocultura de Leite: Novos Conceitos em Nutrição. UFLA, Lavras.
Sklan, D.; Ashkenazi, R.; Braun, A.; Devorin, A. and Tabori, K. 1992. Fatty acids, calcium soaps of fatty acids, and cottonseeds fed to high yielding cows. Journal of Dairy Science 75:2463-2472. Taylor-Edwards, C. C.; Elam, N. A.; Kitts, S. E.; McLeod, K. R.; Axe,
D. E.; Vanzant, E. S.; Kristensen, N. B. and Harmon, D. L. 2014. Influence of slow-release urea on nitrogen balance and portal drained visceral nutrient flux in beef steers. Journal of Animal Science 87:209-221.
Valadares, R. F. D.; Broderick, G. A.; Valadares Filho, S. C. and Clayton, M. K. 1999. Effect of replacing alfalfa with high moisture corn on ruminal protein synthesis estimated from excretion of total purine derivatives. Journal of Dairy Science 82:2686-2696.
Van Soest, P. J. and Mason, V. C. 1991. The influence of Maillard reaction upon the nutritive value of fibrous feeds. Animal Feed Science and Technology 32:45-53.
Verdouw, H.; Van Echteld, C. J. A. and Dekkers, E. M. J. 1978. Ammonia determination based on indophenol formation with sodium salicylate. Water Research 12:399-402.
Wanapat, M.; Polyorach, S.; Boonnop, K.; Mapato, C. and Cherdthong, A. 2009. Effects of treating rice straw with urea or urea and calcium hydroxide upon intake, digestibility, rumen fermentation and milk yield of dairy cows. Livestock Production Science 125:238-243.