Intake, performance and estimated methane production of Nellore steers fed
soybean grain
Juliana Duarte Messana1, Roberta Carrilho Canesin1, Giovani Fiorentini1, Ricardo Andrade Reis1,2, Pedro Braga Arcuri3, Telma Teresinha Berchielli1,2
1Departamento de Zootecnia, Universidade Estadual Paulista, Jaboticabal, SP, Brasil.
2Instituto Nacional de Ciência e Tecnologia de Ciência Animal, Universidade Federal de Viçosa, Viçosa, MG, Brasil. 3Empresa Brasileira de Pesquisa Agropecuária, Centro Nacional de Pesquisa de Gado de Leite, Juiz de Fora, MG, Brasil.
ABSTRACT - The objective of this study was to evaluate nutrient intake, performance, estimated methane production and carcass characteristics of steers fed diets containing three different levels of soybean grain: 0, 120 and 230 g/kg on the dry matter (DM). The study was conducted on eighteen castrated Nellore males with an average initial body weight (BW) of 370±12 kg in a completely randomized design, with three treatments and six repetitions. Intake of dry matter (DMI, kg/day) and crude protein tended to decrease linearly, and the intake of ether extract increased linearly in response to the soybean grain levels in the diet. Levels of soybean grain in the diet did not affect DMI (g/kg of BW), final average weight, average daily weight gain, feed efficiency and estimated methane production. Animals fed diets with different levels of soybean grain were not different with respect to carcass yield, loin eye area, subcutaneous fat thickness, or bone, muscle and fat ratios. Carcass characteristics and meat quality were also not significantly different. Replacement of soybean meal by soybean grain in the diet alters the intake of crude protein and ether extract but does not affect performance, estimates of methane production, or carcass characteristics of feedlot Nellore.
Key Words: carcass yield, fat thickness, greenhouse gases, lipids, loin eye area, weight gain
ISSN 1806-9290
www.sbz.org.br R. Bras. Zootec., 43(12):662-669, 2014
Received June 26, 2014 and accepted September 29, 2014. Corresponding author: duarte_juliana@hotmail.com http://dx.doi.org/10.1590/S1516-35982014001200006
Copyright © 2014 Sociedade Brasileira de Zootecnia. This is an Open Access article distributed under the terms of the Creative Commons Attribution Non-Commercial License, which permits unrestricted non-commercial use, distribution, and reproduction in any medium, provided the original work is properly cited.
Introduction
The industry of beef and dairy has been identified as an activity that contributes to the increased emission greenhouse gases, methane being the second most problematic gas, contributing with around 15% of global warming (Leng, 1993; Moss et al., 2000). The methane produced in the rumen is directly related to the efficiency of rumen fermentation and the consequent loss of energy in the production systems, so it may be responsible for a loss of gross energy of the food of about 2-12%, depending on the diet (Hook et al., 2010).
However, the processes associated with ruminant nutrition represent one the few sources of greenhouse gas production that can be manipulated. This source is an attractive target for manipulation, because reduction of
CH4 is generally associated with increased productivity.
An alternative that can have direct beneficial effects is the inclusion of soybean grain (high lipid) in the diet of ruminants in the fattening stage, resulting in the rumen
manipulation. However, the response in performance and composition of lipids is complex and varies among diets (Martin et al., 2010; Grainger and Beauchemin, 2011).
The use of soybean grain, rich in unsaturated lipid
supplements, can help to reduce enteric CH4 emissions via
ruminal defaunation, toxic effects on gram-positive bacteria in the rumen, especially the cellulolytic and methanogen population, or decreasing the digestibility of the dietary fibre
by microbes(Harvatine and Allen, 2006).
The intensity with which the diet can affect animal performance and reduce emissions of enteric methane is determined by the saturation degree of the added lipid, the amount of supplement, and the composition of the basal diet (Martin et al., 2010). According to Grainger and Beauchemin (2011), the addition of 10.0 g of fat per kg DM in the diet reduces the emission of methane by 1.0 g per kg of DM intake by cows.
Material and Methods
The protocol used in this experiment was in accordance with the Brazilian College of Animal Experimentation (COBEA - Colégio Brasileiro de Experimentação Animal) guidelines and was approved by the Ethics, Bioethics, and Animal Welfare Committee (CEBEA - Comissão de Ética e Bem Estar Animal) of FCAV–UNESP Jaboticabal campus.
Eighteen castrated Nellore males with an average age of 21 months old and an average initial body weight of 370±12 kg were used in the study. The animals were housed in stalls with cement floor, a partially covered ceiling, water trough and a single feeder for forage and concentrate. The steers required a period of 36 days to adapt to the facilities, management and diet. After the adaptation period, the steers were separated into three groups according to diet, randomly distributed in individual stalls, and confined for 78 days (three periods of 26 days). In this period intake, weight gain and estimated methane emission were evaluated. Total weight gain and average daily gain were determined at the beginning and end of the confinement period after a solid-feed deprivation for 12 hours.
The following treatments were evaluated: diet without soybean with 20 g/kg of ether extract in the DM; diet containing 120 g/kg DM of soybean ground raw with 40 g/kg of ether extract in the DM; and diet containing 230 g/kg DM of soybean ground raw with 60 g/kg of ether extract in the DM. The experimental diets (Table 1) contained 500 g/kg of forage (corn silage) and 500 g/kg of concentrate composed of citrus pulp, soybean grain, and/or
soybean meal, and mineral supplement; water was supplied
ad libitum.
The experimental diets were formulated to achieve a weight gain of 1.2 kg/day, according to the Cornell Net Carbohydrate and Protein System (CNCPS) version 5.0 (Fox et al., 2003), and readjusted every 26 days according to the body weight to maintain the desired nutritional level and performance.
Animals were fed corn silage and the experimental concentrates once a day at 08.00 h. During the entire experimental period, the provided quantities were adjusted to allow for approximately 100 g/kg surplus in relation to the total consumed the previous day.
Feed refusals were removed and weighed every two days, and then grouped in periods of 26 d and placed in a freezer at −20 °C. After the experimental period, the samples were thawed and grouped per animal and per period. Subsequently, they were freeze-dried, ground (1 mm) and analysed. To estimate the nutrient intake of the animals, the samples were analysed for the following components: dry matter (DM), organic matter (OM), ether extract (EE) and crude protein (CP) in accordance with Association Official Analytical Chemists (1990); and neutral (NDF) and acid (ADFom) detergent fibre analysis was based on the procedures described by Mertens (2002), except that the samples were weighed into polyester filter bags (porosity of 25 µ) and treated with neutral detergent in an autoclave at 110 ºC for 40 min (Senger et al., 2008). The NDF analyses were performed by adding α-amylase without the addition of sodium sulphite (aNDFom). Acid detergent lignin (Lignin (sa)) was determined by solubilization of cellulose with sulphuric acid according to Van Soest and Robertson (1985). The gross energy (GE) was obtained through sample combustion in an adiabatic calorimetric bomb (PARR Instruments).
Measuring methane production in animals requires complex and often expensive equipment; therefore, prediction equations are widely used to estimate methane emission. Some methane production was estimated by the equation of Ellis et al. (2007) derived from beef database models developed specifically to predict emissions (Equation 14b; Ellis et al., 2007). Methane production (MJ/d) is predicted from the metabolizable energy intake (MEI), acid detergent fibre, and lignin:
CH4 (MJ/d) = 2.94 (± 1.16) + 0.059 (± 0.0201) × metabolizable
energy intake (MJ/d) + 1.44 (± 0.331) × acid detergent fibre (kg/d) − 4.16 (± 1.93) × lignin (kg/d)
This formula was selected because the level of CH4
emissions caused by fermentation in the rumen depends mainly on the composition and quantity of the diet
Table 1 - Percentage of ingredients and chemical composition of the experimental diets
Level of soybean grain (g/kg)
0 120 230
Ingredient, g/kg DM
Corn silage 500.00 500.00 500.00 Citrus pulp 280.00 260.00 240.00 Soybean grain 0.00 120.00 230.00 Soybean meal 190.00 90.00 0.00 Mineral supplement1 30.00 30.00 30.00
Chemical composition
Dry matter, g/kg 637.40 637.60 637.80 Organic matter, g/kg DM 916.00 918.10 920.00 Crude protein, g/kg DM 149.10 146.80 143.40 Ether extract, g/kg DM 19.30 42.30 63.20 Neutral detergent fibre, g/kg DM 335.60 332.60 329.60 Acid detergent fibre, g/kg DM 221.10 218.60 216.00 Lignin, g/kg DM 27.20 26.70 26.30 Total digestible nutrients2, g/kg DM 700.90 715.60 701.20 DM - dry matter.
1 Composition of mineral supplement: Ca - 155 g; P - 80 g; Mg - 10 g; S - 40 g;
Na - 130 g; Cu - 1,350 mg; Mn - 1,040 mg; Zn - 5,000 mg; I - 100 mg; Co - 80 mg; Se - 26 mg; F (max.) - 800 mg; solubility of P in 2% citric acid (min.) - 90%.
(IPCC, 1996), which were known in the present study. Furthermore, it has a low root mean square prediction error (RMSPE) compared with other equations published in that
study. The CH4 energy was converted to mass value using
the conversion factor of 0.02 kg/MJ (Brouwer, 1965). In the experimental studies used in our database, the energy digestibility of the diet was mainly measured according to Messana et al. (2013).
After 78 d in confinement, the animals were transported to a slaughter house. The next day, after fasting (solids) for 24 h, slaughter took place using a compressed air pistol to cause a cerebral concussion, and the animals were then bled by cutting the jugular veins and carotid arteries. After slaughter, carcasses were identified and weighed to obtain the weight and hot carcass yield. Carcass yield was calculated with the hot carcass weight and body weight ratio after fasting. After cooling for 24 h in a refrigerator at 4 °C, carcasses were weighed again to obtain the cold carcass weight. Forequarter, hindquarter and strip bone were separated and weighed to calculate the percentage in a half carcass. In the right half of the carcass, carcass length, leg length, silverside thickness, shin length and carcass width were determined according to the method described by Muller (1987).
A perpendicular cut was made in the left half of the
carcass on the longissimus muscle between the 12th and 13th
ribs. A sample of beef loin was removed, and the loin eye area and carcass fat thickness were evaluated with a proper
reticulated grid measured in square centimeters (cm2) and a
caliper ruler, respectively. A transverse section was removed from the carcass to evaluate body composition, including the 10th, 11th and 12th thoracic ribs, which were used to evaluate the physical separation of muscles, bones and fat, according to the method of Hankins and Howe (1946).
After dissection, the following equations (Hankins and Howe, 1946) were used to predict the proportion of muscle, adipose tissue and bone in the carcass:
Muscle proportion: Y = 16.08 + 0.80 X; Adipose tissue proportion: Y = 3.54 + 0.80 X; and
Bone proportion: Y = 5.52 + 0.57 X,
in which X = component percentage in the HH section obtained in the cold room.
Samples of beef loin taken from the 12th rib, approximately 2.5 cm thick, were vacuum-packed and cooled for analysis of qualitative characteristics. Meat and fat colour, pH, water-retention capacity, tenderness (shear force) and liquid loss upon cooking were analysed in the laboratory.
The pH was measured in the muscular portion of meat with a digital meter. Meat and fat colour were determined
with a portable colorimeter, which considers lightness (L*) and a* and b*, which are chromaticity coordinates. The axis from –a* to +a* varies from green to red, while the axis from –b* to +b* varies from blue to yellow; higher values indicate better colour saturation. Thirty minutes before measuring colour at different locations in the meat, a transversal cut was made in the muscle to expose myoglobin
to oxygen (Abularach et al., 1998). Water-retention capacity
was obtained from the weight of a meat before and after 10 kg of pressure was applied for 5 min.
To calculate the loss of water by cooking, the pieces of beef were baked in an industrial electric oven at 175 °C
until reaching 70 °C in their geometric centre (Abularach et al.,
1998). The weights of the meat samples before and after cooking were used for the calculations of total losses. After cooling the baked samples, four cylinders were removed from the meat with a leaker to determine the force needed to transversally cut each cylinder using a Texture Analyser instrument (TA-XT2i) attached to a Warner Bratzler blade. The average force of the four cylinders was calculated to represent the texture or shear force of each piece of beef
(Abularach et al., 1998).
The experimental design was completely randomised using the 18 animals, three treatments and six replications. The initial body weight was used as a covariate for the statistical analyses. The mathematical model was represented by:
Yij = µ + ti + iwj + eij,
in which Yij = observation of animal j subjected to treatment
i; µ = overall mean, ti = effect of treatment i (i = 1, . . .,3); iwj =
initial weight of animal j; and eij = residual experimental
error. The statistical analysis was conducted using the GLM procedure of SAS (Statistical Analysis System, version 9.1). The treatment means were compared using the Tukey test at a significance level of α = 0.05.
Results
The dry matter intake (DMI, kg/day) and crude protein decreased linearly and the intake of ether extract increased linearly (P<0.001) in response to the increasing participation of soybean grain in the diet. However, dry matter and other nutrients intakes expressed as g/kg BW were not influenced (P>0.05) by the level of soybean grain in the diet (Table 2). Alternatively, the intake of dry matter (kg/day) was lower in cattle fed diets containing 120 and 230 g/kg soybean grain. However, the differences between diets disappeared when these variables were expressed in g/kg of BW.
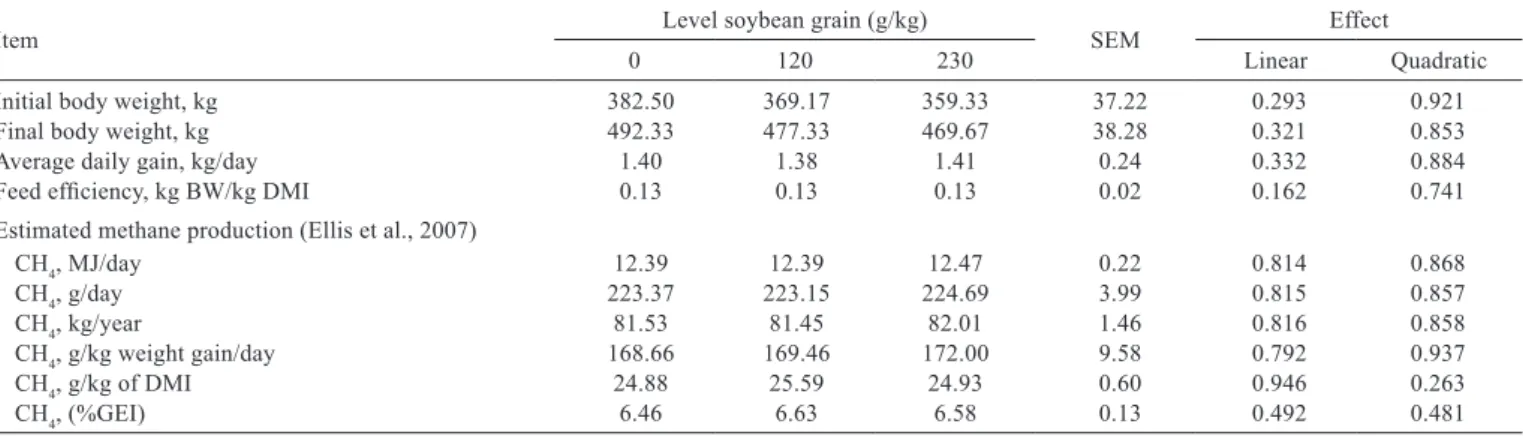
feed efficiency, or initial and final weights. Emissions of
methane (Table 3) expressed in: g/day, kg/year, CH4 g/kg
of DM, energy lost as methane (% of gross energy intake)
and the efficiency measured as kilograms of CH4 produced
relative to kilograms of meat produced did not differ among the treatments.
The hot carcass yield, loin eye area, subcutaneous fat thickness, cooling losses, yield of forequarter, hindquarter and side cut (Table 4) and qualitative characteristics of meat (Table 5), including water loss upon cooking, were not significantly different (P>0.05) among diets. Furthermore, differences in tenderness, measured by the shear force (SF), were not observed.
Discussion
We evaluated the influence of replacing soybean meal by soybean grain on the intake, performance and methane emission of Nellore steers finished in feedlot. The energy is determined by the amount of high-calorie feed that animal consumes, while the intake of low-quality and low-energetic-density feed is determined by the physical capacity of the gastrointestinal tract (Mertens 1994). Thus, the diets with different levels of soybean grain (lipid contents 20, 40 and 60 g/kg DM) displayed similar energetic densities, and no difference was observed in nutrient intake (4.2, 4.3 and 4.4 Mcal/kg, respectively).
Table 2 - Voluntary intake in cattle fed diets containing three levels of soybean grain
Intake Level soybean grain (g/kg) SEM Effect
0 120 230 Linear Quadratic
Dry matter, kg/day 11.05 10.44 10.40 0.91 0.054 0.031
Dry matter, g/kg BW 25.30 24.60 25.20 0.05 0.912 0.193
Organic matter, kg/day 10.04 9.49 9.46 0.89 0.191 0.464
Crude protein, kg/day 1.65 1.53 1.49 0.14 0.052 0.392
Ether extract, kg/day 0.20 0.43 0.64 0.05 <0.001 0.581
Neutral detergent fibre, kg/day 3.69 3.45 3.43 0.43 0.212 0.521
Neutral detergent fibre, g/kg BW 11.40 11.19 11.16 0.41 0.536 0.756
SEM - standard error of the mean; BW - body weight.
Table 3 - Effect of diets containing three levels of soybean grain on animal performance and methane emission
Item Level soybean grain (g/kg) SEM Effect
0 120 230 Linear Quadratic
Initial body weight, kg 382.50 369.17 359.33 37.22 0.293 0.921 Final body weight, kg 492.33 477.33 469.67 38.28 0.321 0.853
Average daily gain, kg/day 1.40 1.38 1.41 0.24 0.332 0.884
Feed efficiency, kg BW/kg DMI 0.13 0.13 0.13 0.02 0.162 0.741
Estimated methane production (Ellis et al., 2007)
CH4, MJ/day 12.39 12.39 12.47 0.22 0.814 0.868
CH4, g/day 223.37 223.15 224.69 3.99 0.815 0.857
CH4, kg/year 81.53 81.45 82.01 1.46 0.816 0.858
CH4, g/kg weight gain/day 168.66 169.46 172.00 9.58 0.792 0.937
CH4, g/kg of DMI 24.88 25.59 24.93 0.60 0.946 0.263
CH4, (%GEI) 6.46 6.63 6.58 0.13 0.492 0.481
SEM - standard error of the mean; BW - body weight; DMI - dry matter intake; GEI - gross energy intake.
Table 4 - Quantitative analysis of carcass characteristics of steers fed diets with different levels of soybean grain
Characteristic Level soybean grain (g/kg) SEM Effect
0 120 230 Linear Quadratic
Carcass yield, kg/100 kg BW 53.24 53.19 52.64 0.30 0.453 0.711 Hot carcass weight, kg 262.00 253.75 246.83 4.19 0.152 0.941
Carcass width, cm 37.31 37.13 36.67 0.39 0.532 0.871
Loin eye area, cm2 66.50 71.50 67.50 1.62 0.802 0.210
Subcutaneous fat thickness, mm 7.05 7.06 7.28 0.30 0.771 0.881
Bone, kg/100 kg BW 16.96 16.72 17.12 0.22 0.781 0.521
Muscle, kg/100 kg BW 56.32 54.52 54.54 1.44 0.640 0.781
Fat, kg/100 kg BW 28.15 28.31 27.86 0.47 0.810 0.781
Muscle/bone 3.34 3.26 3.19 0.10 0.562 0.991
Muscle + fat/bone 5.01 4.97 4.82 0.12 0.551 0.823
Effects of unsaturated fatty acids (UFA) on the satiety centre can also cause a reduction in dry matter intake (DMI). The soybean grain is rich in UFA (Mcniven et al., 2004), which can cause an increase in the flow of UFA to the small intestine (SI). Approximately 200 g/kg of UFA ingested by ruminants move to the SI without undergoing complete biohydrogenation (Martinez Marín, 2007). However, the UFA flow to the SI depends on the source of lipids and the composition of the diet (Jordan et al., 2006). However, the soybean grain content, when expressed in g/kg body weight (BW), did not affect intake by cattle in this study.
Several factors may affect the intake of dry matter and nutrients in diets with lipid concentrations above 50 g/kg (Cenkvàri et al., 2005). The results of the present study indicated that there was no significant difference in dry matter intake in relation to body weight (25.3, 24.6, and 24.2 g/kg BW for 0, 120 and 230 g/kg soybean grain, respectively).
Some results indicate that DM intake is a complex variable that can be affected by several factors including the type of animal, diet and feeding and weather conditions (Hristov et al., 2005). The observed differences in dry matter intake (kg/day) due to the concentration of soybean grain in the diet of steers did not affect the daily average weight gain, feed efficiency or feed conversion.
According to Mertens (1994), 60 to 90% of animal performance is due to dry matter intake, while 10 to 40% is attributed to variations in digestibility. Physical and chemical characteristics of feed and interactions among factors have a significant effect on the dry matter intake. The observed differences in dry matter intake in kg/day were caused by variations in weight among animals, as an increase in soybean grain levels did not alter their performance.
Average daily gain was higher than expected (1.40 kg/day), confirming that an increase in lipid content in the soybean grain did not affect weight gain. The diet used in this study was formulated for a weight gain of 1.20 kg/day, with an
average dry matter intake of 23.0 g/kg of body weight. The high dry matter intake observed in this study (25.0 g/kg BW) was likely responsible for the high weight gain.
Paulino et al. (2002) supplied steers with diets containing whole cottonseed, soybean meal and ground soy grain and did not observe any differences in weight gain. The observed average daily gain was 1.07 kg, which is lower than the average daily gain found in this study. Diets containing soybean grain or soybean meal did not affect performance because they possessed the same energetic value. This result is similar to the results from the present study, where different concentrations of lipids did not alter performance because the diets provided similar amounts of energy.
Souza et al. (2009) evaluated the performance of feedlot steers of four distinct genetic groups receiving diets with different levels of fat (low-fat, 31.5 g/kg ether extract, or high-fat diet, 72.8 g/kg ether extract). The average daily gain and dry matter intake by Nellore were 1.10 kg/day and 22.00 g/kg BW, respectively, and no differences between diets were observed. Furthermore, the results in the aforementioned study were lower than in the present study. These results may be related to the age and body weight of animals, which were lower than in the present study (17 months and 227 kg, respectively).
According to Owens et al. (1993), young cattle have better feed conversion (kg DMI/kg BW) and feed efficiency. As the animal approaches maturity, muscular tissue development declines, and an increase in fat deposition occurs, reflecting deteriorating feed conversion and weight gain. Thus, the initial age (21 months) and body weight (370 kg) were responsible for the higher feed conversion in this study.
As previously mentioned, performance is a response to ingestion and digestion of diet. In a metabolism experiment conducted by Messana et al. (2013), digestibility, intake and performance were not affected by the concentration of lipids in the diet (20, 40 and 60 g/kg DM). Thus, no reduction in
Table 5 - Characteristics of meat from cattle fed three levels of soybean grain
Characteristic Level soybean grain (g/kg) SEM Effect
0 120 230 Linear Quadratic
Shear force, kg/cm2 4.04 4.11 4.06 0.18 0.959 0.869
Water retention capacity, g/kg meat 74.45 72.45 73.74 0.81 0.691 0.720 Cooking losses, g/kg meat 30.49 30.71 29.72 0.75 0.729 0.371
Drip loss, g/kg meat 1.80 1.73 1.82 0.10 0.931 0.759
Evaporation loss, g/kg meat 28.69 28.97 27.9 0.80 0.699 0.710
L* (Lightness) 38.26 37.70 37.16 0.45 0.341 0.993
a* (Intensity of the colour red) 17.81 16.99 17.19 0.41 0.563 0.581 b* (Intensity of the colour yellow) 7.46 6.94 9.39 0.40 0.941 0.592
pH 5.61 5.59 5.64 0.01 0.259 0.184
intake or metabolic changes caused by elevated soybean grain (lipid concentrations) in the diet was observed.
We expected methane reduction in response to soybean grain inclusion in the diets, since Beauchemin et al. (2008), in a review of 17 studies, reported a reduction in enteric-methane emissions (5.6% per 1% added fat) for cattle and sheep. However, a meta-analysis (Eugene et al., 2008) showed that the decrease in methane emission caused by feeding fat to dairy cows was associated with a decrease in DMI.
In this study no difference in intake due the addition of soybean grains in the diet (increasing levels of lipids) was found. Thus, we believe that there was no toxic effect of the increase in long-chain fatty acids in the diet on gram-positive bacteria and protozoa in the rumen population. Thus, there
was no declination in the supply of H2 to the methanogens
related to propionate production and/or decrease in protozoa
population which are producing H2 (Morgavi et al., 2010).
This fact was proved in a study conducted by Messana et al. (2013), who found no effect of the same levels of lipid on the digestibility, protozoa count and ruminal parameters.
The observed methane emission of 6.5% GE intake is within the expected range according to Martin et al. (2007). According to these authors, methane losses remain relatively constant in the diets containing 30% to 40% concentrate (6% to 7% of GE intake) and then rapidly decrease to low levels (2% to 3% GE intake) in diets containing 80% to 90% concentrate. However, a sole change in the lipid content in response to the soybean grain inclusion in the diet was not enough to mitigate this gas, because the animal metabolism was not modified (Messana et al., 2013).
Carcass yield, loin eye area and subcutaneous fat thickness were homogeneous; no significant differences were observed among the treatments. Similar results were reported by Oliveira et al. (2009), who did not observe significant differences in the carcass yield of Nellore steers fed a diet containing 46 g/kg DM lipids (600 g concentrate/ kg diet) as compared with those fed 35 g/kg DM lipids (400 g concentrate/kg DM), for which an average carcass yield of 53.17 kg/100 kg BW was obtained.
In the present study, the average carcass yield was 53.17 kg/100 kg BW, which is similar to the results obtained by Paulino et al. (2002), who did not find differences in the carcass yield and hot carcass weight of animals fed whole soybean, soybean meal or whole cottonseed.
Carcass yield and slaughter weight are important because they determine the market value in Brazil. However, carcass length and loin eye area can be used to determine the value of carcasses because they are positively correlated with the yield of high-value cuts.
Carcass development, carcass length, leg and shin length, carcass width, silverside thickness and shin perimeter were not significantly different between treatments (P>0.05) because these characteristics are related to the slaughter weight of the animals. Similarly, Prado et al. (1995) did not observe significant differences in carcass weight (215.0 and 207.8 kg) and carcass yield (53.3 and 52.2 kg/100 kg BW) in cattle fed a diet supplemented with 150 or 300 g/kg whole cottonseed. The carcass yield obtained in the present study was similar to those observed by Prado et al. (1995), who evaluated Nellore steers with an average age of 26 months and average body weight of 400 kg.
The average subcutaneous fat thickness (SFT) of the steers was 7.13 mm. Although no significant differences were observed (P>0.05) among treatments, the cattle fed a diet with a lower lipid content (20 g/kg DM) showed a 3.16% reduction in SFT as compared with those fed a diet containing 60 g/kg DM lipids. The average subcutaneous fat thickness observed in the present study was 5 mm greater than the minimum required by slaughterhouses (Aferri et al., 2005).
On average, the loin eye area was 68.5 cm2, and no
differences were observed between treatments (P>0.05). These values were higher than those obtained by Vaz et al. (2001), who evaluated confined, castrated and intact Nellore
bullocks (52.20 cm2) with weights varying from 399.0
to 425.0 kg. Disparities between studies were caused by differences in physiological maturity, animal size, gender and the energetic density of the diet.
The market requires SFT values in the range of 3.0 to 6.0 mm; thus, the average SFT in this study (7.13 mm) is greater than market standards. A high fat content is undesirable because it lowers the yield of edible meat and must be trimmed before sale. According to Luchiari Filho (2000), there is a negative correlation between the thickness of overlaying fat and the amount of edible meat because a thicker layer of overlaying fat decreases the LEA.
The shear force values observed in this study were lower than those described by Abularach et al. (1998), who
observed an average SF of 6.7 kg/cm2 for Nellore animals
slaughtered between 23 and 29 months of age. According to
Belew et al. (2003), meat with a SF lower than 3.20 kg/cm2 is
considered very soft, while an SF between 3.20 and 3.90
kg/cm2 indicates soft texture; 3.90 to 4.60 kg/cm2 indicate
intermediate texture; and values greater than 6.00 kg/cm2
signify hard texture. Thus, the meat in this experiment possessed an intermediate texture. In a study by Fernandes et al. (2009), the average SF obtained for Nellore steers
animals fed 400 g concentrate/kg diet to 4.67 kg/cm2 in animals that received 600 g concentrate/kg diet, which are similar to the results obtained in this study.
In this study, animals younger than 25 months old at the time of slaughter were evaluated. However, the fat cover of Nellore steers carcasses was greater than 6 mm, and the fat distribution across the carcass was homogenous. Thus, factors other than enzyme activity in muscle may have affected meat tenderness.
The total loss, dripping loss, evaporation and water-retention capacity (WRC) of the carcasses were not significantly different (P>0.05) among the diets, and the observed values were appropriate. Oliveira et al. (2009) observed an average WRC of 73.39 g/kg meat for confined Nellore cattle, which corroborates the results of this study and is consistent with the generalisation that younger animals have a higher proportion of water in their muscle.
The average pH observed in this study was 5.61, and no differences in pH were observed (P>0.05) among the diets. As described by Abularach et al. (1998), pH values between 5.40 and 5.60 are normal for beef; thus, the pH of rib loins derived from different treatments were acceptable and contributed to the intensity of a* and b*. According to Fernandes et al. (2009), meat may appear dark at a pH greater than 6.00, due to an increase in enzymatic activity and water retention and a decrease in oxygen penetration. A pH of 6.00 is considered the border between normal cuts and dark cuts. Slaughterhouses in Brazil only export meat
with pH lower than 5.80, evaluated at 24 hours post-mortem
in the longissimus muscle.
The meat colour analysis displayed an average lightness (L*) of 37.70, and no differences in red (a*) and yellow (b*) intensities were observed (P>0.05) among the diets. Fernandes et al. (2009) observed a lightness of 31.31 in the meat from confined Nellore steers, which is similar to values obtained in the present research. They also stated that the lightness and colouration of the meat are directly related to the pH value after cooling. In this study, the pH values remained within the ideal limits, and the L*, a* and b* characteristics presented values considered normal.
Conclusions
The substitution of soybean meal for soybean grain in diets for feedlot Nellore steers has no detrimental effects on their intake, performance or carcass characteristics. Methane production is not affected by addition of soybean grain to the diets, while the intakes of ether extract and crude protein change.
Acknowledgments
The authors would like to thank the São Paulo Research Foundation (FAPESP - Fundação de Amparo à Pesquisa do Estado de São Paulo) and Bellman Nutrição Animal for their financial support.
References
Abularach, M. L. S.; Rocha, C. E. and Felicio, P. E. 1998. Características de qualidade do contrafilé de touros jovens da raça Nelore. Ciência e Tecnologia de Alimentos 18:205-210.
Aferri, G.; Leme, P. R.; Silva, S. L.; Putrino, S. M. and Pereira, A. S. C. 2005. Desempenho e características de carcaça de Novilhos alimentados com dietas contendo diferentes fontes de lipídios. Revista Brasileira de Zootecnia 34:1651-1658.
AOAC - Association of Official Analytical Chemists. 1990. Official methods of analysis. 15th ed. Association of Official Analytical Chemists, Washington, DC.
Belew, J. B.; Brooks, J. C. and McKenna, D. R. 2003. Warner-Bratzler shear evaluations of 40 bovine muscles. Meat Science 64:507-512. Beauchemin, K. A.; Kreuzer, M.; O’Mara, F. and McAllister, T. A.
2008. Nutritional management for enteric methane abatement: a review. Australian Journal of Experimental Agriculture 48:21-27. Brouwer, E. 1965. Report of sub-committee on constants and fastors.
p.441-443. In: Proceedings of the 3rd Symposium on Energy Metabolism. Blaxter, K. L., ed. E.A.A.P. Publication No. 11. Academic Press, London, New York.
Cenkvàri, E.; Fekete, S.; Fébel, H.; Veresegyházi, T. and Andrásofszky, E. 2005. Investigation on the effects of Ca-soaps of oil linseed on rumen fermentation in sheep on milk composition of goats. Journal of Animal Physiology and Animal Nutrition 89:172-178.
Eugène, M.; Massé, D.; Chiquette, J. and Benchaar, C. 2008. Meta-analysis on the effects of lipid supplementation on methane production in lactating dairy cows. Canadian Journal of Animal Science 88:331-334.
Ellis, J. L.; Kebreab, K.; Odongo, N. E.; McBride, B. W.; Okine, E. K. and France, J. 2007. Prediction of methane production from dairy and beef cattle. Journal of Dairy Science 90:3456-3466.
Fernandes, A. R. M.; Sampaio, A. A. M.; Henrique, W.; Tullio, R. R.; Oliveira, E. A. and Silva, T. M. 2009. Composição química e perfil de ácidos graxos da carne de bovinos de diferentes condições sexuais recebendo silagem de milho e concentrado ou cana-de-açúcar e concentrado contendo grãos de girassol. Revista Brasileira de Zootecnia 38:705-712.
Fox, D. G.; Tylutki, T. P.; Tedeschi, L. O.; Van Amburgh, M. E.; Chase, L. E.; Pell, A. N.; Overton, T. R. and Russell, J. B. 2003. The Cornell University Management Planning System; The net carbohydrate and protein system for evaluating herd nutrition and nutrient excretion — CNCPS version 5.0 MODEL DOCUMENTATION; Animal Science Mimeo 213. Department of Animal Science, Cornell University, Ithaca, New York, EUA.
Grainger, C. and Beauchemin, K. A. 2011. Can enteric methane emissions from ruminants be lowered without lowering their production? Animal Feed Science and Technology 166-167:308-320. Hankins, O. G. and Howe, P. E. 1946. Estimation of the composition
of beef carcasses and cuts. Technical Bulletin, 926. United States Department of Agriculture, Washington, D.C.
Hristov, A. N.; Price, W. J. and Shafii, B. 2005. A meta-analysis on the relationship between intake of nutrients and body weight with milk volume and milk protein yield in dairy cows. Journal of Dairy Science 88:2860-2869.
Hook, S. E.; Wright, A. D. G. and McBride, B. W. 2010. Methanogens: methane producers of the rumen and mitigation strategies. In: Review article. Archaea2010:1-11.
IPCC - Intergovernmental Panel on Climate Change. 1996. Revised IPCC guidelines for national greenhouse gas inventories: reference manual. Available at: <www.ipccnggip.iges.or.jp/public/gl/invs1.html>. Accessed on: June 1, 2014.
Jordan, E.; Kenny, D.; Hawkins, M.; Malone, R.; Lovett, D. R. and O’Mara, F. P. 2006. Effect of refined soy oil or whole soybeans on intake, methane output, and performance of young bulls. Journal of Animal Science 84:2418-2425.
Leng, R. A. 1993. Quantitative ruminant nutrition - A green science. Australian Journal of Agricultural Research 44:363-380.
Luchiari Filho, A. 2000. Pecuária da carne bovina. 1.ed. LinBife, São Paulo.
Martin, C.; Dubroeucq, H.; Micol, D.; Agabriel, J. and Doreau, M. 2007. Methane output from beef cattle fed different high-concentrate diets. p.46. In: Proceedings of the British Society of Animal Science. BSAS, Southport.
Martin, C.; Morgavi, D. P. and Doreau, M. 2010. Methane mitigation in ruminants: from microbe to the farm scale. Animal 4:351-365. Martinez Marin, A. L. 2007. Influencia de la nutricion sobre el
contenido y tipo de acidos grasos en la carne de los rumiantes. Archivos de Zootecnia 56:45-66.
Mertens, D. R. 1994. Forage quality, evaluation and utilization. p.450-493. In: Regulation of forage intake. Fahey Jr, G. C., ed. American Society of Agronomy, Madison.
Mertens, D. R. 2002. Gravimetric determination of amylase-treated neutral detergent fibre in feeds with refluxing beakers or crucibles: a collaborative study. Journal of AOAC International 85:1217-1240. Messana, J. D.; Berchielli, T. T.; Arcuri, P. B.; Reis, R. A.; Canesin,
R. C.; Ribeiro, A. F.; Fiorentini, G. and Fernandes, J. J. R. 2013. Rumen fermentation and rumen microbes in Nellore steers receving diets with different lipid contents. Revista Brasileira de Zootecnia 42:204-212.
McNiven, M. A.; Duynisveld, J.; Charmley, E. and Mitchel, A. 2004. Processing of soybean affects meat fatty acid composition and lipid peroxidation in beef cattle. Animal Feed Science and Technology 116:175-184.
Morgavi, D. P.; Forano, E.; Martin, C. and Newbold, C. J. 2010. Microbial ecosystem and methanogenesis in ruminants. Animal 4:1024-1036.
Moss, A. R.; Jouany, J. P. and Newbold, J. 2000. Methane production by ruminants: its contribution to global warming. Annales de Zootechnie 49:231-253.
Muller, L. 1987. Normas para avaliação de carcaça e concurso de carcaças de novilhos. 2.ed. Universidade Federal de Santa Maria, Santa Maria.
NRC - National Research Council. 2001. Nutrient requeriments of dairy cattle. 7.rev.ed. Washington, D.C.
Oliveira, E. A.; Sampaio, A. A. M.; Fernandes, A. R. M.; Henrique, W.; Oliveira, R. V. and Ribeiro, G. M. 2009. Desempenho e características de carcaça de tourinhos Nelore e Canchim terminados em confinamento recebendo dietas com cana-deaçúcar e dois níveis de concentrado. Revista Brasileira de Zootecnia 12:2465-2472.
Owens, F. N.; Dubeski, P. and Hanson, C. F. 1993. Factors that alter the growth and development of ruminants. Journal of Animal Science 71:3138-3150.
Paulino, M. F.; Detmann, E.; Valadares Filho, S. C. and Lana, R. P. 2002. Soja grão e caroço de algodão em suplementos múltiplos para terminação de bovinos mestiços em pastejo. Revista Brasileira de Zootecnia 31:484-491.
Prado, I. N.; Branco, A. F.; Zeoula, L. M.; Pinto, A. A.; Moraes, G. V. and Moreira, H. L. M. 1995. Desempenho e características de carcaça de bovinos Nelore confinados, recebendo 15 ou 30% de caroço integral de algodão, bagaço auto-hidrolisado de cana-de-açúcar e cana-de-cana-de-açúcar ou capim elefante. Arquivos de Biologia e Tecnologia 38:353-365.
Senger, C. C. D.; Kozloski, G. V.; Sanchez, L. M. B.; Mesquita, F. R.; Alves, T. P. and Castagnino, D. S. 2008. Evaluation of autoclave procedures for fiber analysis in forage and concentrate feedstuffs. Animal Feed Science and Technology 146:169-174.
Souza, A. R. D. L.; Medeiros, S. R.; Morais, M. G.; Oshiro, M. M. and Torres Jr., R. A. A. 2009. Dieta com alto teor de gordura e desempenho de tourinhos de grupos genéticos diferentes em confinamento. Pesquisa Agropecuária Brasileira 44:746-753. Van Nevel, C. and D. Demeyer. 1995. Feed additives and other
interventions for decreasing methane emissions. p.329-349. In: Biotechnology in animal feeds and animal feeding. Wallace, R. J. and Chesson, A., eds. VCH, Weinheim, Germany.
Van Soest, P. J. and Robertson, J. B. 1985. Analysis of forages and fibrous foods. Cornell University Press, Ithaca, NY.