CARBON ISOTOPE DISCRIMINATION AND YIELD OF UPLAND
RICE AS AFFECTED BY DROUGHT AT FLOWERING
1BEATRIZ DA SILVEIRA PINHEIRO2, ROGER BRIAN AUSTIN3, MARIA PEREIRA DO CARMO4 and MICHAEL ALAN HALL5
ABSTRACT - Field experiments involving upland rice genotypes, sown in various dates in late season, were carried out to assess the relationship of carbon isotope discrimination with grain yield and drought resistance. In each one of the three years, one trial was kept under good water availability, while other suffered water shortage for a period of 18-23 days, encompassing panicle emergence and flowering. Drought stress reduced carbon isotope discrimination measured on soluble sugars (∆s) extracted from stem uppermost internode at the end of the imposition period, but had relatively less effect on bulk dry matter of leaves, sampled at the same period, or that of uppermost internodes and grains, sampled at harvest. The drought-induced reduction in ∆s was accompanied of reduced spikelet fertility and grain yield. In the three trials subjected to drought, genotypes with the highest yield and spikelet fertility had the lowest ∆s. However, this relationship was weak and it was concluded that ∆s is not a sufficiently reliable indicator of rice drought resistance to be useful as a screening test in breeding programs. On the other hand, grain yield and spikelet fertility of genotypes which were the soonest to reach 50% flowering within the drought imposition period, were the least adversely affected by drought. Then, timing of drought in relation to panicle emergence and to flowering appeared to be a more important cause of yield variation among genotypes than variation in ∆s.
Index terms: Oryza sativa, internodes, spikelets fertility.
DISCRIMINAÇÃO ISOTÓPICA DE CARBONO E PRODUTIVIDADE DO ARROZ DE SEQUEIRO AFETADO POR SECA NO FLORESCIMENTO
RESUMO - Experimentos de campo, envolvendo genótipos de arroz de sequeiro, em várias datas de semeadura, realizadas tardiamente na estação de cultivo, foram conduzidos para investigar a relação da discriminação isotópica de carbono com a produtividade de grãos e resistência à seca. Em cada ano, um experimento foi mantido em boas condições hídricas, enquanto o outro sofreu falta de água, por período de 18-23 dias, abrangendo a emergência da panícula e florescimento. A deficiência hídrica reduziu a discriminação isotópica de carbono dos açúcares solúveis (∆s) extraídos do último entrenó do colmo, ao final do período de estresse, causando um efeito relativamente menor sobre a matéria seca das folhas amostradas na mesma ocasião, ou dos entrenós superiores e grãos amostrados na colheita. A redução de
∆s induzida por deficiência hídrica foi acompanhada de redução da fertilidade das espiguetas e do rendimento dos grãos. Nos três experimentos submetidos a estresse hídrico, os genótipos de maior rendimento e fertilidade de espiguetas apresentaram os menores valores de ∆s. Esta relação, no entanto, foi fraca, concluindo-se, assim, que ∆s não é um indicador seguro da resistência à seca em arroz, para ser utilizado com eficiência em programas de melhoramento. Por outro lado, o rendimento de grãos e a fertilidade das espiguetas dos genótipos que apresentaram o florescimento mais precocemente no período de imposição do estresse foram menos afetados pela seca. Assim, o momento de ocorrência da seca, em relação à emergência da panícula e ao florescimento, parece ser mais decisivo na determinação do rendimento de genótipos do que o ∆s.
Termos para indexação: Oryza sativa, deficiência hídrica, entrenós, fertilidade das espiguetas.
1 Accepted for publication on September 20, 2000.
2 Agronomist, D.Sc., Embrapa-Centro Nacional de Pesquisa
de Arroz e Feijão (CNPAF), Caixa Postal 179, CEP 75375-000 Santo Antônio de Goiás, GO.
E-mail: [email protected]
3Botanist, D.Sc., 15 Wingate Way, Trumpington, Cambridge
CB2 2HD, UK. E-mail: [email protected]
4Biologist, M.Sc., Universidade Federal de Viçosa (UFV), Av.
P.H. Holfs, s/n, CEP 36570-000 Viçosa, MG. E-mail: [email protected]
5Chemist, M.A., Godwin Institute, University of Cambridge,
INTRODUCTION
Rice is very sensitive to drought during the late
stages of floral development, especially during
panicle emergence and flowering (Hsiao, 1982). Yield
losses resulting from water stress in this period can
be severe and are associated with a decrease in
spikelet fertility (Pinheiro et al., 1985). Possible
reasons for this adverse effect of drought include:
inhibition of the elongation of the uppermost
internode resulting in panicle retention inside the
flag leaf sheath (O’Toole & Namuco, 1983); inhibition
of anthesis and spikelet desiccation (Hsiao, 1982;
O’Toole et al., 1984; Ekanayake et al., 1989); and
pollination abnormality (Ekanayake et al., 1990).
The drought-sensitivity of rice during flowering
may arise because, in contrast to leaves, rice panicles
have no adaptive mechanisms to modulate their water
loss. Their position in the canopy generally precludes
shading by the leaves. While they possess few
stomata, the diffusive conductance (mainly cuticular)
of panicles is very high just after they have emerged
(Batchelor & Roberts, 1983; O’Toole et al., 1984).
Carbon isotope discrimination (
∆
) of current
assimilate has been shown to be negatively related
to water-use efficiency (Farquhar & Richards, 1984;
Farquhar et al., 1989) and ∆ has been suggested as a
selection index in breeding for high yield under water
limiting conditions. Dingkuhn et al. (1991) showed
that under mild water stress leaf ∆ was negatively
correlated with leaf level water-use efficiency.
However, many studies comparing different
genotypes of crop species have shown that yield is
often positively correlated with ∆ (measured on grain
or other late-formed tissue), both in the absence and
in the presence of water stress (Condon et al., 1987;
Craufurd et al., 1991; Ehdaie et al., 1991; Hall et al.,
1994; Sayre et al., 1995; Ngugi et al., 1996).
Nevertheless, under water limiting conditions
negative correlations between ∆ and yield have also
been reported (Hall et al., 1994; Brugnoli & Farquhar,
2000). One probable reason for the positive
correlation in the absence of stress is that variation
in ∆ is associated with genotypic variation in
stomatal conductance, and that high conductance,
in turn, is associated with high rates of
photosynthesis and, consequently, high yield. Also,
in several studies where positive correlations have
been found, the trials experienced terminal drought,
so that late flowering genotypes which were more
severely affected, had a lower yield and
∆
of grain or
other late-formed dry matter.
It is known from studies on wheat and barley
(Austin et al., 1977, 1980) that a proportion of the
carbon assimilated during the stage of inflorescence
emergence accumulates in the uppermost internode
(spike peduncle) as soluble carbohydrates. It has
been reported by Brugnoli et al. (1998), that the
∆
of
soluble carbohydrates extracted from this tissue after
an episode of drought during flowering and early
grain filling is associated with the
assimilation-weighted value of the ratio of intercellular and
atmospheric partial pressures of CO
2(
pi/pa
), for this
particular growth stage. Therefore, it would reflect
the severity of the stress more sensitively than the
∆
of the bulk dry matter of any plant part, sampled at
the same time. Indeed, Scartazza et al. (1998), have
shown the strongest correlation of these stem sugars
with net assimilation rate and water use efficiency in
rice. The relevance of this parameter to yield
determination under drought conditions is of great
interest, considering its possible application as a
breeding tool.
The present study had the objective of assessing
the relationship of carbon isotope discrimination of
soluble carbohydrates from the uppermost internode
with grain yield of upland rice genotypes, submitted
to drought during panicle emergence and flowering.
MATERIAL AND METHODS
Six field trials were conducted during the period 1991-1994 at the research farm of Embrapa-Centro Nacional de Pesquisa de Arroz e Feijão, located at Santo Antonio de Goiás, in the state of Goiás, Brazil. This location is at latitude 16o 28' S, longitude 49o 17' W and at an altitude of
824 m above mean sea level. The climate is Aw, typical of tropical Savannah regions according to the Köppen classification. It possesses two well defined seasons, a rainy season, which lasts from October to April, and a dry season, from May to September.
Rice in the region is normally sown from November to December. The trials, in number of two per year, were purposely sown later in the season, starting in January, to benefit from good water availability during vegetative development but to increase the probability of drought during reproductive development. The aim was to make this stage to coincide with the onset of the dry season, in order to have a trial stressed during the critical stage of panicle emergence/flowering and a trial irrigated during this same period, to serve as a control.
All trials were of a randomized block design, with three replicates. Each plot consisted of 12 rows, spaced 0.50 m apart in 1991 and 1992, and 0.40 m apart in 1994. Plots were 5.5 m long in all three years. In 1991, each entry was sown on four dates, spaced one week apart. In 1992 and 1994, there were three sowing dates. The seeds were hand sown, at a rate of 80 viable seeds per m of row. In each year two identical trials were sown.
There were six common entries to the trials (IAC 47, IAC 165, Rio Paranaíba, Guarani, Rio Verde and Caiapó, all belonging to the japonica group), plus a variable number of advanced breeding lines, ranging from 11 to 18 each year, including japonica and japonica x indica derivatives.
The sowing date was scheduled according to the growth cycle of each cultivar: early genotypes were sown two to three weeks after the late ones, to enable genotypes to be matched for date of flowering. This procedure also enabled different matched flowering dates to be obtained, thus increasing the probability of having dry weather during at least one flowering date, given the significant year to year variation in the time of onset of the dry season.
All six trials received basic fertilization and top dressing, and were kept adequately supplied of water throughout vegetative and early reproductive stages. In this period, whenever the amount of rains fell bellow potential evaporation for a four-day period, control and stressed trials were sprinkler irrigated. After the period of stress imposition, during the targeted growth stage, irrigation was resumed in the stressed trial, and maintained till grain maturation.
The 1991 trials differed in their experimental protocol due to unexpected factors. The control trial showed symptoms of iron deficiency during reproductive development and no samples were taken from it. To assess the effect of water stress, the first group of genotypes to flower in the stressed trial, which received rains at this stage of growth, were taken as non-stressed controls to compare with later sowings of the same genotypes, whose average flowering date was 15 days later and which experienced drought during this same stage. In 1992 and 1994, only the sowing dates of the control
trials, corresponding to those in the stressed trials were considered.
It has to be noted that, in any one year and trial, observations and measurements were confined to one sowing of each genotype. The choice criteria were that a) the target growth stage of panicle emergence/flowering occurred when the visual symptoms of water stress (leaf rolling) were already apparent, and b) the best possible matching of flowering dates for all genotypes in the trial be attained.
The mean temperature and vapor pressure deficit at 15h local time in the three year’s field trials during the stress imposition period were 28.6°C and 19.1 mb, respectively.
Observations and measurements were taken with small differences according to trial.
For all trials, the date when 50% of the shoots in a plot had emerged panicles was recorded. From these records, the number of days from sowing to flowering, and from stress imposition to flowering (dsif) were calculated.
In the 1991 and 1992 trials, leaf water potential was measured on the last day of stress imposition, for all genotypes. In 1994, it was measured on five different days during the stress cycle, on eight genotypes. The measurements were always made during the period of maximum evaporative demand, from 12h to 14h, using a portable pressure chamber. Six leaves per plot were excised at the collar, wrapped in aluminum foil, put into plastic envelopes and transported to the measurement site in a box containing ice. Leaves were inserted in the chamber specimen holder and pressurized till sap droplets were visible at the cut surface. This balancing pressure, taken as a negative value, was taken as a measure of water potential before leaf excision.
Also at the end of the stress imposition period, a 10 g sample of flag leaf bulk tissue (1992 and 1994 trials) was taken from the studied plots of the trials. Additionally, at harvest, 10 g samples of uppermost internode (1991 and 1994) and grain (all three years) bulk tissue were taken. All these samples were dried and milled.
The carbon isotope composition in the samples was determined by mass spectrometry of the carbon dioxide produced by combustion of small sub-samples from each sample. Those analyses were carried out at the Laboratory of the Godwin, University of Cambridge, UK. The results were expressed in relation to the international standard, Pee Dee Belemnite. Following Farquhar & Richards (1984), carbon isotope discrimination was expressed as deviation in parts per thousand relative to air CO2 isotopic
composition (∆ of air, taken as -7.850/
00). Values of ∆ are
positive and expressed as 0/
00 (parts per thousand). The ∆
values of the uppermost internode sugars, and that of the bulk tissue of leaves, mature uppermost internodes and grains are referred to as ∆s, ∆l, ∆p and ∆g, respectively.
Yield (g m-2), 100 grain mass (g) and spikelet fertility
(%) were determined at harvest. The yields were based on hand harvested plot areas of 2.5 m2 in 1991 and 4 m2 in
1992 and 1994, taken from the central area of each plot. Prior to harvesting, 20 panicles were collected at random from the same area, and threshed manually. The spikelets were separated into "filled grains", comprising all the caryopses which had been fertilized and had developed into grain, and "empty grains", with lemmas and paleas but no caryopses. Both fractions were counted, and spikelet fertility expressed as a percentage was calculated dividing the number of filled grains by the number of spikelets per panicle. The weight of the filled grains fraction was added to the plot grain weight fraction. The 100 grain mass (g) was estimated from six sub-samples of 100 grains each, taken from the filled grain fraction.
Primary statistical analysis was performed by analysis of variance of each trial (control and stressed) separately, considering the trials to be laid out as randomized blocks.
Correlations and regressions were calculated for each trial separately on genotype means for each variate.
RESULTS AND DISCUSSION
In 1991, the sowings which were the first to flower
had good water availability to complete their growth
and development and to give good yield. These
sowings were taken to constitute the control trial. In
contrast, the sowings which were last to flower
experienced water shortage during the period of
panicle emergence and early grain filling. These
sowings were kept without irrigation for 18 days.
The dates of 50% flowering of the first and last
genotype to flower, and the mean date of flowering
of all genotypes are given in Table 1. Soil water was
depleted slowly and before it was replenished
through sprinkler irrigation at the end of the stress
period, the plants had attained water potentials
varying between -1.1 and -1.8 MPa, with a mean value
of -1.4 MPa.
In 1992, the control and the stressed plots were of
the same sowing date and differed only slightly in
date of flowering (Table 1). After 23 days without
rain, plots were visibly stressed and leaf water
potentials, in the last day of stress imposition, ranged
from -1.2 to -2.2 MPa, with an average of -1.8 MPa.
In the 1994 trials, the matched sowing of the
genotypes flowered over a ten-day period, starting
seven days after stress imposition in the stressed
trial, and the mean date of flowering was attained in
the thirteenth day of a stress imposition period of 22
days (Table 1). Due to residual rains (13,3 mm) and
cloudy weather, mean leaf water potential in the
stressed plots reached a mean value of -1.31 MPa on
the last day of stress imposition, considerably higher
(less stressed) than in the previous years.
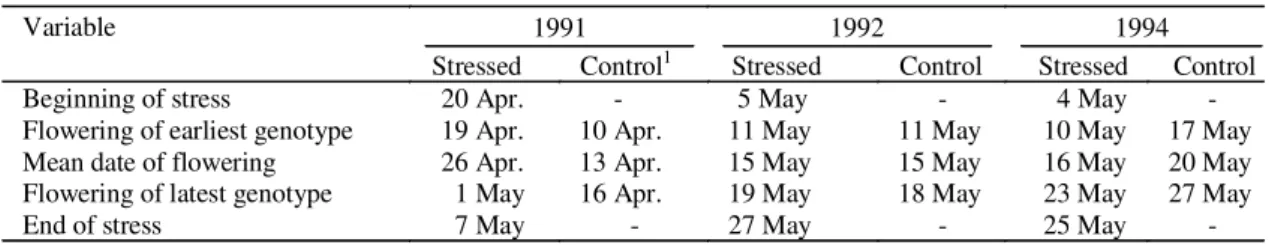
TABLE 1. Dates of beginning and end of stress treatment and dates of flowering, for the control and stressed trials, in three years of field experiments.
1In 1991, irrigated control was lost and earlier sowings of the stressed trial, whose panicle emergence coincided with late rains, were used as control.
Variable 1991 1992 1994
Stressed Control1 Stressed Control Stressed Control
Beginning of stress 20 Apr. - 5 May - 4 May
-Flowering of earliest genotype 19 Apr. 10 Apr. 11 May 11 May 10 May 17 May
Mean date of flowering 26 Apr. 13 Apr. 15 May 15 May 16 May 20 May
Flowering of latest genotype 1 May 16 Apr. 19 May 18 May 23 May 27 May
-Due to late sowing, the yield of all experiments
was below the potential, which is around
4.5 tons/ha, for traditional upland rice plant type
(Pi-nheiro & Guimarães, 1990). Nevertheless, both in the
1991 and 1994 trials, control yield fell within the
average yield in the region, of 1.4 ton/ha, while it
was greater than that in 1992 (Table 2).
Except for1994, mean yields, as expected, were
greater in the irrigated control than in the stressed
trials (Table 2). Stress intensity was most severe in
the 1992 trial, resulting in a 42% of yield loss, whereas
the yield loss in 1991 was of only 20%. In 1994, yields
from the irrigated trial were low, reflecting the poor
growth of the plants on this trial site. This trial was
sown on soil which had been cropped with rice in
the previous season; such sequential cropping was
later verified to induce a process of autotoxicity
(Silveira et al., 1998) which is likely to have been the
main reason for the poor yield from this irrigated trial.
Plant growth in the stressed trial, by contrast, was
normal, and yields were considered to have been
depressed by the drought treatment, and not by other
unquantified features.
The average reduction in yield over the three years
was 22%. It should be remembered that each year
the control and stressed trials were on different,
though adjacent land, so in any one year the estimate
of the effect of drought on yield was confounded
with trial site.
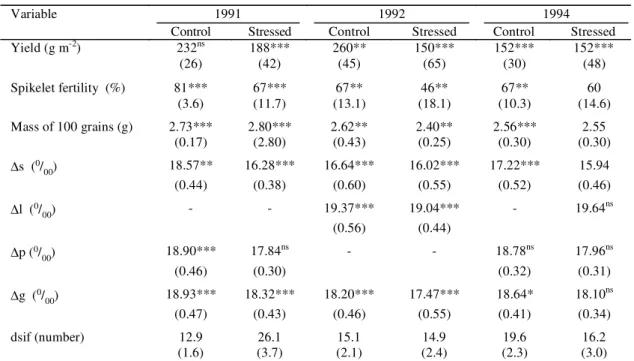
In each year, drought reduced spikelet fertility,
the average reduction over the three years being 20%
(spikelet fertility in irrigated trials 71.6%, in stressed
trials 57.5%). Thus the percentage reduction in yield
was virtually the same as the percentage reduction
in spikelet fertility. Drought also reduced
∆
s but
generally had less effect on the ∆ of the bulk plant
tissues (Table 2), as previously reported (Scartazza
et al., 1998).
TABLE 2. Means of the given characters in rice genotypes, in the control and stressed trials, in three years of
field experiments1.
1Numbers inside brackets are phenotypic standard deviation; ∆s: carbon isotope discrimination of sugars extracted from the uppermost internode at
the end of the stress period; ∆l: carbon isotope discrimination of flag leaves at the end of the stress period; ∆p: carbon isotope discrimination of uppermost internodes; ∆g: carbon isotope discrimination of grains; both at harvest; dsif: days from stress imposition to 50% panicle emergence.
ns, *, ** and *** Non-significant and significant at 5%, 1% and 0,1%, respectively, by the F test.
1991 1992 1994
Variable
Control Stressed Control Stressed Control Stressed
Yield (g m-2) 232ns 188*** 260** 150*** 152*** 152***
(26) (42) (45) (65) (30) (48)
Spikelet fertility (%) 81*** 67*** 67** 46** 67** 60
(3.6) (11.7) (13.1) (18.1) (10.3) (14.6)
Mass of 100 grains (g) 2.73*** 2.80*** 2.62** 2.40** 2.56*** 2.55
(0.17) (2.80) (0.43) (0.25) (0.30) (0.30)
∆s (0/
00) 18.57** 16.28*** 16.64*** 16.02*** 17.22*** 15.94
(0.44) (0.38) (0.60) (0.55) (0.52) (0.46)
∆l (0/
00) - - 19.37*** 19.04*** - 19.64
ns
(0.56) (0.44)
∆p (0/
00) 18.90*** 17.84
ns - - 18.78ns 17.96ns
(0.46) (0.30) (0.32) (0.31)
∆g (0/
00) 18.93*** 18.32*** 18.20*** 17.47*** 18.64* 18.10
ns
(0.47) (0.43) (0.46) (0.55) (0.41) (0.34)
dsif (number) 12.9 26.1 15.1 14.9 19.6 16.2
Table 2 gives the means and phenotypic standard
deviations (psd) of the main variates. The psd of a
variate is the square root of the variance of the
genotype mean squares. In the context of the present
work, it is more meaningful than the coefficient of
variation which is psd/mean expressed as a
percentage. Table 3 shows that the average
correlation coefficient between grain yield and
spikelet fertility was +0.715 in the stressed trials but
+0.403 in the irrigated ones. Table 3 also shows that,
among genotypes, yield was negatively correlated
with
∆
s at the end of the drought period. This
association was also evident, though weaker, in the
irrigated trials. Yield was also, but generally more
weakly, negatively associated with
∆
g.
Even though sowing was phased in the attempt
to synchronize date of flowering of the genotypes,
there was some variation. The genotypes which were
the earliest to flower in relation to the drought
imposition period, tended to be of high yielding. Thus
the association between grain yield and
∆
s was likely
to have been distorted by the association between
yield and the number of days from stress imposition
to flowering (dsif). To allow this, a multiple regression
of
∆
s and dsif on yield was computed for each trial.
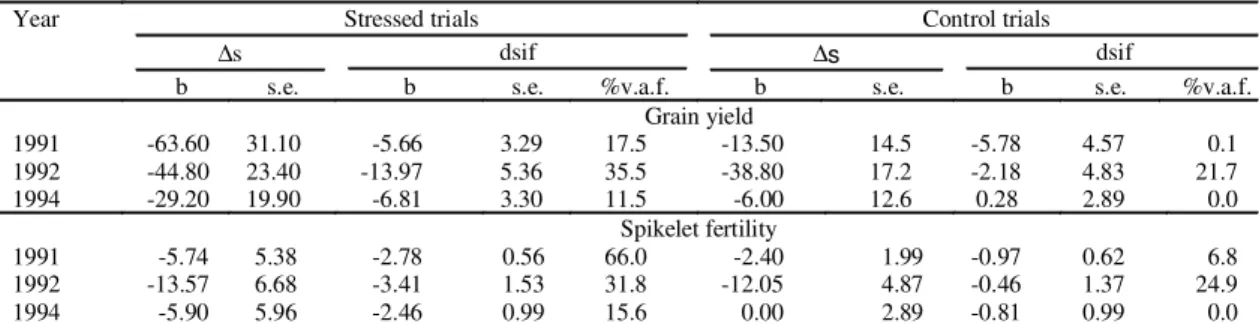
The results (Table 4) showed that the negative
association between yield and
∆
s was maintained,
though it was only significant in the stressed trial in
1991. Table 4 also shows that for the stressed trials,
the coefficient for dsif and yield was itself significant,
indicating the importance of the time of stress
imposition in relation to flowering: those genotypes
which reached flowering the soonest after stress
imposition suffered the least reduction in yield.
Statistical analysis was also carried out to test
whether genotypes which had a long growth cycle
(a long period between sowing and flowering) and
which may have been expected to be larger at the
time of stress imposition, and hence to lose water
more rapidly, were more affected by the stress
imposed. The results showed no relationship of the
size of the growth cycle and any other variable
measured. Hence, in these trials, date of sowing and
duration of life cycle were not factors which affected
the interpretation of the relationship between yield,
∆
s and dsif.
Analysis of variance of all the data for the six
genotypes common to all trials (Table 5) showed that
there were significant differences among genotypes
for all variates, and that, except for
∆
s, genotypes
TABLE 3. Simple correlation coefficients between the given characters, for the control and stressed trials, in
three years of field experiments1.
1∆s: carbon isotope discrimination of sugars extracted from the uppermost internode at the end of the stress period; ∆l: carbon isotope discrimination
of flag leaves at the end of the stress period; ∆p: carbon isotope discrimination of uppermost internodes; ∆g: carbon isotope discrimination of grains; both at harvest; dsif: days from stress imposition to 50% panicle emergence; sf: spikelet fertility; r: value of correlation coefficien at 5% probability.
1991 1992 1994 Mean
Correlated characters
Control Stressed Control Stressed Control Stressed Control Stressed
Yield and ∆s -0.162 -0.337 -0.548 -0.416 -0.111 -0.168 -0.273 -0.307
Yield and ∆l - - -0.089 -0.214 - +0.182 -
-Yield and ∆p -0.355 -0.212 - - -0.111 +0.041 -
-Yield and ∆g -0.362 -0.393 -0.247 +0.207 -0.274 -0.108 -0.294 -0.098
Yield and sf +0.288 +0.491 +0.339 +0.842 +0.579 +0.811 +0.403 +0.715
Yield and dsif -0.269 -0.271 -0.274 -0.541 +0.049 -0.330 -0.171 -0.380
sf and ∆s -0.209 +0.222 -0.577 -0.482 +0.047 -0.040 -0.246 -0.100
dsif and ∆s -0.235 -0.520 +0.384 +0.084 -0.256 -0.318 -0.052 -0.251
Degrees of freedom 18 18 16 16 22 22 43 43
varied in their response to drought, as judged by the
significance of the genotype x irrigation treatment
interaction term.
In all experiments, drought reduced ∆s, the ∆ of
sugars extracted from the stem uppermost internode
at the end of the drought period. As noted earlier,
these sugars can represent part of the carbon
assimilated during the drought period. The ∆ of these
sugars reflects the assimilation-weighted value of
the ratio of intercellular and atmospheric partial
pressures of CO
2(
pi/pa
) when the contributing
carbon was assimilated during the drought period
(Brugnoli et al., 1988, 1998).
The coefficients of the number of days from stress
imposition to flowering (dsif) term in the multiple
regressions (Table 4) were negative (except for one,
non-significant exception). This result implies that
genotypes which flowered soonest after stress
imposition gave greater yields for a given ∆s than
later flowering ones. All genotypes in a given trial
would have experienced the same duration of
drought, but the early flowering ones would likely
have been less stressed during the critical early
phase of panicle emergence than later flowering ones,
because plant water stress would have become
progressively more severe with increasing time from
the start of the drought period. If this interpretation
is correct, it suggests that there is a ‘window’ during
the period of panicle emergence when spikelet fertility
is the most sensitive to water stress, before and after
which its sensitivity is considerably less. This finding
is consistent with the reports of Batchelor & Roberts
(1983) and O’Toole et al. (1984) that the diffusive
conductance of panicles to water loss is very high
TABLE 4. Multiple regression coefficients of carbon isotope discrimination of soluble sugars extracted from
the uppermost internode (∆∆∆∆∆s) and number of days from stress imposition and flowering (dsif) on
grain yield and spikelet fertility, for the control and stressed trials, in three years of field
experiments1.
1 b: multiple regression coefficient; s.e.: standard error; %v.a.f.: percentage variation accounted for by the given regression.
Year Stressed trials Control trials
∆s dsif ∆s dsif
b s.e. b s.e. %v.a.f. b s.e. b s.e. %v.a.f.
Grain yield
1991 -63.60 31.10 -5.66 3.29 17.5 -13.50 14.5 -5.78 4.57 0.1
1992 -44.80 23.40 -13.97 5.36 35.5 -38.80 17.2 -2.18 4.83 21.7
1994 -29.20 19.90 -6.81 3.30 11.5 -6.00 12.6 0.28 2.89 0.0
Spikelet fertility
1991 -5.74 5.38 -2.78 0.56 66.0 -2.40 1.99 -0.97 0.62 6.8
1992 -13.57 6.68 -3.41 1.53 31.8 -12.05 4.87 -0.46 1.37 24.9
1994 -5.90 5.96 -2.46 0.99 15.6 0.00 2.89 -0.81 0.99 0.0
TABLE 5. Mean squares from the analysis of variance across years for grain yield, spikelet fertility, carbon
isotope discrimination of grains (∆∆∆∆∆g) or of soluble sugars extracted from the uppermost internode
(∆∆∆∆∆s), for the six rice genotypes common to all trials.
Item Degrees of freedom Grain yield Spikelet fertility ∆g ∆s
Genotype (G) 5 1,943 275.3 0.4691 0.4153
Year (Y) 2 14,193 353.2 2.0661 4.9475
Water (W) 1 12,564 541.2 1.0927 15.0973
G x Y 10 1,560 28.8 0.1910 0.0809
G x W 5 1,299 55.3 0.2016 0.0261
G x Y x W 10 369 20.6 0.0438 0.0702
during early panicle emergence. Pinheiro (1989) found
that spikelets were most drought-sensitive when
3 -9 cm of the panicle had emerged from the flag leaf
sheath. Panicles within the flag leaf sheath or those
which had emerged earlier had a greater spikelet fertility.
It is possible that this effect of drought was mediated
by plant water status
per se
(including possible
hormonal effects)
,
or through effects on the availability
of carbohydrates, either mobilized from storage or
derived from current photosynthesis. In either case,
genotypes which flowered early in the period of stress
would have been likely to escape the worst effects of
drought. Indeed, for the stressed trials, the importance
of the spikelet fertility term in the multiple regressions
(Table 4) was greater than that of the ∆s term. It is not
possible from the present results to determine whether
or not there was variation among genotypes which
were at exactly the same stage of panicle emergence at
the time of stress imposition in their panicle water loss
and consequent sensitivity to drought. To make such
an assessment, near-isogenic lines would need to be
compared.
As expected, drought reduced ∆p and ∆g,
presumably because some growth in structural dry
matter of the uppermost internode was occurring
during the drought period, and soluble sugars
accumulated during panicle emergence made some
contribution to grain carbon. In contrast, drought
had little effect on ∆l, probably because the leaves
were fully grown when sampled.
Possible explanations of the negative correlation
between
∆s and yield include increased water use
efficiency, which may be beneficial for fertility and
grain yield. Low
∆
s implies a low ratio of intercellular
and atmospheric CO
2(
pi/pa)
and probably low
stomatal conductance during the period when sugars
are accumulating in uppermost internodes.
Alternatively, it could imply a high carboxylation
capacity, but this is a most unlikely effect of drought.
Low
pi/pa
implies a high leaf level water use
efficiency reflected in low ∆ of the carbon formed
from current photosynthesis, including that of
uppermost internode sugars.
CONCLUSIONS
1. Carbon isotope discrimination of soluble sugars
extracted from the stem uppermost internode (∆s) is
not a sufficiently reliable indicator of drought
resistance among rice genotypes to be useful as a
screening test in breeding programs.
2. The timing of drought occurrence in relation to
panicle emergence and flowering appeared to be a
more important cause of yield variation among
genotypes than variation in
∆
s.
ACKNOWLEDGEMENTS
To the European Commission D.G. XII, who
supported this work_Contract number TS3
CT930200; to Enrico Brugnoli for helpful discussions
during the course of this work.
REFERENCES
AUSTIN, R.B.; EDRICH, J.A.; FORD, M.A.; BLACKWELL, R.D. The fate of the dry matter, carbohydrates and 14C lost from the leaves and stems
of wheat during grain filling. Annals of Botany, London, v.41, p.1309-1321, 1977.
AUSTIN, R.B.; MORGAN, C.L.; FORD, M.A.; BLACKWELL, R.D. Contributions to grain yield from pre-anthesis assimilation in tall and dwarf barley phenotypes in two contrasting seasons. Annals of
Botany, London, v.45, p.309-319, 1980.
BATCHELOR, C.H.; ROBERTS, J. Evaporation from the irrigation water, foliage and panicles of paddy rice in North-East Sri Lanka. Agricultural Meteorology,
Amsterdam, v.29, n.1, p.11-26, 1983.
BRUGNOLI, E.; FARQUHAR, G.D. Photosynthetic fractionation of carbon isotopes. In: LEEGOOD, R.C.; SHARKEY, T.D.; CAEMMERER, S. von. (Ed.). Photosynthesis: physiology and metabolism, advances in photosynthesis. The Netherlands : Kluwer Academic, 2000. p.399-434.
BRUGNOLI, E.; HUBICK, K.T.; CAEMMERER, S. von; WONG, S.C.; FARQUHAR, G.D. Correlation between the carbon isotope discrimination in leaf starch and sugars of C3 plants and the ratio of intercellular and atmospheric partial pressures of carbon dioxide. Plant Physiology, Rockville, v.88, n.4, p.1418-1424, 1988.
isotope discrimination in structural and non-structural carbohydrates in relation to productivity and adaptation to unfavorable conditions. In: GRIFFITHS, H. (Ed.). Stable isotopes: integration
of biological, ecological and geochemical processes. Oxford : BIOS Scientific, 1998. p.133-146. CONDON, A.G.; RICHARDS, R.A.; FARQUHAR, G.D.
Carbon isotope discrimination is positively correlated with grain yield and dry matter production in field grown-wheat. Crop Science, Madison, v.27, n.5, p.996-1001, 1987.
CRAUFURD, P.Q.; AUSTIN, R.B.; ACEVEDO, E.; HALL, M.A. Carbon isotope discrimination and grain-yield in barley. Field Crops Research,
Amsterdam, v.27, n.4, p.301-313, 1991.
DINGKUHN, M.; FARQUHAR, G.D.; DE DATTA, S.K.; O’TOOLE, J.C. Discrimination of 13C among
rice genotypes having different water use efficiencies.
Australian Journal of Agricultural Research,
Collingwood, v.42, p.1123-1131, 1991.
EHDAIE, B.; HALL, A.E.; FARQUHAR, G.D.; NGUYEN, H.T.; WAINES J.G. Water-use efficiency and carbon isotope discrimination in wheat. Crop
Science, Madison, v.31, n.5, p.1282-1288, 1991.
EKANAYAKE, I.J.; DE DATTA, S.K.; STEPONKUS, P.L. Spikelet sterility and flowering response of rice to water stress at anthesis. Annals of Botany,
London, v.63, p.257-264, 1989.
EKANAYAKE, I.J.; STEPONKUS, P.L.; DE DATTA, S.K. Sensitivity of pollination to water deficits at anthesis in upland rice. Crop Science, Madison,
v.30, n.2, p.310-315, 1990.
FARQUHAR, G.D.; EHLERINGER, J.R.; HUBICK, K.T. Carbon isotope discrimination and photosynthesis.
Annual Review of Plant Physiology and Plant
Molecular Biology, Palo Alto, v.40, p.503-537,
1989.
FARQUHAR, G.D.; RICHARDS, R.A. Isotopic composition of plant carbon correlates with water-use efficiency of wheat genotypes. Australian
Journal of Plant Physiology, Collingwood, v.11,
n.6, p.539-552, 1984.
HALL, A.E.; RICHARDS, R.A.; CONDON, A.G.; WRIGHT, G.C.; FARQUHAR, G.D. Carbon isotope discrimination and plant breeding. Plant Breeding
Reviews, New York, v.12, p.81-113, 1994.
HSIAO, T.C. The soil plant atmosphere continuum in relation to drought and crop production. In: INTERNATIONAL RICE RESEARCH INSTITUTE (Los Baños, Filipinas). Drought
resistance in crops with emphasis on rice. Los
Baños, 1982. p.39-52.
NGUGI, E.C.K.; AUSTIN, R.B.; GALWEY, N.W.; HALL, M.A. Associations between grain yield and carbon isotope discrimination in cowpea. European
Journal of Agronomy, Amsterdam, v.5, n.1/2,
p.9-17, 1996.
O’TOOLE, J.C.; HSIAO, T.C.; NAMUCO, O.S. Panicle water relations during water stress. Plant Science
Letters, Limerick, v.33, n.2, p.137-143, 1984.
O’TOOLE, J.C.; NAMUCO, O.S. Role of panicle exsertion in water stress induced sterility. Crop
Science, Madison, v.23, n.6, p.1093-1097, 1983.
PINHEIRO, B. da S. Estudo das relações hídricas du-rante o processo de emissão de panículas e antese
do arroz de sequeiro (Oryza sativa L.). Campinas :
USP, 1989. 176p. Tese de Doutorado.
PINHEIRO, B. da S.; GUIMARÃES, E.P. Índice de área foliar e produtividade do arroz de sequeiro. I. Níveis limitantes. Pesquisa Agropecuária Brasileira, Brasília, v.25, n.6, p.863-872, jun. 1990.
PINHEIRO, B. da S.; STEINMETZ, S.; STONE, L.F.; GUIMARÃES, E.P. Tipo de planta, regime hídrico e produtividade do arroz de sequeiro. Pesquisa
Agropecuária Brasileira, Brasília, v.20, n.1,
p.87-95, jan. 1985.
SAYRE, K.D.; ACEVEDO, E.; AUSTIN, R.B. Carbon isotope discrimination and grain yield for three bread wheat germplasm groups grown at different levels of water stress. Field Crops Research, Amsterdam, v.41, n.1, p.45-54, 1995.
SCARTAZZA, A.; LAUTERI, M; GUIDO, M.C.; BRUGNOLI, E. Carbon isotope discrimination in leaf and stem sugars, water use efficiency and mesophyll conductance during different developmental stages in rice subjected to drought.
Australian Journal of Plant Physiology,
Collingwood, v.25, p.489-498, 1998.
SILVEIRA, P.M. da; ZIMMERMANN, F.J.P.; AMARAL, A.M. do. Efeito da sucessão de cultura e do preparo do solo sobre o rendimento do arroz de sequeiro. Pesquisa Agropecuária Brasileira,