university of
groningen
groningen growth and
development centre
GGDC RESEARCH MEMORANDUM
161
FROM CONVERGENCE TO DIVERGENCE:
PORTUGUESE DEMOGRAPHY AND
ECONOMIC GROWTH, 1500-1850
Nuno Palma and Jaime Reis
F
ROMC
ONVERGENCE TOD
IVERGENCE:
P
ORTUGUESED
EMOGRAPHY ANDE
CONOMICG
ROWTH,
1500-1850
1Nuno Palma
Department of Economics, Econometrics, and Finance, University of Groningen
Jaime Reis
ICS, Universidade de Lisboa
Abstract
We construct the first time-series for Portugal’s per capita GDP for 1500-1850, drawing on a new and extensive database. Starting around 1550 there was a highly persistent upward trend of per capita income, which accelerated after 1700 and peaked 50 years later. At that point, per capita incomes were high by European standards. But as the second half of the eighteenth cen-tury unfolded, a phase of economic decline was initiated. This continued into the nineteenth century, and Portugal found itself as one of the most backward European economies precisely at the dawn of the era of modern economic growth.
This version: September 13th, 2016
Keywords: Early Modern Portugal, Historical National Accounts, Standards of Living Debate, The Little Divergence, Malthusian Model
JEL codes: N13, O52
1 We are grateful to Steve Broadberry, Leonor F. Costa, António C. Henriques, Kivanç Karaman, Wolfgang
Kel-ler, Şevket Pamuk, Leandro Prados de la Escosura, Joan R. Rosés, Jeffrey Williamson, and many participants at the Nova SBE lunchtime seminar, the 2014 Accounting for the Great Divergence conference, The University of Warwick in Venice, the 2014 APHES conference in Lisbon, and the 2015 EHES in Pisa for discussion of this pa-per. We also thank colleagues on the Prices, Wages and Rents in Portugal 1300-1910 project. This paper partly relies on previous joint work with Leonor Costa and Conceição Andrade Martins, to whom we owe special thanks. We acknowledge the help of Hermínia Barbosa, Cristina Giesteira and Carlota Santos for giving us access to their parish registers data. We are also grateful to Paulo Paixão for dedicated research assistance in collecting much of the raw demographic data. Finally, we thank FCT for financial support for this project.
1. Introduction
The effort to understand the historical origins of modern economic growth necessarily involves paying attention to the European periphery. Understanding what “went wrong” in the periphery is a crucial part of the effort to make sense of what “went right” in Northern Europe. Knowing how prices, rents, income and population evolved in the countries that lagged behind is a critical piece of the puzzle, as it provides a source of variation in the data which allows us to compare them with the modernizing economies. The behavior of such major macroeconomic variables during the early modern period is now well known for England, Holland, Germany, Sweden, Italy, and Spain.2 In this study, we consider the case of Portugal, which has so far been absent from the literature.
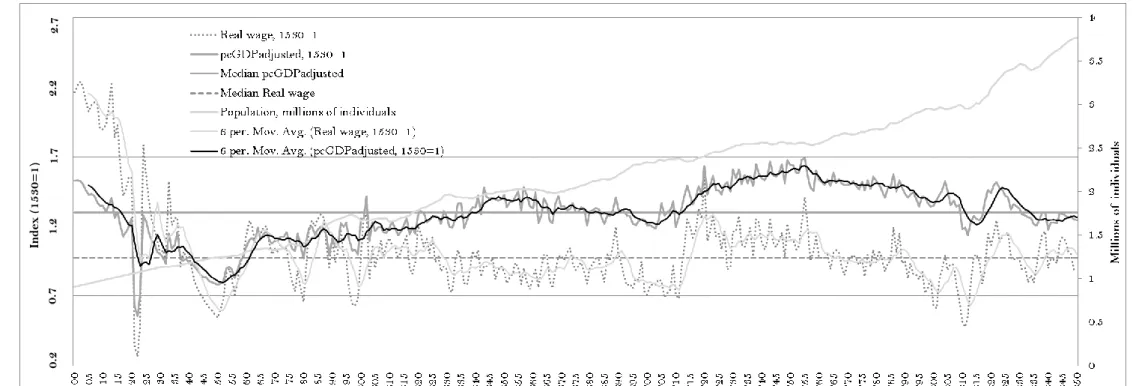
In this paper we present the first annual estimates of Portugal’s early modern GDP per capita, real wages and population. In Figure 1, we show indices for these variables for the peri-od 1500-1850. Portugal’s early mperi-odern performance was characterized by several distinctive phases. The first was a period of decline from the high levels in the standard of living seen at the beginning of the sixteenth century, which lasted until the 1550s.3 This was followed by extensive and intensive growth, which lasted until the mid-seventeenth century. From then on and until the early eighteenth century there was a slight drop in per capita GDP. This was followed in the half century after 1700 by strong intensive growth; as a result Portugal’s 1750s per capita GDP came to be almost as high as that of England or the Netherlands.4
This economic experience is especially striking in light of the statement by Broadberry et al (2015, p. 212) that in Britain, “[In the period 1780-1830] for the first time the Kuznets condition of simultaneous growth of both GDP per head and population was being met". As Figure 1 shows, Portugal in fact went through two earlier episodes of this nature, both of which were rather prolonged: one from about 1550 to 1650, and another from about 1700 to the 1750s. Once past the 1750s, however, the sources of this expansion began to peter out. Economic performance slowed down but population grew strongly, and in sixty years all of the recent GDP per capita and real wage gains were wiped out. Thereafter income per person con-tinued to decline, with the consequence that by the middle of the nineteenth century Portugal became one of the most backward economies of Europe, precisely as the era of modern econom-ic growth was beginning in other countries.5
Portugal’s population rose by a factor of four during these three and a half centuries. It displayed marked fluctuations, though with quite a different timing from that of the real econ-omy. During the roughly two centuries after 1550, it too expanded strongly but was never able to keep up with the growth of the economy. In contrast, as the latter slowed down during the century which followed the 1750s, population growth gathered speed – at an annual rate of increase of 0.4 percent – and thus contributed significantly to the erosion of real per capita in-comes.
2 See, for England, Allen (2001), and Broadberry et al (2015); for Holland, van Zanden and Leeuwen (2012); for
Germany, Pfister (2011), and Pfister et al (2012); for Sweden, Edvinsson (2013a, b) and Schön and Krantz (2012); for Italy, Malanima (2011, 2013); and for Spain, Álvarez-Nogal and Prados de la Escosura (2007, 2013).
3 See Reis (2016, p. 188, fnt. 34) for a discussion of the severe agricultural crises of this period.
4 In the 20-year period between 1703 and 1723, Portugal’s per capita income grew by an average of 1.4% per year
– a remarkable rate for a pre-modern economy.
5 Around 1850 Portugal’s per capita GDP was close to the levels of the Scandinavian countries, and higher than
Figure 1. Portugal’s GDP per capita, real wage (left scale, unit: index 1530=1) and population (right scale, interpolation 1500-1529, annual variation since
1530, unit: millions of individuals), 1500-1850. Sources: for GDP and real wage, see text, for population: see text and Palma and Reis (2015).
In dex ( 15 30 = 1) 0.2 0.7 1.2 1.7 2.2 2.7
In a recent summary of the state of the art, Grafe (2015) singles out several issues re-garding the dynamics of European early modern economies. These raise doubts about a num-ber of established facts in this field. In the present study, we seek to clarify some of the most important ones using Portugal’s historical experience to this end. The first questions the “dogma of a largely stagnant early modern European economy” (Grafe 2015, p. 280). This re-quires attention being paid to the significant bouts of expansion driven by technical and organ-izational change underwent by Portugal in this era. The second queries the country’s adher-ence to the canonical Malthusian model, particularly during spells when income deviated per-sistently from the Malthusian subsistence level and Ricardo’s iron law of wages broke down. The third confronts the conventional vision of the geography of a Little Divergence during which early modern European growth was ‘restricted to the North Sea region … while per capita income in the rest of Western Europe was constant at best’ (Van Zanden 2009, p. 5).6 The fourth focuses on the notion of a “premodern intensive growth” process. In it, repeated divergence from the stagnation equilibrium occurs in the presence of sequential sources of growth, but reversals can also happen at any time.
To achieve these goals, we carry out two fundamental tasks. One is to provide a thor-ough national accounting exercise regarding Portugal’s early modern economy. The other is to supply explanations for the proximate causes underlying both the process of Portugal’s eco-nomic growth, and its subsequent reversion into the nineteenth century.7
2. Data and analytic tools
In this section we discuss the data employed in this article to construct the macroeco-nomic variables required by our analysis. Our aim is to obtain long-term annual series for pop-ulation and occupational shares, land, wages, agricultural and manufacturing price indices, and land rents. These are then combined to generate a number of essential analytic tools such as real wages, GDP and GDP per capita, agricultural and manufacturing TFP, as well as rent-wage and land-labor ratios.8 The basic procedures followed are standard in the early modern macroeconomic literature.
2.1. Data
We use long-term annual series for the following variables: population, land, wages, ag-ricultural and manufacturing prices, and land rents.9 The set of prices that we use has been put together in accordance with the methodological criteria adopted in similar studies. They must be representative of the national economy and reflect the value of market transactions. They should also arise chiefly from the accounts of large and efficiently-run institutions which were capable of producing reliable, high-frequency information. In our case, given the small size of the country we restrict ourselves to Lisbon and its rural surroundings. We thus adopt the principle of the “national representativeness” of the data regarding the country’s principal city (Allen 2001).10 Prices have been normalized to correspond to metric units. We make sure they allow us to construct a consumption basket which is comparable to those used in parallel
6 A more recent version of this standard account is Broadberry et al. (2015)’s description of an early modern ‘little
divergence’ between the countries of Northern and Southern Europe; see also Fouquet and Broadberry (2015).
7 We do not discuss in detail matters related to human capital, economic geography, and political institutions. 8 A data file with all the variables we construct in this paper will be made available online in due course.
9 A major research project (PWR- Prices, wages and rents in Portugal, 1300-1910) supports our present study:
http://pwr-portugal.ics.ul.pt/. This is the source of all the price and wage data used here, as well as of a compan-ion paper (Reis 2016).
jects for other countries. Owing to a relative scarcity of data, we have had to interpolate a cer-tain portion of them, mostly in the sixteenth century.11
To represent the cost of a unit of the factor labor we have chosen the daily unskilled wage of male adult workers. This allows us to capture the value of the raw labor in a well iden-tified unit of services and avoid distortions caused by variation in the unideniden-tified presence of human capital in the labor stock.12 These wages refer always to employment in either agricul-ture or the building industry and to situations in which non-monetary complementary remu-nerations were absent.
As far as prices for the agricultural sector are concerned, we have selected those corre-sponding to the principal articles of consumption and production. Consumables include wheat and maize bread, meat, olive oil, wine, eggs and hens, all of which, in the literature of the early modern period, form part of the widely accepted standard consumption basket. From the pro-duction side, we take the prices of charcoal, linen cloth, soap and candles.
Land rents have attracted little attention from the economic historians of this period in Portugal. In fact, rents are important for the present narrative as indicators of the value of the services produced by land and as an indicator of its relative scarcity. At this time, most land in use was not directly cultivated by its lords. Possibly a little less than half of all agricultural land was rented out on terms of commercial tenancy, with leases typically running from three to ten years (Monteiro 2005). The remainder was held under long term or perpetual em-phyteutic contracts, whereby the lord received a fixed fee and the tenant enjoyed a de facto assignable right to the exclusive enjoyment of all the fruits of the land (Costa et al 2016; Fon-seca and Reis 2011).13 We assume that the rent of the first category of contracts provides a reliable indication of the market value of all agricultural land per hectare. Data for land rents are not abundant. We value them by means of an indicator based on the aggregate rent of a time-invariant set of thirty-two estates owned and regularly leased by a charitable institution in the southern region of Alentejo (Santos 2003). Since this only covers the years from 1595 to 1850, we fill in the rest of the sixteenth century from other comparable sources.14
Palma and Reis (2015) have constructed the first annual series for Portugal’s population during this period, using a combination of stocks from censuses and population counts, and flows from the parish registers of several dozens of parishes. The result is the gray line in Fig-ure 1. This estimation is inspired by the seminal work on England by Wrigley and Schofield (2010/1989) and Wrigley et al (1997), which offers a number of advantages over their exercise. We leave to that paper the details regarding the reconstruction of population, but we provide a summary in the online Appendix to the present paper.
Finally, we provide a measure of total agricultural land, a considerable challenge for the study of any economy during the early modern period. The solution generally employed in the literature assumes that, despite changes over the last few hundred years, the number of hec-tares in agrarian use has not changed much up to the present day. From this perspective, what matters is the potential resource base, and upgrades to quality or changes of usage are hence assigned to changes in technology. In the case of Britain, this has been defended on the grounds that practically all land had been put to use by 1066 (O’Rourke and Williamson 2005).
11 We show the percentage of the yearly variation of the principal data that is covered by our sources in Table A1
of the online Appendix.
12 Costa, Palma and Reis (2015) show that the skill premium was roughly constant over the early modern period. 13While the first of these arrangements was employed mostly for larger units of production, the latter
correspond-ed to small or minuscule farms.
The same rule of thumb has been adopted for Europe as a whole, from 1300 to 1800, by Allen (2003). We follow this approach for Portugal, where we suppose that by 1500 all utilizable land was under some form of usage. We thus assume the stock of land as equal to the area of “agri-cultural land” measured by the United Nations-Food and Agriculture Organization in the 1950s, namely 4.13 million hectares.15
2.2. Real wages
To obtain real wages for Portugal, we convert nominal wages by employing the proce-dure followed in Reis (2016) and originally outlined by Allen (2001). We use a CPI defined by the silver price of a basket with a composition of goods assumed to represent the consumption needs of a Strasbourg pre-modern ‘respectable’ working class family. We make several adapta-tions to this formula, as required by differences in preferences and geography, whilst taking care that the caloric and protein standards are not significantly altered. The most important of them is that dictated by the remarkable shift in bread consumption from wheat to maize (i.e. American corn) flour which occurred during the period of this study. This is taken into account by altering the annual grain content of the CPI in accordance with the information on produc-tion shares based on tithes (Oliveira 1990, 2002).16 Other changes to the original basket are the replacement of beer by wine, butter by olive oil, and cheese by hens. The resulting long term real wage for Portugal is shown in Figure 1.
2.3. GDP per capita
The early modern economic history literature has embraced the real wage as a valuable measure for international and inter-temporal assessments of living standards (Allen 2003, Pfister et al 2012). On the other hand, a real wage trend suggesting long run stagnation does not necessarily mean that this will in fact happen to overall income and welfare levels. In the well-studied English case, for instance, real wages conform to such a picture for the entire early modern period (Allen 2001, Clark 2007, 2010), yet this is not confirmed by output-side GDP estimates, which show substantial intensive growth (Broadberry et al 2015).
This points towards a recognition that GDP per capita should be preferred, as a meas-ure of overall well-being, to the real wage. In the literatmeas-ure, two ways have been employed for estimating the former variable in the case of premodern economies. One requires abundant production data, and has been employed in the cases of England/UK and the Netherlands (Broadberry et al 2015; Van Zanden and Van Leuween 2012). In countries like Portugal, how-ever, where output data is scarce, one has to rely on simpler demand-based methods as has been done in the cases of Spain, Italy, Sweden and Germany (Álvarez-Nogal and Prados de la Escosura 2013, Malanima 2011, Schön and Krantz 2012, Pfister 2011). They consist of two main stages. In the first, it is assumed, unrealistically, that all workers were employed the same number of days per year in every year considered. Álvarez-Nogal and Prados de la Escosura (2013), improve on this first step by calculating agricultural output on the basis that income was derived from not only labor but also land. In the present instance, we go further by using supply-side evidence in order to adjust the labor supply variable and thus correct the demand-side estimate for agricultural output. The second stage is to gauge the size of the
15 “Agricultural land” is defined as the sum of crop producing land, meadow land, pasture and rough grazing. In
pre-industrial times this would have included a sizeable portion of fallow land in crop rotation. The earliest avail-able contemporary evidence for Portugal comes in a calculation made in 1875 by the geographer Gerardo Pery, who assessed the total “productive area” - thus excluding forests - as being 4.34 million hectares (Fonseca 1996).
16 This procedure mitigates some of the traditional problems with PPPs (Deaton and Heston 2010, p. 12; Allen
2013). For a recent discussion on the merits of tithes as indicators of agricultural growth, see Álvarez-Nogal et al. (2016) and Reis (2016).
agricultural sector, either by retropolating it from statistical information pertaining to post-early modern urban industrial activity, or by assuming a productivity gap, which is the option we take here.
2.3.1. Demand-side estimates: agriculture
Portugal’s agricultural product over this period has been estimated by Reis (2016). Here we provide a short summary of the procedure, which we also improve upon. The first part of the exercise uses a demand-for-food function to obtain gross agricultural output, which is taken to be equal to food consumption (Wrigley 1985, Allen 2001) given the practical equiva-lence between them in the Portuguese case.17 For any given year, the agricultural product (𝑄
𝑎)
is given by the expression,
𝑄𝑎 = 𝑃𝛼𝐼𝛽𝑀𝜒𝑁
in which 𝑃 is the real price of agricultural products, 𝐼 is real income per capita, 𝑀 is the real price of other consumer goods and 𝑁 is total population. The coefficients 𝛼, 𝛽 and 𝜒 are, respectively, the own price, income and cross elasticities of demand. This function takes into account the impact on food consumption of fluctuations in real income, food prices and non-food prices, as well as their respective elasticities.
A fairly wide range of choices exists with regard to the selection of demand and income elasticities. In the absence of anything better, the literature has resorted to emulating the pre-sent day elasticities of less developed economies with traits presumed similar to those of early modern economies. The possibilities go from -0.4 to –0.7, for own-price elasticity, and from 0.3 to 0.6 for income elasticity. We have found the arguments advanced by Álvarez-Nogal and Prados de la Escosura (2013) convincing and have therefore opted here for the set they propose in which α = -0.4, β =0.3 and χ =0.1.
The principal difficulty with this model is how to quantify the real income variable. The best solution to date is that proposed by Álvarez-Nogal and Prados de la Escosura (2013, p. 9), which employs a weighted index of annual wages (0.75) and land rents (0.25). We use a more precise method, by summing yearly the actual current-price wages and rents derived from our primary sources, and building an index which we then deflate using a CPI.18
2.3.2. A labor supply adjustment
In order to reflect the true number of days worked per year we now apply a supply-side adjustment to the preceding estimate. There is evidence that working days per year increased over this period in Portugal, as they did elsewhere in Europe. The country experienced some-thing akin to an ‘industrious revolution’ in the countryside as a response to more-labor inten-sive agricultural methods required by the gradual introduction of maize and wine (Ribeiro 1986), and in response to the economic opportunities offered by the empire (Costa, Palma and Reis 2015). As a result, the growth of income was bound to be higher than that suggested by
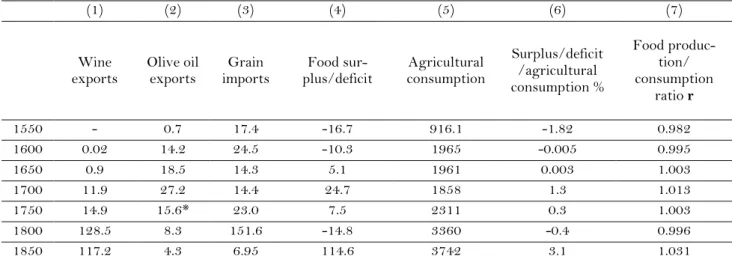
17 The online Appendix (table A2) shows the very small size of the differential between food imports and exports
and compares it to agricultural output. See Costa and Reis (2016).
18 The literature usually sets at 250 the number of days worked in a year. In a predominantly rural economy,
which is subject to pronounced seasonality, this may seem large, though less so for proto-industrial workers and perhaps not at all for workers in cities. For our baseline estimates, we prefer a weighted index of unskilled labor-ers earning the corresponding wage and working 120 days a year; skilled urban laborlabor-ers, who worked 250 days and earned skilled wages; and rural non-agricultural workers, who are presumed to have been employed 180 days a year and earned a rate equal to the mean of the unskilled and the skilled wages.
real wages calculated under the assumption of fixed labor supply per worker, using the nomi-nal day wage.
We propose the following novel solution to this problem. We begin by selecting two moments for which independent supply-side GDP estimates are available. These are conven-iently located at the two extremities of our period: 1515 (Godinho 1968-72) and 1850 (Reis 2000). For each of these points in time, we convert total output at current prices into tons of silver. The respective amounts can then be compared with the analogous amounts calculated from the demand side. Using an initial number of 168 days per worker (as in Álvarez-Nogal and Prados de la Escosura 2013), we find that for 1515 the ratio of GDP established from the demand side to that calculated from the output side is 1.09. The same exercise for 1850, how-ever, leads to a ratio of 1.47. We thus conclude that over this period the average days worked must have increased to 248, which is the number needed to conciliate the two GDP estimates, from the demand and the supply sides.19 To complete this adjustment, we split this extra labor effort into yearly variations over the entire period. We use as an indicator for this the share of maize in total grain production based on tithes received by the bishopric of Viseu from the six-teenth to the ninesix-teenth centuries (Oliveira 1990, 2002).20
2.3.3. Demand-side estimates: the non-agricultural sector
The second major step in estimating GDP is the quantification of the non-agricultural part of the economy. Both Malanima (2011) and Álvarez-Nogal and Prados de la Escosura (2013) have postulated a significantly stable relation between the urban share of the population and the size of the secondary and tertiary sectors together. The former has extrapolated this link all the way back to 1300 using the coefficients of a linear regression covering the years 1861-1936. In it, non-agricultural output was the dependent variable and aggregate trade and industry served as the covariate. The latter simply used change over time in the country’s “ad-justed” urbanization rate to “proxy those in non-agricultural output per capita” (2013, p. 14).
Both approaches have disadvantages, the principal one being that focusing on urban production alone entails ignoring the contribution of proto-industry to non-agricultural pro-duction. Another is that they overlook the more than likely rise in productive efficiency which arose in parts of the economy during the preindustrial era. To surmount them, we resort to the procedure proposed by Pfister et al (2012) for Germany by assuming a constant ratio between the share of agriculture in total output and its share of employment. In other words, we main-tain that the inter-sectoral productivity gap (𝑝) between agriculture and total output is time-invariant over the period considered.21 The expression for GDP at any given year 𝑡 is then,
𝐺𝐷𝑃𝑡 = 𝑄𝑎,𝑡/(𝑝 × 𝐿𝑎,𝑡
𝐿𝑡 )
19 The corresponding increase, assuming proportionality, for each labor type is as follows: 120 to 177 for
agricul-tural workers, and 180 to 265 days for semi-skilled laborers. For urban skilled laborers we have truncated the increase at 320 days (from an initial level of 250). Part of the increment may be due to a combination of an in-crease in labor supply at both the intensive level (the same cohorts of people work more days) and at the extensive level (more people from the same cohorts substitute leisure for agricultural production or enter the rural skilled or urban labor markets). In the online Appendix (Figure A1) we report the non-adjusted estimates, which also show intensive growth, though slightly weaker.
20 The first reliable observation corresponds to just over 20% in 1701. We hence assume a level of 0.1% in 1600,
and interpolate linearly until 1701. The resulting values closely match a few partial observations we have for the seventeenth century: for instance, under our procedure we assume about 13% for 1665, while the true value was around 15% (Oliveira 1990). This data is discussed in more detail in section 3.1.
21 In the online Appendix, we offer an additional discussion of the intersectoral productivity gap and offer a
in which 𝑄𝑎,𝑡 is agricultural output and 𝐿𝑎,𝑡 and 𝐿𝑡 are agricultural and total labor re-spectively, all of them at time 𝑡, and 𝑝 is the constant productivity gap. Since we possess esti-mates of agricultural output (Reis 2016) and of major sectoral shares (discussed next), all that is needed to derive GDP is to determine this gap at a point in time for which this is possible and then extrapolate the desired result back as far as needed. We resort to an estimate for Por-tugal of 𝑝 from the mid-nineteenth century (1850)22 which is of a credible order of magnitude. It is lower than those for Italy (Malanima 2011) and Germany (Pfister 2011) and similar to the value derived for Spain (Álvarez-Nogal and Prados de la Escosura 2007).23 The expression for obtaining the value of 𝑝 is,
𝑝1850= 𝑄𝑎,1850/𝑄𝑛𝑎,1850
𝐿𝑎,1850/𝐿𝑛𝑎,1850
where 𝑄𝑎,1850 is agricultural output, 𝑄𝑛𝑎,1850 is non-agricultural output and 𝐿𝑎,1850 and
𝐿𝑛𝑎,1850 are, respectively, the total labor of these two sectors, at the year 1850. The value we
adopt for Portugal is 0.7, the mean of those obtained from data found, respectively, in Lains (2003) and Reis (2005).
2.3.4. Occupational distribution and structural change
We now briefly discuss the characteristics of Portugal’s occupational distribution and structural change over this period.24 The first step is to estimate urban population, and the main economic activities in which the population was engaged. We split the population simply between the agricultural and the agricultural sectors. Evidently, the rural and urban non-agricultural components both encompass manufacturing, transport, trade and administrative activities wherever carried out, but because of lack of information, we are unable to consider these distinctions. For assessing the urban part of the population, we rely on the well-known Bairoch (1986) dataset, but have interpolated the “missing” inhabitants at the level observed in the count of the previous benchmark, as long as this was not less than 5,000. As mentioned, we endorse here the common assumption that the urban population was engaged entirely in non-agricultural activity. The difficulty lies in how to carry out the partition of the rural population into these two categories. For 1500, we accept that in Portugal, like in most of the rest of rural Europe up to the early-sixteenth century, agriculture occupied some 80 percent of the popula-tion, with the remaining 20 percent corresponding to non-agricultural occupations (Wrigley 1985, Allen 2000). At the other end of the continuum, we have reliable data from Reis (2005) for 1800 and 1850, and, for 1750, from Sá (2005). For 1700, we use unpublished material con-cerning personal tax rolls from various regions. We derive the remaining benchmarks – 1550, 1600 and 1650 – from the shares employed by Álvarez-Nogal and Prados de la Escosura (2007) for Spain in the same years.25 The results are displayed in Figure 2.
22 Notice that this year is prior to the outset of major structural changes in Portugal; see Lains (2003).
23 For Spain, the value is 0.66, and for Italy and Germany it is 0.81, plausibly suggesting a higher level of
econom-ic development in the last two countries.
24 Here we focus on the main procedures and results. Details are given in the online Appendix.
Figure 2. Occupational shares over time (50-year benchmarks). Sources: Bairoch (1988), Álvarez-Nogal and Prados dela Escosura (2007); Castro Marim and Tavira-Cacela’s archival data; Sá (2005) and Reis (2005). See text and the online Appendix for further details.
2.3.5. Sectoral total factor productivity
With regard to total factor productivity in agriculture, lack of suitable data precludes our obtaining an index by the direct method. Instead, we use the “dual” approach (Antràs and Voth 2003). Input prices are represented by the weighted geometric mean of unskilled wages and rents, using the weights - respectively 65 and 35% -- employed for early modern Spain by Ro-sés et al. (2007). Output prices are given by the CPI for agriculture. The result of dividing the former by the latter is shown in Figure 3, alongside an HP-filtered trend component estimate, using a smoothing parameter of 6.25, as recommended for annual data by Ravn and Uhlig (2002).
Analogous difficulties are met in the case of manufacturing. We continue to make use of the “dual” approach but given even greater data restrictions, we adopt as the basis of the calcula-tion a single manufacture, a cheap (and therefore not imported) variety of linen cloth, one of the principal textiles produced during the period in Portugal. The sectoral TFP index is ob-tained by calculating the simple geometric mean of the price of the raw material (flax) and the skilled wage rate, and dividing this by a cloth price series. The raw and filtered results are dis-played in Figures 3 and 4.
3. Discussion
Thanks to a high land-labor ratio with roots in the Reconquista and the Black Death, around 1500 Portugal was able to provide its population with a comparatively generous living standard. Over the following three and a half centuries, however, this level of material well-being fell by almost twenty percent. This arose from a combination of extended phases of in-tensive growth (1550-1660; 1700-1750) with similarly lengthy periods of reversal or merely extensive growth (1500-1550; 1660-1700; 1750-1850). At the same time, this evidence reveals significant signs that this economy was far from dormant. To account for this pattern, we study here the forces which propelled it during such remarkably long positive intervals and why it was that these drivers eventually lost their momentum.
Figure 3. Agricultural total factor productivity, 1500-1850. Sources: see text and Reis (2016)
Figure 4. Manufacturing total factor productivity, 1500-1850. Sources: see text.
3.1. A stagnant economy?
The notion of persistent Early Modern stagnation is related to that of the structural in-ability of these economies to generate technical and organizational change on an appreciable scale. In order that some growth should happen at the intensive margin, three conditions need-ed to be met. One was that innovation would occur and influence sizable sectors of the econo-my. Another is that it would have to translate into palpable productivity gains. The third is that this impetus would have to be sustained over a relevant time span. Recent research on pre-industrial Britain and Holland demonstrates that they possessed these attributes and thus con-tradict the view of Malthusian historians. The relative dynamism of Portugal’s performance over two centuries suggests that it may have been yet another country which did not fit the condition of economic torpor depicted by the standard literature.
As Figure 1 documents, the sixteenth century did not witness any overall progress. But in the following century and a half, a completely different picture is visible. Three forces were
mainly responsible for changing this country’s economy and instilling it with a clear impulse to grow. One was the spread from around sixteen hundred of a new irrigated, highly productive crop – Indian or American maize - which displaced traditional foodstuffs and established en-tirely new production and consumption patterns. Another was the development, from the late-seventeenth century, of a highly commercialized and competitive Port wine sector which estab-lished a remarkable export vocation focused on the flourishing British market. The third was the establishment throughout the whole of the early modern period of an overseas empire, which linked the mother country, through a complex web of sea lanes and mercantilist ties, to a multiplicity of profitable settlements and trading posts (Costa, Palma and Reis 2015).26 All of them were gradual developments which invoked a capacity for technical and organizational change, as well as for major investment in human, physical and financial capital. All of them had significant long-run macroeconomic implications.27
3.2. Portugal and the canonical Malthusian analysis
The canonical Malthusian model suggests that in premodern economies incomes always converge to a zero per capita growth steady state (e.g. Galor 2005, Clark 2007). A quick glance at GDP per capita or the real wage (Figure 1) shows that in Portugal over the very long run, the evidence appears to be consistent with (i.e. observationally equivalent to) this basic prediction of the Malthusian model. After about three hundred years, income did converge to a stagnant, “subsistence” level. Two issues prevent an immediate acceptance of the Malthusian picture, however. First, the simple observation of stagnation in itself does not prove whether the mech-anism pulling income back to a steady state, following a short run deviation, is the equilibrium (both agricultural and labor) market response to Malthusian positive and preventive checks on mortality and fertility.28 Second, as observed in the introduction, there was indeed at least a long period of significant deviation from the predictions of the standard Malthusian model.
In order to dig deeper into the determinants of the long run evolution of income, we need to take a look at co-variation with a host of other factors, in addition to population alone. In some models, the land-labor ratio and the productivity of the agricultural sector prices are used as exogenous variables in modelling income (O’Rourke and Williamson 2005, Rosés et al 2007). Even when explicitly recognizing that the endogenous fertility decisions of families mean there is a (lagged) negative feedback between income and the land-labor ratio, no single model or identification strategy is accepted in the literature as the best way to test the adequa-cy of the Malthusian model to any given period or region. Crafts and Mills (2009), Nicolini (2007), Klemp (2011) and Chiarini (2010) have all used different models and identification as-sumptions.
In our approach, we estimate parameters which represent reduced-form statistical asso-ciations, but we do not attribute a causal interpretation to the results. The exercise is neverthe-less meaningful because it allows us to account simply for the periods in which some of the predictions of the ‘classic’ Malthusian model applies. We use the model of O’Rourke and Wil-liamson (2005) and Rosés et al (2007), but we make the following changes. First, we use GDP per capita, rather than real wages, as the dependent variable.29 Second, we allow for the possi-bility of autocorrelation and other non-spherical disturbances by using the Newey-West
26 In the online Appendix, we present an extended discussion of Portuguese agriculture during this period, and we
also present a review of the recent empire literature.
27 For an up-to-date overview of this period’s economic history, see Costa et al (2016). 28 It is, a priori, possible that the forces at work are of a separate institutional or political type.
29 All data (in natural logs) have been tested for stationarity and structural breaks, which can be rejected at the
mator.30 Finally, given the likely possibility that during the eighteenth century real per capita gold imports significantly affected incomes, we include them as a control (Morineau 1985). We start in 1530 because this is the date from which we have variation in population at the annual level (Palma and Reis 2015).
The results are shown in Table 2. Most signs, magnitudes, and significance levels come out as expected, though at first sight the sign of the marginal effect of the land-population ratio seems odd; for the full sample, a 10% increase in the land-population ratio is associated with an approximate 2% decline in the per capita GDP, all else constant, an effect which is statistically significant (Column 1). We can see, however, by comparing columns (3) and (4) with columns (5) and (6), that this effect is a result of the forces of the 1530-1755 period.31 So what is clear from this exercise is that during the period of two hundred years from the mid-sixteenth cen-tury economic growth was sufficient to keep the economy rising in per capita terms, despite contemporaneous population growth over much of the same period.32 Hence, the Portuguese economy cannot, over this period, be characterized as Malthusian. At the same time, the period after 1755 does roughly correspond to a situation observationally equivalent to the predictions of a canonical Malthusian model.
30 Standard errors are Newey-West corrected. Details are given in the online Appendix.
31 In fact, after the mid-eighteenth century the expected conditional sign does turn up – but even for this period, it
is only significant as long as the year trend is not included: compare columns (5) and (6). This could be because of the smaller sample size for this period (95 observations only), or the actual absence of a conditional statistical relationship for this period, or to the problems of identification which the next paragraphs address.
32 Growing incomes contributed themselves to this demographic outcome, both in the form of positive checks (less
people died) and preventive ones (as families adjusted their fertility levels to the new income, more people were born, i.e. they could afford to have more children in a context where the latter were “normal goods”).
Dependent variable: Ln
of pcGDP (1) (2) (3) (4) (5) (6)
Estimator OLS OLS OLS OLS OLS OLS
Period Full sample Full sample 1530-1755 1530-1755 1756-1850 1756-1850 Constant 2.168*** (.6667) 1.284*** (.281) 2.531*** (.3483) 1.099*** (1.015) 1.161*** (.3055) (3.711) 1.054 Ln of land-population ratio -.1917*** (.0684) -.1029*** (.0250) -.2899*** (.0545) -.1697* (.0963) .1531*** (.0576) (.2688) .1608 Ln of Agricultural TFP .0656*** (.0189) - .1100*** (.0251) 1166*** (.0234) .1027*** (.0256) .1030*** (.0307) Ln of Manufacturing TFP -.0306*** (.0108) -.033*** (.0102) (.0147) -.0143 (.0139) -.010 -.0252* (.0149) -.0254* (.0138) Linear time trend (.0002) -.0002 - - .0005 .0004 - (.0013) .00004 Ln of gold imports
from Brazil (at con-stant prices) .0021** (.0008) .0028** (.0011) (.0018) -.0023 (.0023) -.004 (.0022) -.0005 (.0025) -.0005 Ln of per capita GDP (t-1) .7909*** (.0412) - .6452*** (.0629) .6293*** (.065) .5983*** (.0781) .5996*** (.0887) R2 or pseudo R2 0.8888 0.8882 0.8939 0.8951 0.8388 0.8388 Number of observa-tions 320 320 225 225 95 95
Table 2. Explaining Portuguese per capita GDP 1530-1850. In columns (1)-(4) the Newey-West HAC standard errors allow autocorrelation up to 5 lags.
3.3. An early modern little divergence?
Portugal’s economy is held to have been comparatively backward during the early mod-ern period (Allen 2005, van Zanden 2009). By contrast, we have shown that the Portuguese economy experienced two centuries of per capita growth between 1550 and 1755: 0.37% a year.33 Portugal’s rate hence compares favorably with that of the Netherlands 0.41% per year during 1500-1650 and that for England/Britain, of 0.33% for 1600-1750, their respective gold-en ages of early modern growth.
We now shift the discussion from volume-based measures to a comparison of income levels. There are two alternative benchmarks from which past income levels can be calculated. The standard option (Table 3) is to use Geary-Khamis 1990 international dollars (henceforth referred to as the GK method)34, while the alternative is the indirect method of Prados de la Escosura (2000).
Table 3. Output per capita in Europe in “international” GK dollars of 1990, extrapolating backwards from
the 1850 benchmark in Maddison (2003). Data sources for the growth rates: For England/GB, Broadberry et al (2015); for Holland, van Zanden and van Leuween (2012); for Germany, Pfister (2011); for France, Ál-varez-Nogal and Prados de la Escosura (2013, p. 23); for North and Central Italy, Malanima (2011); for Spain, Álvarez-Nogal and Prados de la Escosura (2013); for Sweden, Schön and Krantz (2012).Note that the geographic boundaries for three of the 1850 benchmarks – GB, Netherlands, and Italy – do not precisely match those of the growth rates.
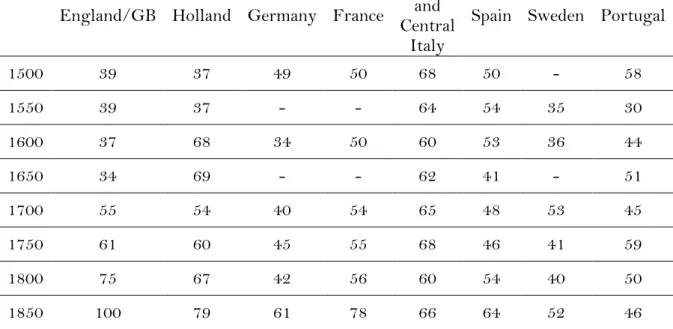
While standard, the GK method has the disadvantage of relying on more remote PPPs than those used by Prados de la Escosura. Consequently, the well-known index number prob-lems associated with this kind of exercise (Deaton and Heston 2010, Allen 2013) will be more strongly felt when using the former method. This is especially true when taking into consider-ation the fact that the nineteenth century was a period of fast structural change and relative price movements for many European countries. For this reason, it is worthwhile to also show the results of the latter method. These are in Table 4.35 One outcome may be surprising to some: in 1750, Portugal’s per capita GDP was higher than that of France, Spain, Germany and Sweden and at around the same level as Great Britain and the Netherlands. Portugal was only poorer than Italy.
33 This annualized growth rate was calculated using the familiar compound growth formula.
34 In the online Appendix, we also compare our new GK figures for Portugal with those for other countries
ac-cording to Maddison (2010).
35 See Fouquet and Broadberry (2015, p. 230) for a graph using the GK method.
England/GB Holland Germany France
North and Central
Italy
Spain Sweden (Maddison Portugal 2003) Portugal (this study) 1500 1068 1454 1146 - 1553 846 - 606 1134 1550 1058 1798 - - - - (y.1560) 995 - 578 1600 1082 2662 806 - 1363 892 761 740 933 1650 925 2691 948 - 1398 687 966 - 1059 1700 1513 2105 939 - 1476 814 1340 819 898 1750 1695 2355 1050 - 1533 783 973 - 1216 1800 2097 2609 986 - 1363 916 857 (y. 1820) 923 1002 1850 2330 2355 1428 1597 1481 1079 1076 923 923
England/GB Holland Germany France
North and Central
Italy
Spain Sweden Portugal
1500 39 37 49 50 68 50 - 58 1550 39 37 - - 64 54 35 30 1600 37 68 34 50 60 53 36 44 1650 34 69 - - 62 41 - 51 1700 55 54 40 54 65 48 53 45 1750 61 60 45 55 68 46 41 59 1800 75 67 42 56 60 54 40 50 1850 100 79 61 78 66 64 52 46
Table 4. Output per capita in Europe (GB 1850=100), using the method of Prados de la Escosura
(2000, p. 24). Italy’s 1860 level was assumed to be that of 1850, following Álvarez-Nogal and Prados de la Escosura (2013, p. 23). Data sources: the same as in Table 3.
Portugal’s favorable circumstances by the mid-eighteenth century, which were largely the result of remarkable growth in the previous half century (but also dated back to the sixteen hundreds) were not to last, however. In the very long run, the economy conformed to the pre-dictions of the Malthusian model. Despite variation in response to shocks, income converted back to what could be interpreted as a long-term “subsistence” level. Nonetheless, while the forces of convergence to such a steady state did include endogenous fertility and mortality re-sponses in the spirit of Malthus, it is equally possible that negative effects of a political econo-my or institutional nature were also present.
3.4. The great reversal (1750s-1850)
The evolution of the Portuguese economy during 1500-1850 is neither a story of re-gression, nor one of a monotonic decline. If anything and only if viewed over the very long run, it is one of stagnation. It is best described perhaps as a set of two long spells of growth (1550s-1650s and 1700-1750s) followed, after 1750, by a century representing a great reversal in both absolute and comparative terms (Figure 1 and Tables 3 and 4).
The 1750-1850 setback is of interest for three reasons. One is that it caused a consider-able and sustained erosion of living standards at a cumulative rate of 0.26 per cent annually. The second is that such an inversion presupposes the occurrence of significant changes in the dynamic elements that caused the country’s upswing during the preceding half-century. They obviously need to be analyzed as corroboration for our hypotheses concerning earlier surges. The third is that their study can contribute to furthering an emerging shift in research on long term pre-industrial growth. As Broadberry (2016, p. 13) has put it recently, ‘one way to think about Europe’s Little Divergence, and also the Great Divergence, is therefore not so much the beginnings of growth but rather the weakening and ending of growth reversals’.
What explains Portugal’s great reversal from the 1750s?36 A central aspect is clearly the exhaustion of the three dynamic forces for growth of the preceding surge, which now ceased to generate sustained positive macroeconomic effects. Innovation had brought them into existence but could not ensure their continuing success in the face of exogenously imposed adversity. In the case of maize, a natural resource barrier stifled its progress of more than a hundred years. In that of port wine, practically one market only mattered – Britain. Yet, when the policies that regulated it became adverse to Portuguese exports, there was nothing that producers or the state could do to overcome this. Regarding the colonies and their mercantilist benefits, these could only be maintained as long as it was in Britain’s interest to protect them from predator states. In 1808, this came to an end when, as a result of the convulsions of the Napoleonic wars, Portugal was forced, in order to survive, to open its ports to ‘friendly na-tions’.
A second dimension is that population meanwhile started to grow at increasing rates, which represents a substantial alteration relative to the first half of the eighteenth century. It also brings to light the role played by low-pressure demography in achieving the economic success of the earlier sub-period (Table 5). Two causes could have been responsible for the post-1750s population upsurge. One is that it was a reaction to the relatively slow demograph-ic expansion in 1700-1750, a period much affected by gold-rush induced migration to Brazil. The other is the high per capita income at mid-century, and its steady but only gradual erosion to levels which, nevertheless, for decades stayed above Malthusian subsistence thresholds.
% GDP % Population change % GDP per capita
1700-1850 0.34 0.32 0.02
1700-1755 0.77 0.16 0.61
1755-1800 -0.19 0.31 -0.5
1800-1850 0.33 0.49 -.016
Table 5. Rates of annual change for population, GDP, and per capita GDP. Sources: see
text
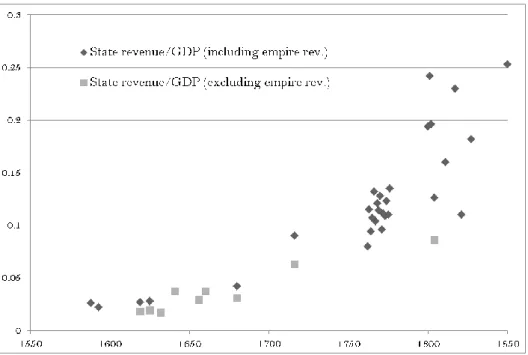
One proximate factor which we might have expected to become a barrier to develop-ment does not seem to play an important role. According to the weak state hypothesis, low levels of fiscal extraction lead to backwardness (Besley and Persson 2011, Dincecco and Katz 2014). While this argument carries weight in explaining the divergence between Western Eu-rope and other parts of the world, it cannot explain the divergence within Western EuEu-rope itself. As Figure 5 and Table 6 show, the levels of fiscal capacity within the latter region were roughly similar, including for Portugal.37 On the other hand, even at its peak, when Portugal was comparatively rich, it did not succeed in achieving high levels of structural change (Figure 2) or industrial development.38 The long-term roots of Portugal’s backwardness may lie here.39
36 In this discussion, we focus on proximate aspects and leave out fundamental causes which relate to culture,
institutions, economic geography, and human capital. But it is certainly true, for example, that levels of human capital were and remained low by northern European standards (Reis 2005b, p. 202).
37 The Portuguese fiscal system was also, from an early stage, remarkably modern; a 10% income tax (décima) was
authorized by parliament in 1641, and kept into the nineteenth century (Costa et al 2016, pp. 116-119).
38 See the online Appendix for details about occupational change over this period, and Costa et al (2016) for a
discussion of Portugal’s industry over this period.
39 Of course, lack of structural change or industrial development could be symptoms as well as causes. In the
online Appendix, we present a more extended discussion of the proximate causes for Portuguese decline over the 1750-1850 period.
Figure 5. Ratio of state revenue in current prices to nominal GDP. Revenues from the following
sources: For 1607, Falcão (1859); for 1619, Oliveira (1620); for 1625, Hespanha (1994, pp. 124-5), for 1680, Dias (1985); for 1716 and 1804, Macedo (1982, p. 209), for 1763, Tomaz (1988, pp.355-388) and for 1800, 1801, 1802, 1811, 1817, 1821,1827, Silveira, (1987, pp. 505-529).
China Ottoman empire Russia Lithuania Poland- Austria Prussia France Venice Spain England Republic Dutch Portugal
1500-1549 - - - 0.8 - - 2.6 10.4 3.0 1.5 - - 1550-1599 - 1.7 - 0.4 - - 3.2 9.5 4.0 2.7 - - 1600-49 - 1.4 - 0.5 - - 3.0 7.5 7.2 2.6 12.0 7.1 1650-99 - 1.7 - 1.3 2.6 2.0 8.0 10.6 7.7 4.2 13.6 5.6 1700-49 2.3 2.6 4.4 0.6 6.3 6.6 6.7 12.7 4.6 8.9 24.1 8.0 1750-99 1.3 2.0 7.6 1.7 11.3 14.1 11.4 13.2 10.0 12.6 22.8 15.6 1800-49 1.2 5.0 6.2 - 10.2 - 14.3 - 8.6 13.5 - 9.1
Table 6. Size of Leviathan: Per capita government revenue in day’s wages for urban, unskilled workers.
Sources: For China, Brandt et al (2014, p. 69). For all other countries except Portugal, Karaman and Pamuk (2010), with 1500-1799 data presented in 50-year rather than 10-year intervals, following Brandt et al (2014). We have updated Russia, and also added 1800-49 values using data kindly provided by Kivanç Karaman. For Portugal: our calculation, using for 1607 Falcão (1859), for 1619 Oliveira (1620), for 1625 Hespanha (1994), for 1680 Dias (1985), for 1716 and 198, Macedo (1982) for 1763, Tomaz (1988), and for 1800, 1801, 1802, 1811, 1817, 1821,1827, Silveira (1987).
4. Conclusion
Thomas and McCloskey (1981, p.102) have described Portugal, along with Spain, as “giants” of the sixteenth century, especially in comparison with Britain, the “inconsiderable little island of the sixteenth century, a mere dwarf”. In turn, Bairoch (1976) considered Portu-gal one of Europe’s five richest countries as late as 1800, and Lisbon one of Europe’s four most populous cities (after Naples, Paris and London). How do these statements stand up in compar-ison with the evidence we have gathered here? The discussion so far allows us to draw three conclusions:
1. During much of the early modern period Portugal was comparatively prosperous. While a loss of dynamism is already noticeable from the second half of the eighteenth century, as late as 1750 income levels in Portugal may have been as high as those in Britain and Holland, and higher than in France, Spain, Germany and Sweden.
2. At least until the mid-eighteenth century, Portugal was not Malthusian, in the sense that per capita income did not have a tendency to converge towards a stag-nation steady-state. This is confirmed by the 200-year contemporary rise in per capita income and population. Much growth was of an extensive nature, but nevertheless Mal-thusian forces were not sufficient to cancel Smithian intensive growth opportunities (Mokyr and Voth 2008).
3. Portugal provides support for an early modern European “little diver-gence”. The timing of this divergence varies according to the method of comparison in use and the country of reference. Compared with England/GB, such a divergence did happen over the early modern period, but it dates from either the second half of the sev-enteenth century (as in Table 3) or from a century later (as in Table 4).40
4. After the mid-eighteenth century Portugal entered a period of persistent decline which had as proximate causes the increase in population combined with the exhaustion of the previously available engines of economic growth without their substi-tution by new sources. Whether there was also an instisubsti-tutional element in this decline and how it may be related to the previous resource boom and episode of “extractive growth” (Acemoglu and Robinson 2012) remains unclear at the moment. What is cer-tain is that the growth which had taken place until then was accompanied by limited structural change.
In the spirit of Broadberry et al (2015) or van Zanden and Leeuwen (2012), who focus on proximate rather than fundamental causes of growth, our goal in this paper has been to provide a factual description of Portugal’s macroeconomic history during this period. We have offered an account of the main proximate factors of the growth and decline of Portugal’s econ-omy from the early sixteenth to the mid-nineteenth century. This enables us to add Portugal to the pool of existing evidence on GDP, as well as factor and commodity prices and allows us to round off the usual picture for early modern Europe with the inclusion of a non-core econo-my in this context.
Although Portugal enjoyed comparatively high incomes well into the early modern pe-riod, its structural modernization was comparatively slow.As the engines of growth ran out of steam after the 1750s, a reversal took place which, in due time, would leave Portugal as one of the poorest countries in Europe.
References
Acemoglu, D. and J. Robinson (2012). Why Nations Fail: The Origins of Power, Prosperity
and Poverty. New York: Profile Books.
Allen, Robert C. (2000). Economic structure and agricultural productivity in Europe, 1300-1800. European Review of Economic History 4: 1-25.
Allen, Robert C. (2001). The Great Divergence in European Wages and Prices from the Middle Ages to the First World War. Explorations in Economic History, 38, 411-447.
Allen, Robert C. (2003). Progress and Poverty in Early Modern Europe. Economic
His-tory Review 3, 403-443.
Allen, Robert C. (2005). Real Wages in Europe and Asia: A First Look at the Long-term Patterns. In: Living Standards in the Past. New Perspectives on Well-Being in Asia and
Eu-rope, eds. Allen, Robert C., Bengtsson, Tommy and Martin Dribe. Oxford: Oxford University
Press.
Allen, R. (2013). Poverty Lines in History, Theory, and Current International Practice. Working paper, Department of Economics, University of Oxford
Álvarez-Nogal, Carlos and Leandro Prados de la Escosura (2007). The decline of Spain (1500-1850): Conjectural estimates. European Review of Economic History 11, 319-366.
Álvarez-Nogal, Carlos and Leandro Prados de la Escosura (2013). The rise and fall of Spain (1270–1850). The Economic History Review 66 (1): 1–37.
Álvarez-Nogal, Carlos, Prados de la Escosura, Leandro and Carlos Santiago-Caballero (2016). Spanish agriculture in the little divergence. European Review of Economic History. Forth-coming.
Antràs, Pol and Voth, Joachim (2003). Factor prices and productivity growth during the British industrial revolution. Explorations in Economic History 40, 52-77.
Bairoch, P. (1976). Europe’s Gross National Product: 1800-1975. Journal of European
Economic History 5, 273-340.
Bairoch, P., Batou, J. and P. Chèvre (1988). La Population des Villes Européennes,
800-1850. Geneva: Librairie Droz.
Besley, T., and Persson, T. (2011). Pillars of prosperity: The political economics of
develop-ment clusters. Princeton University Press.
Broadberry, S. (2016). When and why did the great divergence begin? Unpublished
man-uscript
Broadberry, S., Campbell, B., Klein, A., Overton, M. and B. van Leeuwen (2015). British
Chiarini, Bruno, (2010). Was Malthus right? The relationship between population and real wages in Italian history, 1320 to 1870. Explorations in Economic History 4, 460-475.
Costa, L., Lains, P. and S. Miranda (2016). An Economic History of Portugal, 1143-2010. Cambridge: Cambridge University Press.
Costa, Leonor, Palma, Nuno and Jaime Reis (2015). The great escape? The contribution of the Empire to Portugal’s economic growth, 1500-1800. European Review of Economic History 19, 1-22.
Costa, Leonor and Jaime Reis (2016). The chronic food deficit of early modern Portu-gal: Curse or myth? Working Papers of
GHES
, No 2016/58.Clark, Gregory (2007). A Farewell to Alms. A Brief Economic History of the World. Prince-ton University Press.
Clark, G. (2010). The macroeconomic aggregates for England, 1209-2008. Research in Economic History, 27(1), 51-140.
Crafts, Nicholas and Mills, Terence (2009). From Malthus to Solow: how did the Mal-thusian economy really evolve? Journal of Macroeconomics 31, 68-93.
Deaton, A. and A. Heston (2010). Understanding PPPs and PPP-based National Ac-counts. American Economic Journal: Macroeconomics 2, 1-35.
Dincecco, M., and Katz, G. (2014). State Capacity and Long-run Economic Perfor-mance. The Economic Journal 126, pp. 189-218.
Edvinsson, Rodney (2013a). New annual estimates of Swedish GDP, 1800–2010,
Eco-nomic History Review, 66, 1101-1126.
Edvinsson, Rodney (2013b). Swedish GDP 1620-1800: stagnation or growth?,
Cliomet-rica, 7, 37-60.
Falcão, Figueiredo (1859). Livro em que se Contem toda a Fazenda e Real Património dos
Reinos de Portugal, India e Ilhas Adjacentes (Lisboa: Imprensa Nacional).
Fonseca, Helder Adegar (1996). O Alentejo no Século XIX: Economia e Atitudes Económicas. Lisboa: Imprensa Nacional – Casa da Moeda.
Fonseca, Helder and Jaime Reis (2011). The limits of agricultural growth in a fragile eco-system: Total factor productivity in Alentejo, 1750-1850. In: Olsson, M. and P. Svensson (eds.) Growth and Stagnation in European Historical Agriculture. Turnhout: Brepols, 37-66.
Fouquet, R., and Broadberry, S. (2015). Seven centuries of European economic growth and decline. Journal of Economic Perspectives, 29 (4).
Galor, O. (2005). From stagnation to growth: Unified growth theory. In: Philippe Agh-ion and Steven N. Durlauf Eds). Handbook of Economic Growth. Amsterdam: Elsevier 1, 171-293.
Godinho, Vitorino Magalhães (1968-1972). Ensaios. Lisboa: Sá da Costa, 4 vols.
Grafe, R. (2015). Economic and Social Trends. In: The Oxford Handbook of Early
Mod-ern European History, 1350-1750: Volume I: Peoples and Places. Ed. Hamish Scott. Oxford: Oxford
University Press, 269-294.
Hespanha, António (1994) As Vésperas do Leviathan. Instituições e Poder Político: Portugal -
Séc.XVII. Coimbra: Almedina.
Klemp, Marcus (2011). Prices, wages and fertility in pre-industrial England. Cliometrica 6, 63-77.
Lains, Pedro (2003). New wine in old bottles: Output and productivity trends in Portu-guese agriculture, 1850-1950”. European Review of Economic History 7, 43-72.
Macedo, J. Borges (1982). Problemas da História da Indústria Portuguesa no Século XVIII. Lisboa: Querco.
Maddison, Angus (2003). The World Economy: Historical Statistics. OECD
Maddison, Angus (2010). Statistics on world population, GDP and per capita GDP, 1-2008 AD. Groningen Growth and Development Centre. Accessed 9 of September 2016 from:
http://www.ggdc.net/maddison/oriindex.htm
Malanima, Paolo (2011). The long decline of a leading economy: GDP in central and northern Italy, 1300-1913. European Review of Economic History 15, 169-219.
Malanima, Paolo (2013). When did England overtake Italy? Medieval and early modern divergence in prices and wages. European Review of Economic History 1, 45-70.
Mokyr, Joel and Hans-Joachim Voth (2008). Understanding growth in Europe, 1700-1870: Theory and evidence. In: Stephen Broadberry and Kevin H. O'Rourke (eds). The
Cam-bridge Economic History of Modern Europe. CamCam-bridge: CamCam-bridge University Press. Vol. 1,
7-42.
Monteiro, Nuno (2005). A ocupação da terra. In Lains, Pedro and Álvaro Silva (eds).
História Económica de Portugal (Lisboa: ICS), vol. I, 67-92.
Morineau, M. (1985). Incroyables Gazettes et Fabuleux Métaux: Les Retours des Trèsors
Américains d’Après les Gazettes Hollandaises (XVI-XVII Siècles). Cambridge: Cambridge
Universi-ty Press.
Nicolini, E. (2007). Was Malthus right? A VAR analysis of economic and demographic interactions in pre-industrial England. European Review of Economic History 11, 99-121
O’Rourke, Kevin H. and Williamson, Jeffrey G. (2005). From Malthus to Ohlin: Trade, industrialisation and distribution since 1500. Journal of Economic Growth 10, 5-34.
Oliveira, João (1990). A Produção Agrícola de Viseu entre 1550 e 1700. Viseu: Câmara Mu-nicipal de Viseu.
Oliveira, Nicolau (1620). Tratado das Grandezas de Lisboa. Lisboa: Jorge Rodriguez. Palma, Nuno and Jaime Reis (2015). Reconstruction of regional and national population estimates using intermittent census-type data: the case of Portugal, 1527-1864. Unpublished
manuscript.
Pfister, Ulrich (2011). Economic growth in Germany, 1500–1850. Unpublished manu-script. Presented at the “Quantifying long run economic development” conference, University of Warwick in Venice.
Pfister, Ulrich, Riedel, Jana and Martin Uebele (2012). Real wages and the origins of modern economic growth in Germany, 16th to 19th centuries. EHES Working Papers in Eco-nomic History, Nº 17.
Prados de la Escosura, Leandro (2000). International comparisons of real product, 1820-1990: An alternative data set. Explorations in Economic History 37, 1-41.
Ravn, Morten and Harald Uhlig, (2002). On adjusting the Hodrick–Prescott filter for the frequency of observations. The Review of Economics and Statistics 84, 371–375.
Reis, Jaime (2000). How poor was the European periphery before 1850? The Mediter-ranean vs. Scandinavia. In: The MediterMediter-ranean response to Globalization before 1950, eds S. Pamuk and J. Williamson. London: Routledge, 17-44.
Reis, Jaime (2005a). O trabalho. In Silva, Álvaro da and Pedro Lains (eds.) História de
Portugal. Lisboa: ICS, vol. 2, 119-151.
Reis, Jaime (2005b). Economic growth, human capital formation and consumption in western Europe before 1800. In: In: Living Standards in the Past. New Perspectives on Well-Being
in Asia and Europe, eds. Allen, Robert, Bengtsson, Tommy and Martin Dribe. Oxford: Oxford
University Press, 195-225.
Reis, Jaime (2016). Gross agricultural output: a quantitative, unified perspective, 1500-1850. In: An Agrarian History of Portugal, 1000-2000. Economic development on the European
fron-tier, eds, Dulce Freire and Pedro Lains. Leiden: Brill, pp. 166-196.
Rosés, Joan, O’Rourke, Kevin and Jeffrey Williamson (2007). Globalization, growth and distribution in Spain 1500-1913. Working Papers in Economic History, Departamento de His-toria Económica e Instituciones, Universidad Carlos III de Madrid, WP-08.
Sá, Isabel (2005). O trabalho. In: Lains, Pedro and Silva, Álvaro (eds), História
Económi-ca de Portugal 1700-2000. O Século XVIII. Lisboa: ICS, vol. I, 93-121.
Santos, Rui (2003). Sociogénese do Latifundismo Moderno: Mercados, Crises e Mudança Soci-al na Região de Évora, Séculos XVII a XIX. Lisboa: Banco de PortugSoci-al.
Schön, Lennart and Olle Krantz (2012). The Swedish economy in the early modern pe-riod: constructing historical national accounts. European Review of Economic History 16, 529-549.
Silveira, Luís (1987). Aspectos da evolução das finanças públicas portuguesas (1800-1827). Análise Social 23, 505- 29.
Thomas, Richard and McCloskey, Deirdre (1981). Overseas trade and empire 1700-1800. In Roderick Floud and Deirdre McCloskey (eds), The Economic History of Britain since
1700. Cambridge: Cambridge University Press, vol. 1, 87-102.
Tomaz, Fernando (1988). As finanças do estado pombalino1762-1776. In: Estudos e
En-saios em Homenagem a Vitorino Magalhães Godinho. Lisboa: Sá da Costa, 355-388.
Van Zanden, J. L. (2009). The Long Road to the Industrial Revolution: The European
Econ-omy in a Global Perspective, 1000-1800. Leiden: Brill.
Van Zanden, Jan Luiten and Bas van Leeuwen (2012). Persistent but not consistent: The growth of national income in Holland 1347-1807. Explorations in Economic History 49, 119-130.
Wrigley, E. A. (1985). Urban growth and agricultural change: England and the Conti-nent in the early modern period. Journal of Interdisciplinary History 15, 683-728.
Wrigley, E. A. and R. S. Schofield (2010/1989). The Population History of England
1541-1871. Cambridge: Cambridge University Press. New edition.
Wrigley, E. A., Davies, R. S., Oeppen, J. E. and R. S. Schofield (1997). English