Bol. Mus. Mun. Funchal, Sup. N.º 6: 111-125, 2001 ISSN 0870-3876 By A. J. ALMEIDA1, L. AMOEDO1 & L. SALDANHA †
With 2 figures and 7 tables
ABSTRACT. The fish communities in the seagrass beds at Inhaca Island (Mozambique) were sampled in three stations during the cold season (July-August 1993). On the whole, 66 species of fishes belonging to 34 families were collected by trawling. Cluster and factorial correspondence analyses showed that the fish community structure was different at the three stations. These structural differences were attributed to the type of seagrass association and to the proximity of mangrove and coral reef areas. Differences between day and night samples attest to the occurrence of marked circadian changes between nocturnal and diurnal components of this seagrass fish community. Carnivorous fishes were dominant both in number and biomass while herbivorous and omnivorous species were less represented in these assemblages.
RESUMO. As comunidades ictiológicas dos fundos de fanerogâmicas da Ilha da Inhaca (Moçambique) foram amostradas em 3 estações durante a estação a estação fria (Julha-Agosto de 1993). No total, 66 espécies de peixes pertencendo a 34 famílias foram colhidas com arrasto. A análise dos dados mostrou que as comunidades ictiológicas tinham estruturas diferentes nas 3 estações. Estas diferenças foram atribuídas ao tipo de associação vegetal e à distância às áreas de coral e de mangal. Diferenças entre as amostragens diurnas e nocturnas atectam a ocorrência de ciclos circadianos marcados e a sua influência nas comunidades. Espécies carnívoras foram dominantes, quer em número, quer em biomassa, em relação às herbívoras e omnívoras.
1 Faculdade de Ciências da Universidade de Lisboa, Departamento de Biologia Animal, Laboratório Marítimo da Guia, Estrada do Guincho, 2750-642 Cascais, Portugal. E-mail: aalmeida@fc.ul.pt † Deceased (1937-1997). Faculdade de Ciências da Universidade de Lisboa, Laboratório Marítimo
INTRODUCTION
Seagrass beds are among the most productive marine ecosystems in the world and generally have an important role as nursery habitat (BAELDE, 1990; BLABER et al., 1992; ALMEIDA, 1994).
There is a worldwide homogeneity in the occurrence of some fish families in seagrass beds. For example, the Syngnathidae and Gobiidae were present at 24 of 25 seagrass bed localities studied around the World and among the 10 more abundant families (HOWARD & KOEHN, 1985). Similarly, Monacanthidae, Sparidae, Labridae, Gerridae and Tetraodontidae were also recorded at 25 different localities around the world by BELL & POLLARD (1989).
The ichthyofauna of seagrasses at Inhaca Island is poorly known: 43 species were listed by MacNAE & KALK (1962) and only 10 species were recorded by SMITH
(1969). In tropical areas, fish from seagrass beds have been studied in Madagascar (VIVIEN, 1974; HARMELIN-VIVIEN, 1983), the Caribbean region (WEINSTEIN & HECK, 1979; ROBBLEE & ZIEMAN, 1984; HECK & WEINSTEIN, 1989; BAELDE, 1990; BOUCHON-NAVARO et al., 1992), Papua New Guinea (BROUNS & HEIJS, 1985), Australia (BLABER et al., 1992), and isolated areas in the Pacific (JONES & CHASE,
1975). In Southern Africa, WHITFIELD (1989) also studied the ichthyofauna in Zostera
capensis beds.
Study area
The island of Inhaca is located off the east coast of Africa, at about 32 km from Maputo (Mozambique); it forms part of the barrier between the bay of Maputo and the Indian Ocean (Fig. 1).
All sampling stations were located in high-density seagrass beds, which were exploited by local fishermen. Sampling was undertaken at three locations in order to study the fish fauna associated with two types of mixed seagrass beds: Thalassodendron
ciliatum / Cymodocea serrulata and Thalassia hemprichii / Halodule wrihtii. These
different species and associations are distributed around Inhaca Island at about 5-6 m depth (high tide) and are geographically sorted (BANDEIRA, 1991) (Fig. 1).
MATERIAL AND METHODS
Fishes were collected in 1993 during the cold season (June-August) at three stations located in areas with different seagrass beds associations (Fig. 1). Station I and II were located in areas with the Thalassodendron ciliatum / Cymodocea serrulata association while Station III was characterised by the Thalassia hemprichii / Halodule
wrihtii association. Sampling was performed at high tide in the daytime on each of the
mesh aperture) towed during 10 minutes at a velocity of 1.5 knots (sixteen trawls in total). At station I sampling was also carried out at night. After identification, the collected individuals were measured to the nearest millimetre (total length), and weighted to the nearest milligram (total weight). The stomach contents were weighed and preserved in 5% formalin for later analysis.
Fig. 1 - Sampling areas:
1 - Estação de Biologia Marinha - Station I 2 - Banco da Sangala - Station II
3 - Saco da Inhaca - Station III
Cluster analysis of the sixteen samples, based in the number of individuals of the 66 species was used with rough data to compute a Bravais-Pearson correlation coefficient symmetrical matrix. UPGMA was employed for the construction of the dendrogram and the software used for was NTSYS-PC v. s. 1.6 by JAMES F. ROHLF.
RESULTS
The sixteen samples supplied 1290 individuals representing 66 species and 34 families (Tables 1, 2, 3 and 4). The most speciose families were the Labridae (5 species), the Scorpaenidae (4 species) and the Syngnathidae (4 species). Only 17 species were found in the three stations. Species found exclusively in a single locality were relatively numerous: 15 species at station III (Saco), 8 species at station II (Banco da Sangala) and 11 at station I (Estação de Biologia Marinha).
At station I, the diurnal assemblage (Table 1) was characterised by the important contribution of two species: Paramonocanthus barnardi (22,1% of individual numbers, 17% of biomass) and Apogon nigripinnis (13,8% of individual numbers, 19,9% of biomass). Aeoliscus punctulatus was another important species in term of numbers (16,4% ) but represented only 4,5% of the whole biomass. Conversely, Leptoscarus
vaigiensis was represented by few individuals (3,9%), but which accounted for 26% of
the whole biomass. Night trawls contributed with the double of individuals in comparison to day trawls and six species were caught only at nigh: Parupneus cinnabarinus,
Upeneus tragula, Plotosus nkunga, Scorpaenodes littoralis, Epinephelus andersoni
and a juvenile of Sphyraena sp. (only one individual of each species was captured). The most important species in the night samples (Table 2) were Siganus sutor (17,8% in numbers, 18,6% in biomass), Pelates quadrilineatus (21% in numbers, 11,4% in biomass), P. barnardi (16,1% in numbers, 8% in biomass), A. nigripinnis (10,1% in numbers, 9,5% in biomass), and L. vaigiensis (23,5% in biomass but only 3,4% in numbers).
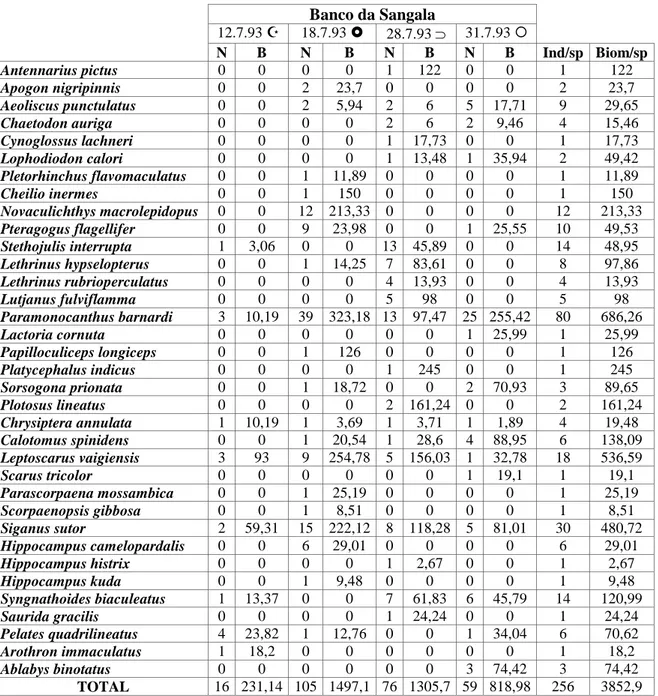
At Station II (Table 3) two species were dominant in numbers and biomass:
P. barnardi and S. sutor. At this station too, L. vaigiensis was dominant in biomass
(14,5%). Eight species were captured exclusively at this station: Antennarius pictus,
Scorpaenopsis gilbosa, Hippocampus histrix, Hippocampus kuda, Arothron imaculatus (with one individual each), Lophodiondon calori (two individuals), Lethrinus hypselopterus (8 individuals) and Lethrinus rubrioperculatus (four
individuals).
Station III (Table 4) was characterised by the presence of 15 species that have not been collected at the other stations: Foa brachygramma, Bothus pantherinus,
Pseudorhombus arsius, Cynoglossus durbanensis, Amblyogobius albimaculatus, Amblygobius sphynx, Vanderhostia delagoae, Stethojulis strigiventer, Parapercis xanthosoma, Nemipterus bipuntatus, Dascyllus trimaculatus, Dendrochirus brachyptherus, Epinephelus marginatus, Solea bleekeri and Crenidens crenidens.
The influence of the moon phases on the different distribution of fishes and therefore on their catchability (i. e. their apparent abundance) is attested by our results: during full moon the individuals were less abundant when compared to the numbers obtained during the new moon.
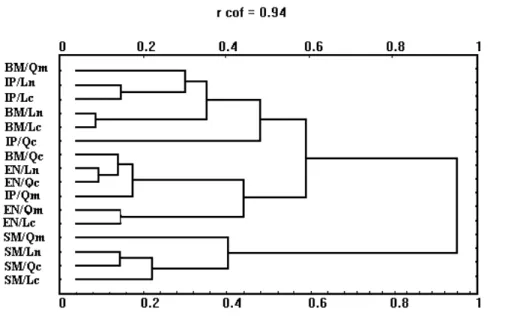
Cluster and factorial correspondence analyses based on species abundance data in the 16 samples showed that the structure of the fish community differed between the three localities and between day and night (Fig. 2).
The number of species, specimens and the total biomass as well as the diversity and eveness indices (in number and weight) obtained at each station are summarized in Table 5.
The number of young fishes (total length less than half of that of adults) represented almost 50% of the total catch (Table 6). However, some species occurred in the sampled seagrass beds as adults, such as L. vaigiensis, P. barnardi,
Novaculichthys macrolepidotus, Syngnathoides biaculeatus and some sea horses
(RANDALL, 1983).
Fig. 2 Cluster analysis of the different fish samples collected at Ilha da Inhaca. (BM -Estação de Biologia Marinha (day); EN - -Estação de Biologia Marinha (night); IP - Banco da Sangala; SM - Saco; Qm - third quarter of the moon; Ln - new moon; Qc - first quarter of the moon; Lc - full moon).
Stomach contents
In a selected sub-sample of 10 species (387 stomach contents analysed) carnivorous fishes were dominant in species number (six species: Parascorpaena
F. brachygramma). Herbivores comprised three species (Scarus tricolor, L. vaigiensis
and S. sutor) and one species, P. barnardi, was omnivorous.
The whole species pool (66 species) was classified according to three trophic categories (carnivorous, herbivorous, omnivorous) as indicated by our stomach content analyses and data available in the literature (VIVIEN, 1973; FOURMANOIR & LABOUTE, 1976; RANDALL, 1983; Van Der ELST, 1988; FISHER et al., 1990). Carnivorous fishes are the most important category (60,9% in abundance, 53,2% in biomass) (Table 7). The highest proportion of carnivorous fishes was found at station III (79,96% in number and 83,2% in biomass) as few omnivorous fishes were present and herbivorous fishes were represented by juveniles (Table 7).
DISCUSSION
The high number of species (66) found in the seagrass beds at Inhaca Island may result from the composite nature of these seagrass beds. At Tuléar (Madagascar), HARMELIN-VIVIEN (1983) also reported a higher richness of the fish fauna in mixed species seagrass beds than in single-species ones.
Station III (Saco) differs clearly from the other localities in terms of (i) species composition (15 species exclusive of this station, absence of several species that were abundant in the other stations, such as P. quadrilineatus, N. macrolepidopus and
Chrysiptera annulata), (ii) abundance and biomass structure (due particularly to the
contributions of P. barnardi, S. prionata, P. mossambica, Lethrinus lentjan, Saurida
gracilis, Aeoliscus punctulatus and Syngnathoides biaculeatus), (iii) demographic
structure (greater proportion of juveniles), (iv) habitat utilization (greater number of benthic fishes such as Bothus pantherinus, Pseudorhombus arsius, Cynoglossus
durbanensis, Papilloculiceps longiceps, P. indicus, S. prionata, Solea bleekeri), and
(v) trophic structure (almost absence of omnivorous species, low number of herbivorous species).
These differences can be explained by the habitat features resulting from the seagrass association Thalassia hemprichii / Halodule wrightii that occurred at Station III: the coverage of the bottom by these seagrasses was less complete and uniform than in areas covered by the Thalassodendron ciliatum / Cymodocea serrulata association and their leaves were less exuberant and less dense.
Other environmental features may induce the between-site differences observed among the ichthyological populations. The proximity of two other ecosystems, a vast mangrove and a small barrier of corals, may be responsible for these differences as already refered by other authors (KIKUCHI 1974; KIKUCHI & PÉRÈS, 1977; HARMELIN-VIVIEN, 1983; POLLARD, 1984; BAELDE, 1990). At low tide the water that had been warmed over the Saco platform is pushed offshore towards Ponta de Torres, where corals are abundant, while at high tide a cold stream of offshore waters covered
the Saco area. The fishes can use these streams for moving in search of better places for feeding or breeding.
The high number of young fishes observed in these localities is a characteristic of seagrass beds (BAELDE, 1990).
The differences observed at Station I between day and night samples (abundance and diversity greater at night) are in accordance with the results of other studies around the world (HARMELIN-VIVIEN, 1983; WEINSTEIN & HECK, 1979; ALMEIDA, 1988;
BLADER, et al., 1992).
TABLE 1 - List of species obtained during the day at Station I. N - number of individuals, B
- biomass (g).
(!- first quarter of the moon; " - full moon; ⊃- third quarter of the moon; #- new moon).
Estação de Biologia Marinha (Day) 11.7.93 ! 20.7.92 " 27.7.93 ⊃ 2.8.93 # N B N B N B N B Ind/sp Biom/sp Ptarmus jubatus 0 0 0 0 0 0 1 3,18 1 3,18 Apogon cooki 0 0 1 5,87 0 0 2 15,6 3 21,47 Apogon nigripinnis 0 0 15 170,36 1 15,89 16 236,56 32 422,81 Petroscirtes breviceps 0 0 0 0 1 3,24 1 7,46 2 10,7 Aeoliscus punctulatus 5 12,21 14 46,22 7 22,87 12 12,71 38 94,01 Novaculichthys macrolepidopus 0 0 0 0 2 13,33 1 12,83 3 26,16 Pteragogus flagellifer 0 0 5 35,46 0 0 1 12,82 6 48,28 Stethojulis interrupta 1 5,3 0 0 1 1,88 2 8,18 4 15,36 Lethrinus lentjan 2 24,42 0 0 0 0 0 0 2 24,42 Lethrinus nebulosus 0 0 1 8,56 1 14,22 1 9,65 3 32,43 Cantherrhines fronticinctus 0 0 1 33,21 0 0 0 0 1 33,21 Paramonocanthus barnardi 7 54,78 21 155,88 9 52,8 14 96,95 51 360,41 Parupeneus indicus 0 0 0 0 0 0 1 14,38 1 14,38 Sorsogona prionata 1 27,98 0 0 1 12,51 0 0 2 40,49 Chrysiptera annulata 1 3,71 5 21,55 2 9,73 0 0 8 34,99 Stegastes fasciolatus 0 0 0 0 0 0 2 28,08 2 28,08 Calotomus spinidens 0 0 1 32,22 3 51,84 1 38,51 5 122,57 Leptoscarus vaigiensis 0 0 2 62,55 1 1,04 6 489,41 9 553 Parascorpaena mossambica 0 0 2 43,21 1 23,25 1 24,69 4 91,15 Siganus sutor 0 0 2 11,89 5 21,79 2 18,07 9 51,75 Hippocampus camelopardalis 0 0 2 7,02 0 0 0 0 2 7,02 Syngnathoides biaculeatus 4 25,67 1 7,31 3 10,89 2 12,97 10 56,84 Saurida gracilis 0 0 0 0 1 28,26 0 0 1 28,26 Pelates quadrilineatus 1 6,07 6 48,4 23 83,97 1 4,57 31 143.01 Canthigaster solandri 0 0 0 0 0 0 1 2,66 1 2,66 TOTAL 22 160,1 79 689,71 62 367,51 68 1049,3 231 2123,63
TABLE 2 - List of species obtained during the night at Station I. N - number of individuals, B
- biomass (g).
(!- first quarter of the moon; " - full moon; ⊃- third quarter of the moon; #- new moon).
Estação de Biologia Marinha (Night) 10.7.93 ! 18.7.93 " 26.7.93 ⊃ 3.8.93 $ N B N B N B N B Ind/sp Biom/sp Ptarmus jubatus 5 14,41 0 0 0 0 0 0 5 14,41 Apogon cooki 7 48,02 4 38,68 16 136,3 2 19,85 29 242,88 Apogon nigripinnis 30 350,1 8 88,72 16 169,3 3 43,6 57 651,72 Petroscirtes breviceps 2 71,82 0 0 2 7,12 0 0 4 78,94 Aeoliscus punctulatus 0 0 5 13,96 4 14,04 0 0 9 28 Cynoglossus lachneri 11 140,8 1 15,45 1 18,08 0 0 13 174,3 Pletorhinchus flavomaculatus 2 71,56 0 0 1 22,35 0 0 3 93,91 Pteragogus flagellifer 1 21,75 10 145 1 1,14 0 0 12 167,89 Lethrinus lentjan 6 39,89 7 70,8 6 64,1 1 6,9 20 181,69 Lethrinus variegatus 0 0 3 11,09 0 0 0 0 3 11,09 Lutjanus fulviflamma 3 46,82 3 75,25 1 16,84 0 0 7 138,91 Paramonocanthus barnardi 26 119,7 38 293 22 136,7 0 0 86 549,36 Parupeneus cinnabarinus 0 0 0 0 1 6,27 0 0 1 6,27 Parupeneus indicus 0 0 2 114,4 0 0 0 0 2 114,35 Upeneus tragula 0 0 1 12,79 0 0 0 0 1 12,79 Lactoria cornuta 1 7,52 0 0 0 0 0 0 1 7,52 Sorsogona prionata 6 52,4 2 43,65 2 34,36 1 7,11 11 137,52 Plotosus lineatus 2 22,74 4 50,42 1 19,81 0 0 7 92,97 Plotosus nkunga 0 0 0 0 1 22,82 0 0 1 22,82 Chrysiptera annulata 2 7,5 1 4,7 4 19,81 0 0 7 32,01 Calotomus spinidens 8 19,33 1 28,77 0 0 1 39,88 10 87,98 Leptoscarus vaigiensis 3 217,6 10 700,6 5 695,8 0 0 18 1614,08 Scarus tricolor 1 13,05 0 0 0 0 0 0 1 13,05 Parascorpaena mossambica 2 30,46 1 35,17 2 47,56 0 0 5 113,19 Scorpaenodes littoralis 1 2,72 0 0 0 0 0 0 1 2,72 Epinephelus andersoni 0 0 1 170 0 0 0 0 1 170 Siganus sutor 55 417,8 14 403,5 8 139,5 18 315,9 95 1276,7 Sphyraena sp. 1 0,24 0 0 0 0 0 0 1 0,24 Hippocampus camelopardalis 1 0,84 0 0 0 0 0 0 1 0,84 Syngnathoides biaculeatus 2 5,97 2 15,43 3 19,68 1 7,38 8 48,46 Pelates quadrilineatus 21 97,01 43 327,1 38 285,2 10 75,53 112 784,76 Canthigaster solandri 0 0 1 4,67 0 0 0 0 1 4,67 TOTAL 199 1820 162 2663 135 1877 37 516,1 533 6876,04
TABLE 3 - List of species obtained Station II. N - number of individuals, B - biomass (g).
(!- first quarter of the moon; " - full moon; ⊃- third quarter of the moon; #- new moon).
Banco da Sangala 12.7.93 ! 18.7.93 " 28.7.93 ⊃ 31.7.93 $ N B N B N B N B Ind/sp Biom/sp Antennarius pictus 0 0 0 0 1 122 0 0 1 122 Apogon nigripinnis 0 0 2 23,7 0 0 0 0 2 23,7 Aeoliscus punctulatus 0 0 2 5,94 2 6 5 17,71 9 29,65 Chaetodon auriga 0 0 0 0 2 6 2 9,46 4 15,46 Cynoglossus lachneri 0 0 0 0 1 17,73 0 0 1 17,73 Lophodiodon calori 0 0 0 0 1 13,48 1 35,94 2 49,42 Pletorhinchus flavomaculatus 0 0 1 11,89 0 0 0 0 1 11,89 Cheilio inermes 0 0 1 150 0 0 0 0 1 150 Novaculichthys macrolepidopus 0 0 12 213,33 0 0 0 0 12 213,33 Pteragogus flagellifer 0 0 9 23,98 0 0 1 25,55 10 49,53 Stethojulis interrupta 1 3,06 0 0 13 45,89 0 0 14 48,95 Lethrinus hypselopterus 0 0 1 14,25 7 83,61 0 0 8 97,86 Lethrinus rubrioperculatus 0 0 0 0 4 13,93 0 0 4 13,93 Lutjanus fulviflamma 0 0 0 0 5 98 0 0 5 98 Paramonocanthus barnardi 3 10,19 39 323,18 13 97,47 25 255,42 80 686,26 Lactoria cornuta 0 0 0 0 0 0 1 25,99 1 25,99 Papilloculiceps longiceps 0 0 1 126 0 0 0 0 1 126 Platycephalus indicus 0 0 0 0 1 245 0 0 1 245 Sorsogona prionata 0 0 1 18,72 0 0 2 70,93 3 89,65 Plotosus lineatus 0 0 0 0 2 161,24 0 0 2 161,24 Chrysiptera annulata 1 10,19 1 3,69 1 3,71 1 1,89 4 19,48 Calotomus spinidens 0 0 1 20,54 1 28,6 4 88,95 6 138,09 Leptoscarus vaigiensis 3 93 9 254,78 5 156,03 1 32,78 18 536,59 Scarus tricolor 0 0 0 0 0 0 1 19,1 1 19,1 Parascorpaena mossambica 0 0 1 25,19 0 0 0 0 1 25,19 Scorpaenopsis gibbosa 0 0 1 8,51 0 0 0 0 1 8,51 Siganus sutor 2 59,31 15 222,12 8 118,28 5 81,01 30 480,72 Hippocampus camelopardalis 0 0 6 29,01 0 0 0 0 6 29,01 Hippocampus histrix 0 0 0 0 1 2,67 0 0 1 2,67 Hippocampus kuda 0 0 1 9,48 0 0 0 0 1 9,48 Syngnathoides biaculeatus 1 13,37 0 0 7 61,83 6 45,79 14 120,99 Saurida gracilis 0 0 0 0 1 24,24 0 0 1 24,24 Pelates quadrilineatus 4 23,82 1 12,76 0 0 1 34,04 6 70,62 Arothron immaculatus 1 18,2 0 0 0 0 0 0 1 18,2 Ablabys binotatus 0 0 0 0 0 0 3 74,42 3 74,42 TOTAL 16 231,14 105 1497,1 76 1305,7 59 818,98 256 3852,9
TABLE 4 - List of species obtained at Station III. N - number of individuals, B - biomass (g).
(!- first quarter of the moon; " - full moon; ⊃- third quarter of the moon; #- new moon).
Saco da Inhaca 10.7.93 ! 17.7.93 " 25.7.93 ⊃ 31.7.93 # N B N B N B N B Ind/sp Biom/sp Apogon nigripinnis 5 69,06 0 0 4 55,31 0 0 9 124,37 Foa brachygramma 16 32,8 11 18,71 24 33,71 13 24,17 64 109,39 Petroscirtes breviceps 3 23,06 3 17,14 1 10,74 0 0 7 50,94 Bothus pantherinus 1 0,63 0 0 0 0 0 0 1 0,63 Pseudorhombus arsius 1 96 0 0 0 0 0 0 1 96 Aeoliscus punctulatus 0 0 3 11,41 0 0 0 0 3 11,41 Chaetodon auriga 0 0 0 0 3 22,41 0 0 3 22,41 Cynoglossus durbanensis 1 27,71 0 0 0 0 0 0 1 27,71 Amblygobius albimaculatus 0 0 0 0 1 31,28 0 0 1 31,28 Amblygobius sphynx 2 145,93 0 0 0 0 1 16,53 3 162,46 Vanderhorstia delagoae 1 - 0 0 0 0 0 0 1 - Pletorhinchus flavomaculatus 0 0 0 0 1 23,94 0 0 1 23,94 Cheilio inermes 0 0 0 0 0 0 1 86,74 1 86,74 Pteragogus flagellifer 0 0 0 0 3 37,07 0 0 3 37,07 Stethojulis interrupta 1 3,52 1 2,33 3 6,52 3 11,93 8 24,3 Stethojulis strigiventer 1 3,44 0 0 0 0 0 0 1 3,44 Lethrinus lentjan 11 69,59 2 10,57 2 5,35 7 23,6 22 109,11 Lethrinus nebulosus 0 0 1 12,62 0 0 2 15,77 3 28,39 Lethrinus variegatus 1 7,01 0 0 3 13,6 6 11,77 10 32,38 Lutjanus fulviflamma 2 25,78 0 0 0 0 1 22,7 3 48,48 Paramonocanthus barnardi 1 6,44 0 0 1 9,56 0 0 2 16 Parapercis xanthozona 1 19,6 0 0 0 0 0 0 1 19,6 Parupeneus indicus 0 0 0 0 1 2,96 0 0 1 2,96 Nemipterus bipuntatus 13 - 0 0 0 0 0 0 13 - Papilloculiceps longiceps 1 98 0 0 0 0 0 0 1 98 Platycephalus indicus 2 328,6 1 57,48 0 0 0 0 3 386,08 Sorsogona prionata 6 75,75 2 106,33 3 80,34 5 86,05 16 348,47 Plotosus lineatus 12 2,2 0 0 0 0 0 0 12 2,2 Dascyllus trimaculatus 0 0 0 0 0 0 1 5,97 1 5,97 Calotomus spinidens 1 - 0 0 0 0 3 35,55 4 35,55 Leptoscarus vaigiensis 6 1,29 2 1,27 1 2,16 5 72,81 14 77,53 Scarus tricolor 1 4,98 2 2,77 4 12,5 0 0 7 20,25 Dendrochirus brachyptherus 0 0 0 0 2 7,94 0 0 2 7,94 Parascorpaena mossambica 9 103,03 2 22,74 0 0 3 18,98 14 144,75 Epinephelus marginatus 1 56,39 0 0 0 0 0 0 1 56,39 Siganus sutor 9 86,15 2 22,74 0 0 5 57,26 16 166,15 Solea bleekeri 1 21,23 0 0 0 0 0 0 1 21,23 Crenidens crenidens 2 25,76 1 12,47 0 0 0 0 3 38,23 Hippocampus camelopardalis 0 0 1 1,96 0 0 0 0 1 1,96 Syngnathoides biaculeatus 2 5,99 1 5,12 0 0 0 0 3 11,11 Saurida gracilis 4 36,36 1 10,12 0 0 2 33,77 7 80,25 Ablabys binotatus 0 0 0 0 0 0 1 7,97 1 7,97 TOTAL 118 1376,3 36 315,78 57 355,39 59 531,6 270 2579,04
TABLE 5 - Numbers of species and individuals, and corresponding biomass (in grammes)
obtained in each sample (10 min trawl); values of diversity indice (H’) and evenness calculated for species abundance and biomass.
Est. Biologia
Day Night Sangala Saco
N.º of species 25 32 35 42 N.º individuals 229 531 255 267 Biomass (g) 2247,4 5545,86 3740,7 2573,8 Diversity (H'n) 2,42 2,51 2,66 3,01 Diversity (H'w) 2,43 2,47 2,83 3,08 Evenness (En) 1,34 1,49 1,85 1,71 Evenness (Ew) 0,65 0,67 0,67 0,69
TABLE 6 - Proportion (%) of juveniles and adults at the three stations.
Estação de Biologia Marinha (I) Day Night Banco de Sangala (II) Saco da Inhaca (III) Total Adults (%) 65.1 42.96 56.64 45.42 50.15 Juvenils (%) 34.9 57.04 43.36 54.58 49.85
TABLE 7 - Contribution of the three trophic categories in terms of species numbers (sp),
relative abundance (% N) and relative biomass (% W) at the three sampled localities, and of three prominent species.
Estação de Biologia (Station I) Day Night Sangala (Station II) Saco
(Station III) Total sp %N %B sp %N %B sp %N %B sp %N %B sp %N %B Carnivorous 16 62,9 43,6 21 58,4 46,7 27 45,1 50 42 79,6 83,2 49 60,9 53,2 Herbivorous 6 14,4 37,7 6 25,4 45,1 5 23 31 6 18,1 13,8 9 21,3 35,3 Omnivorous 3 23,1 18,7 3 16,6 8,2 3 31,9 19 3 2,2 2,9 7 17,7 11,4 L. vaigiensis/Herbivorous - 27,3 69 - 13,3 52 - 30,5 44,9 - 28,6 21,7 - 21,4 51 S. sutor/ Herbivorous - 27,3 6,5 - 70,4 41,1 - 50,8 40,3 - 32,6 46,6 - 53,6 36,2 P. barnardi/Omnivorous - 96,2 90,9 - 97,7 97,8 - 97,6 94 - 33,3 21,7 - 95,6 91,5
ACKNOWLEDGEMENTS
Thanks are due to Domingos Gove (Director of the «Estação de Biologia Marinha da Inhaca») for the facilities offered, to Adriano Macio Jr. for all enlightments. An anonymous referee helped to improve the manuscript quality.
This study was carried out within an EC Project Contract n.° TS30114: «Inter linkages Between Eastern African Coastal Ecosystems».
REFERENCES
ALMEIDA, A. J. T.:
1988. Estrutura, dinâmica e produção da macrofauna acompanhante dos povoamentos de Zostera noltii e Zostera marina do estuário do Rio Mira. Dissertação de candidatura ao grau de Doutor apresentada à Faculdade de Ciências da Universidade de Lisboa, 363 pp.
ALMEIDA, A. J.:
1994. Macrofauna acompanhante de Zosteraceas. Importância na conservação do meio marinho. Professor Germano da Fonseca Sacarrão. Museu Bocage: 125-144 BAELDE, P.:
1989. Differences in the structures of fish assemblages in Thalassia testudium beds in Guadeloupe, French West Indies, and their ecological significance. Marine Biology, 105: 163-173.
BANDEIRA, S. O.:
1991. Distribuição e Taxonomia das Ervas Marinhas da Ilha da Inhaca. Tese de Licenciatura. Universidade Eduardo Mondlane. Maputo, Moçambique. 61 pp. BELL, J. D. & D. A. POLLARD:
1989. Ecology of fish assemblages and fisheries associated with seagrasses. In: Biology of seagrass - A treatise on the biology of seagrasses with special reference to the Australian region (eds.: A. W. D. Larkum, A. J. McComb & S. A. Shepherd), pp 565-609. Elsevier.
BLADER, S. J. M., D. T. BREWER, J. P. SALINI, J. D. KERR & C. CONACHER:
1992. Species composition and biomass of fish in tropical seagrasses at Groote Eylandt, Northern Australia. Estuarine Coastal and Shelf Science, 35: 605-620.
BOUCHON-NAVARO, Y., C. BOUCHON & M. LOUIS:
1992. L’Ichtyofaune des herbiers de phanérogames marines de la baie de Fort-de-France (Martinique, Antilles Françaises). Cybium, 16 (4): 307-330.
BROUNS, J. J. W. & F. M. L. HEIJS:
1989. Tropical seagrass systems in Papua New Guinea. A general account of the environment, marine flora and fauna. Koninklijke Nederlandse Akademie van Wetenschappen, Proceeedings Series C, Biological and Medical, 88: 145-182.
FISCHER, W., I. SOUSA, C. SILVA, A. FREITAS, J. M. POUTIERS, W. SCHNEIDER, T. C. BORGES, J. P. FÉRAL & A. MASSINGA:
1990. Guia de Campo das Espécies Comerciais Marinhas e de Águas Salobras de Moçambique. Fichas FAO de identificação de espécies para actividades de pesca. Organização das Nações Unidas para a Agricultura e Alimentação. 424 pp. FOURMANOIR, P. & P. LABOUTE:
1976. Poissons des Mers Tropicales. Editions du Pacifique HARMELIN-VIVIEN, M. L.:
1983. Étude comparative de l’ichtyologie des herbiers de phanerogames marines en milieux tropical et temperé. Revue ecologique (Terre Vie), 38: 179-210. HECK, K. L. & M. P. WEINSTEIN:
1989. Feeding habits of juvenile reef fishes associated with Panamanian seagrass meadows. Bulletin of Marine Science, 45: 629-636.
HOWARD, R. K. & J. D. KOEHN:
1985. Population dynamics and feeding ecology of pipefish (Syngnathidae) associated with eelgrass beds of Western Port, Victoria. Australian Journal of Marine and Freshwater Reserch, 36: 70-361.
JONES, R. S. & J. A. CHASE:
1975. Community structure and distribution of fishes in an enclosed high island lagoon in Guam. Micronesica, 11: 127-148.
KIKUCHI, T. & J.-M. PÉRÈS:
1977. Consumer ecology of seagrass beds. In: Seagrass ecosystems. A scientific perspective (eds.: C. P. McRoy & Helfferich), pp. 147-193.
KIKUCHI, T.:
beds, with special reference to trophic relationships and resources in inshore fisheries. Aquaculture, 4: 60-145.
MacNAE, W. & M. KALK:
1962. The fauna and flora of sand flats at Inhaca Island, Moçambique. Journal of Animal Ecology, 32: 93-128.
MANN, K. H.:
1982. Ecology of Coastal waters. A systems approach. London, Blackwell. Scientific Publications, (Studies in Ecology, 8). 322 pp.
POLLARD, D. A.:
1984. A review of ecological studies on seagrass fish community, with particular reference to recent studies in Australia. Aquatic Botany, 18: 3-42.
RANDALL, J. E.:
1983. Red Sea Reef Fishes. Immel Publishing Limited, London. 192 pp. ROBBLEE, M. B. & J. C. ZIEMAN:
1984. Diel variation in the fish fauna of a tropical seagrass feeding ground. Bulletin of Marine Science, 34: 335-345.
SMITH, J. B. L.:
1969. The marine fishes of Inhaca. In: A Natural History of Inhaca Island (eds.: W Macnae & M. Kalk). 163 pp. Mozambique. Witwatersrand, University Press. Johannesburg.
Van Der ELST, R.:
1988. A Guide to the common Sea Fishes of Southern Africa. Struik Publishers. 398 pp.
VIVIEN, M. L.:
1973. Contribution a la connaissance de l’éthologie alimentaire de l’ichtyofaune du platier interne des récifs coralliens de Tuléar (Madagascar) Téthys, 5: 221-308.
1974. Ichtyofaune des herbiers de Phanerogames marines du Grand Récif de Tuléar (Madagascar) I.: Les peuplements et leur distribution écologique. Téthys, 5: 425-436.
WEINSTEIN, M. P. & K. L. HECK:
the Gulf of Mexico: Composition, structure and community ecology. Marine Biology, 50: 97-107.
WHITFIELD, A. K., L. E. BECKLEY, B. A. BENNETT, G. M. BRANCH, H. M. KOK, I. C. POTTER & R. P. Van Der ELST:
1989. Composition, species richness and similarity of ichthyofaunas in eelgrass Zostera capensis beds of southern Africa. South African Journal of Marine Science,
8: 251-259.