M
ASTER IN
F
INANCE
M
ASTERS
F
INAL
P
ROJECT
D
ISSERTATIONH
OW WELL DOP
ORTUGUESEP
ART-
TIMEE
NTREPRENEURSP
ERFORM?
M
ARIANAV
IDIGALG
UIDANCE:
P
ROFESSORAA
NAI
SABELO
RTEGAV
ENÂNCIO2
Abstract
The purpose of this study is to evaluate the performance of part-time entrepreneurs, more specifically evaluate their survival. We use an employer–employee dataset (QP – “Quadros de Pessoal”), we solemnly select all start-ups established between 2000 and 2007, and exclude nonprofit organizations, obtaining a total of 41,293 observations. The nonprofit organizations were excluded mainly because this study focused on individuals that decided to engage in part-time entrepreneurship as a way to gain an extra income.
Part-time entrepreneurs are individuals who dedicate their spare time in engaging in entrepreneurial ventures while maintaining a regular job.
Our major finding is that part-time entrepreneurs share some similarities with the full-time entrepreneur’s features, mainly in terms of age and firm’s size.
JEL classification: L25, L26, L29
3
Resumo
O propósito desta dissertação é examinar o desempenho dos empreendedores a tempo parcial, principalmente analisar sua sobrevivência. Recorremos a uma base de dados com dados do empregado-empregador (QP – “Quadros de Pessoal”), e selecionámos todas as novas empresas que se estabeleceram no período de 2000-2007, excluindo todas as organizações sem fins lucrativos, obtendo um total de 41,293 observações.
As organizações sem fins lucrativos foram excluídos, porque este estudo incide sobre indivíduos que decidiram se envolver no empreendedorismo a tempo parcial como forma de obter um rendimento adicional.
Um empreendedor a tempo parcial é uma pessoa que dedica o seu tempo livre a exercer uma actividade empresarial, enquanto mantém um trabalho regular.
A nossa principal conclusão é que as características dos empresários de tempo parcial partilham algumas semelhanças com empresários a tempo integral, principalmente em termos de idade e tamanho da empresa.
Classificação do JEL: L25, L26, L29
4
Acknowledgments
I would like to address special thanks to my advisor, Prof. Ana Venâncio, for her guidance, advice and for all the patience in the whole process of the development of this thesis.
I would also like to thank my family and friends for their endless support and encouragement.
Finally, I would like to thank the Portuguese Ministry of Employment and Social Security and Gabinete de Estratégia e Planeamento (GEP) for giving me access to the matched employer-employee data. All errors remain my own. Views expressed are those of the author and do not necessarily reflect those of any branch or agency of the Government of Portugal.
Financial support was provided by the Fundação para a Ciência e a Tecnologia (Portuguese Foundation for Science and Technology) through the project PTDC/IIM-ECO/3513/2012.
5
Table of Contents
Abstract ... 2 Resumo ... 3 Acknowledgments ... 4 List of Abbreviations ... 8 1. Introduction ... 9 2. Literature Review ... 12 2.1 Determinants of Entrepreneurship ... 12 2.1.1 Human Capital ... 12 2.1.2 Demographic characteristics... 13 2.1.3 Financial ... 14 2.2 Macro-economic Context ... 15 2.3 Start-ups Performance ... 163. Part-Time Entrepreneurs and Hypothesis ... 18
4. Data and Descriptive Statistics ... 22
4.1 Sample and Data ... 22
5. Empirical Methodology and Results ... 25
6. Conclusion ... 29
7. Bibliography ... 31
8. Tables ... 37
6
List of Tables
Table 1: Summary of the descriptive statistics of our sample ... 37 Table 2: Marginal Effects for the Firm’s Survival (Logit) ... 38 Table 3: Cox Proportional Hazard Model for the Firm’s Survival (no Hazard Ratios) . 39
7
Appendix
Table A1: Marginal Effects for the Firm’s Survival (Probit) ... 40 Table A2: OLS for the Firm’s Survival (LPM) ... 41
8
List of Abbreviations
CAE.Rev2 Portuguese Classification of Economic Activities, Revision 2
LPM Linear Probability Model
NUTS II Nomenclature of Territorial Units for Statistics 2 OECD Organization for Economic Co-Operation for
Development QP Quadro de Pessoal R. A. Autonomous Region
9
1. Introduction
Entrepreneurship is considered to be a process of innovation that is responsible for the introduction of new products and production methods and different organizational schemes (Schumpeter, 1934; Wennekers and Thurik, 1999; Carree and Thurik, 2003). Entrepreneurship plays a highly important role in the economy, not only it stimulates productivity, growth and innovation (Praag and Versloot, 2008), but also encourages the job creation (Fölster, 2000).
Entrepreneurship is substantially affected by several factors such as individual, abilities, family background, occupational status, liquidity constraints and ethnic enclaves (Le, 1999).
Though many studies investigate why individuals become entrepreneurs, part-time entrepreneurship is an emerging topic that offers many avenues of research, but still has received few attention in the literature. In fact, according to Petrova (2011), most of the primary studies on entrepreneurship do not deal with part-timers, they usually use self-employment as a proxy to entrepreneurship. Nevertheless, Global Entrepreneurship Monitor (2003) show that 80 percent of the establishments were implemented by individuals that also hold a regular wage job, not just the start-up itself
Petrova (2005, 2011), Folta et al (2010), are just few of the main authors that have tackled this recent topic.
Part-time entrepreneurs1 are individuals who spend their time in wage employment and in entrepreneurship at the same time (Petrova, 2011). Folta et al (2010) presents three reasons to engage into part-time entrepreneurship. The first is the “A Path to Supplementary income”, which is about having an extra source of income; the second is
1 Folta, Delmar and Wennberg (2010) see hybrid entrepreneurship in a very similar way as part-time entrepreneurship, by defining
hybrid entrepreneurs “as individuals who engage in self-employment activity while simultaneously holding a primary job in wage work”. Yet, hybrid entrepreneurs primary job in wage work does not need to be on a full-time basis job, which is something that it is not specified in the part-time entrepreneurship case.
10
the “A Path to Nonmonetary Benefits”, meaning that individuals gain nonmonetary benefits (such as psychological benefits) that might not be available in their regular wage job; and the final reason is “A Path to Transition”, suggesting that part-time entrepreneurship may serve as a safer and smoother transition into full-time entrepreneurship.
Usually part-time entrepreneurs are risk averse individuals which test their start-up, gain feedback and learn about the business potential and their own fit in the entrepreneurial setting.(Petrova, 2011)
In this study, we evaluate the performance of part-time entrepreneurs by comparing their characteristics and performance with full-entrepreneurs. More specifically, our research question is: How well do part-time entrepreneurs perform in comparison to full-time entrepreneurs?
Our main conclusion is that the firm’s survival is higher among full-time entrepreneurs than part-time entrepreneur. In fact, for part-time entrepreneurs, the firm’s survival is higher for older entrepreneurs and for larger firms.
Our empirical results show that for part-time entrepreneurs, only the founder’s age (specially the age group between 40 and 49) and the firm’s size are significant variables for the firm’s survival.
In respect to full-time entrepreneurs, the founder’s age, education, gender and the firm’s size, are all relevant variables for the firm’s survival.
However, when joining both types of entrepreneurs, being a part-time entrepreneur has a negative relationship with the firm’s survival, meaning that their firms have a shorter period of life in comparison with full-time entrepreneurs.
To evaluate this phenomena, we use a unique database that allow us to match founders with their ventures characteristics. With this database we can distinguish between paid
11
workers, part-time entrepreneurs and full-time entrepreneurs. Our main finding is that part-time entrepreneurs share some of the full-time entrepreneur’s characteristics. For full-time entrepreneurs, the firm’s survival is higher among some education, relatively older man founders and for initially larger firms.
The contribution of our study to literature is twofold: first, this study help us understand how part-time entrepreneurs perform (in terms of survival) in comparison to the full-time entrepreneurs and, secondly, to see what type of variables (company’s size, founder’s age, education and gender) have an impact or not in the performance of part-time and full-time entrepreneurs.
This study has implications for policy makers and part-time entrepreneurs due to the fact that the empirical results help us to see which of the variables have a negative influence on the firm’s survival, for both part-time and full-time entrepreneurs. And the empirical results show that the initial firm’s size has a great influence on the firm’s survival. In other words, larger the initial firm’s size, higher are the chances that the firm’s survives for a longer period.
The remaining sections of this study are organized as follows. The following section reviews the literature on part-time entrepreneurship, their determinants and performance. Then, in section III we exhibit our theory and hypotheses. In section IV, we describe the dataset and how it was constructed. The empirical methodology and results are described in section V. Finally, we present our conclusions in section VI.
12
2. Literature Review
Previous literature have devote considerable effort studying the determinants of entrepreneurship and their performance. In this section, we will start by making a brief description of the main characteristics that make an individual an entrepreneur2. This section is going to focus in three parts: human capital, demographic characteristics and financial characteristics. The subsequent section will explain the impacts that entrepreneurship has in the macroeconomic context. Followed by a section that clarifies the different aspects of start-ups performance, solemnly focusing on the firm’s survival.
2.1 Determinants of Entrepreneurship
Parker (2009) describes the determinants of entrepreneurship and categorizes them into three groups: human capital3, demographic characteristics4 and financial.
2.1.1 Human Capital
Becker (2009) explains that human capital theory is the outcome of the worker’s productivity resulted in the investment made in education or training. According to Becker (2009), human capital can be divided into two categories: i) general human capital is a generic knowledge or skill, that is not particular to a certain task or company, which can be acquired through education and experience; and ii) specific human capital is associated to the individual’s professional and training experience in areas related to his activity.
2 There are other characteristics that are being exploited, such as the entrepreneur’s risk attitude and other psychological traits. Some
authors believe that being a risk-taker, over-confidence, the need of being “your own boss”, internal locus of control, among others, are just some features that someone can find in an entrepreneur (Simon and Houghton, 2003; Le, 1999; Evans and Leighton, 1989; Blanchflower 2000).
3 Human capital embodies all the individuals’ characteristics concerning their education and experience (Parker, 2009). 4 Demographic Characteristics includes the founder’s age, gender, marital status and family background (Parker, 2009).
13
Le (1999) finds that both experience and education are considered to be crucial determinants in the decision of becoming an entrepreneur. Jovanovic (1982) finds that experience is an essential component of human capital, for the simple fact the individual learn from past experiences. Evans and Leighton (1989) also support the idea that individuals with more experience have a positive impact in the entry into self-employment. In most of the studies, education is seen as complement because it helps individuals develop their managerial abilities. Therefore, higher the education, the higher will be the propensity move to self-employed (Evans and Leighton; 1989). However, others disagree and defend that a higher education may ease the entry into wage/salary sector, thus reducing the predisposition to enter into self-employed (Evans, 1989). Blanchflower (2000) discovers that the least educated and those who are highly educated have a higher probability of being entrepreneurs5.
2.1.2 Demographic characteristics
Entrepreneurs are usually men, middle aged, married and wealthier individuals (Blanchflower, 2004; Le, 1999; Evans and Jovanovic, 1989). Men have a higher predisposition to transition into entrepreneurship than women (Blanchflower, 2000; Evans and Leighton, 1989), because women have less financial support, are more risk averse and have more difficulty balancing time between family and business (Carter and Allen, 1997).
As individuals get older, the probability of becoming an entrepreneur increases (Blanchflower, 2000). The main reason behind that statement is due to three reasons: i) older individual have more resources (that they have saved throughout their life); ii) they have the desire to get a flexible employment; iii) and they want to avoid mandatory
5 For Blanchflower (2000), the “least educated” include all the individual who left school before achieving their 15 years old, while
14
retirement. Alternatively, Evans and Leighton (1989) find no significant association between age and the entry into entrepreneurship.
Concerning marital status, Le (1999) and Blachflower and Oswald (1998) find a positive relationship between marital status and the predisposition to move to entrepreneurship. The reason for that, according to Le (1999), is that married couple are able to save more money to start the business.
Evans and Leighton (1989) and Blanchflower and Oswald (1998) discover that having a father who is a manager or a farmer, will increase the probability to be self-employed. While Dunn and Holtz-Eakin (2000) find that if both parents are involved in entrepreneurial businesses, the likelihood of their sons entering into entrepreneurship is higher.
According to Le (1999), immigrants have a higher probability to be entrepreneurs, only if they establish an ethnic business, because immigrants have access to the potential clients as well as access to labor supply and capital.
2.1.3 Financial
Evans and Jovanovic (1989) and Evans and Leighton (1989), find a positive relationship between household wealth and entrepreneurship.
Nevertheless, Hurst and Lusardi (2004) find that the relationship only works for the households at the very top of the wealth distribution. These authors suggest liquidity constraints do not prevent individuals to engage in entrepreneurial activities.
15
2.2 Macro-economic Context
Many authors have focused their field of study based on the theory of income choice, in order to explain the reasons for which individuals become entrepreneurs. This theory implies that entrepreneurship and unemployment are negatively correlated because the opportunity cost of starting a firm has decreased (Evans and Jovanovic, 1989; Evans and Leighton, 1989). In other words, unemployment push individuals to engage in entrepreneurial activities, which somewhere in time, those entrepreneurial activities can lead to the creation of more jobs, and therefore decreasing unemployment.
To contradict this finding, Audretsch et al (2005) explain that due to low rates of the newly firm’s survival combined with the limited growth of the majority of small firms, entrepreneurial activities do not reduce unemployment.
So it is possible to see that this topic is divided in two different perspectives, whether unemployment can lead or not to an increase of entrepreneurial activities.
16
2.3 Start-ups Performance
Firm performance plays a crucial part in the development of the economy. Some factors such as macroeconomic growth rates, employment and the standards of living, are extremely linked with the economic performance of firms (Carrizosa, 2007).
It is important to bear in mind that the end of a business does not imply the end of an individual in entrepreneurship, which can clarify why individual exit rates from entrepreneurship have a tendency to be lower than venture closure rates (Ronstadt, 1986). Concerning the firm’s survival, Tamásy (2005) states that the success of a firm can be measured by its survival and growth.
Parker (2009) explains that there are different reasons for a business to terminate, and it can be to start a new and more promising venture or to a constant financial under-performance.
Parker (2009) summarizes the main characteristics that have an impact on the firm’s exit flows. At the individual level, the main features are: age, education and the duration in entrepreneurship (enhancing that the last two variables are strongly related with the firm’s age, and therefore with the entrepreneur’s age). Also at that level, Stearns et al (1995) add that some personal traits may have an influence on the firm survival, such as the founder’s leadership skills and social relationship.
In the firm level, the firm’s age and size are considered to be the most studied determinants for the firm’s survival, and these determinants are positively related to the likelihood of survival (Audretsch, 1995, Geroski, 1995; Mata and Portugal, 1994). However, Mata et al (1995) find out that the current size is a more accurate predictor than the initial firm size.
17
And at the industry level, the characteristics of demand6 (Mata and Portugal, 1994), the characteristics of technology (Audretsch, 1995; Cefis and Marsili, 2003) and the life cycle (Agarwal and Audretsch, 2001), are considered to be crucial for the firm’s survival. Cefis and Marsili (2003) highlight the importance in the firm’s ability to adapt and adjust their position to the constant change in the environments through innovation, since innovation helps generating the necessary variety to achieve a strong competitive position and it also raises the firm's potential to succeed in the market.
To complement the list of determinants that have an impact on the firm’s survival, Stearns et al (1995) address the contextual conditions, focusing on three parameters: location, industry and strategy.
Hyytinen and Rouvinen, (2008) state that most of the newly born start-ups survive for a period of three years. They also stress that very small firms (including zero to four employees) and entrepreneurial ventures terminate even sooner than other larger firms. Supporting the same finding, Dunne and Hughes (1994), Stearns et al (1995) and Mata and Portugal (1994) find that death rates are higher among smaller enterprises.
Mata and Portugal (1994) also tackle the firm’s survival focusing in new firms in Portuguese manufacturing created in 1983, and they find that 20% of the newly born firms terminated in their first year of life, 50% survived for four years and only 30% of the initial population survive for 7 years.
Mata and Portugal (1994) conclusions reside on the fact that new entrants that are larger in size and also with multiple establishments are more likely to remain in the market for a longer period.
6 Such as market and growth rates.
18
3. Part-Time Entrepreneurs and Hypothesis
The reasons to enter part-time entrepreneurship are different from those who wish to enter into pure-entrepreneurship or remain in their regular job.
Previous literature suggest that the main determinants for part-time entrepreneurship is lack of financial capital (Petrova, 2005) and risk attitudes (Petrova, 2011).
A solution, for those who have the desire to engage in entrepreneurial ventures but struggle to have access to the proper funds, is to use their regular job as a way to fund their business until the business generates enough money.
Part-time entrepreneurship are seen as a risk preference because individuals might prefer, in an initial phase, to adopt a safer approach by just investing a fraction of their time into the business and minimize the loss of failure (Petrova, 2011). In this way, they diminish the uncertainty associated with entrepreneurship by pursuing their regular wage employment while testing the viability of the new venture (Folta et al., 2006). In fact, part-time entrepreneurs, in some cases, are seen as the first stage to full-time entrepreneurship (Aldrich, 1999).
Some demographic characteristics are more likely to be associated with part-time entrepreneurs than other forms of entrepreneurship. For example, Devine (1994) and Lohman (2001) show that more than 55% of the women-owned businesses worked for less than 35 hours per week. Carter and Allen (1997) specified that women working on part-time basis, were doing as a way to help with the household income. They also refer three possible reasons for why women-owned businesses are likely to be small: i) due to their lifestyles and combining work, family and community7; ii) discriminatory practices which denies them to the proper access of the necessary resources to start their business.
7 The same idea is also supported by Lohmann (2001)
19
Verheul and Thurik (2001) specified that women are more likely to work on a part-time basis and are also more involved in the service sector (Birley et al, 1988), they are more risk averse, have less financial management experience, and they have more difficulty in obtaining financial capital (either debt and equity capital). As a summary, female see part-time entrepreneurship as a solution, a better approach to manage their part-time between family and business (Carter and Allen, 1997).
According to Petrova (2011), part-time entrepreneurs do not fully commit into the business because they invest less time and capital, and their firms are normally smaller (in size) compared to full-time entrepreneurs (Parker, 2009).
Concerning credit constraint, start-ups often resort to individual and household wealth as a way of financing their own entrepreneurial activities. Petrova (2005) finds that part-time entrepreneurs “do not appear to be constrained”, in other words, it may be the case that a great deal of part-time entrepreneurs work in “less intensive sectors”. Petrova (2005) conclusions are the opposite of Evans and Jovanovic (1989) and Holtz-Eakin et al. (1992), that entrepreneurs are credit constraint. Nonetheless, Petrova (2005) highlights the fact that previous studies on entrepreneurship do not deal with part-timer entrepreneurs.
This study focus on certain founder’s variables (such as education) due to Human Capital Theory, where authors show that some certain features, like age, education and the duration in entrepreneurship, play an important role in the firm’s survival. Cooper et al (1994) find that human capital, namely education, has a great impact in both survival and growth.
20
Regarding the firm’s size, many conclude that the larger the size of a company, higher will be the firm’s survival (Mata and Portugal, 1994; Dunne and Hughes, 1994; Stearns et al, 1995; Hyytinen and Rouvinen, 2008).
In the last years, many authors have focus their study in the empirical implications of the resource based theory of the firm and how a firm's resources and capabilities can affect its performance. Resource based theory basically explains the different firm’s strategies based on the internal firm’s characteristics (Esteve-Pérez and Mañez-Castillejo, 2008). In general, a strategic resource is an asset that is valuable, rare, difficult to imitate, and nonsubstitutable (Barney, 1991), which is something that can guarantee the firm’s survival.
For this study, we measured the firm’s survival based on the firm’s size (firm’s characteristics) due to the positive and strong linkage that they have. Authors such as Mata and Portugal (1994), Dunne and Hughes (1994); Stearns et al. (1995), Hyytinen and Rouvinen (2008) conclude that the larger the size of a company, higher will be the firm’s survival.
Hypothesis 1: Part-time entrepreneur firm’s survival is lower than full-time entrepreneurs.
Hypothesis 2: More educated full-time entrepreneurs are more likely to survive compared with least educated full-time entrepreneurs.
Hypothesis 3: Start-ups with larger size established by full-time entrepreneurs are more likely to survive for a longer period in comparison with smaller start-ups stablished by full-time entrepreneurs.
Hypothesis 4: Part-time entrepreneur firm’s survival is lower than full-time entrepreneurs.
21
Hypothesis 5: More educated part-time entrepreneurs are more likely to survive compared with least educated part-time entrepreneurs.
Hypothesis 6: Start-ups with larger size established by part-time entrepreneurs are more likely to survive in comparison with smaller part-time start-ups establishments.
22
4. Data and Descriptive Statistics
4.1 Sample and Data
Our empirical analysis draws on a matched employer–employee dataset (QP – “Quadros de Pessoal”).
QP is a mandatory survey submitted annually to the Portuguese Ministry of Employment and Social Security by firms with at least one employee. This database contains detailed information on an average of 207,000 firms and two million individuals per year, which basically covers all Portuguese private sector from period of 1986 to 2009. Annually, each firm reports: year of creation, geographic location, size, industry, number of establishments, initial capital, and ownership structure (foreign ownership, government ownership and domestic ownership). At the individual level, the database contains information on gender, age, education (number of years of education and field of education), occupation, working hours, and October’s earnings, and other regular wage components.
From QP, we select all start-ups established between 2000 and 2007, and exclude nonprofit organizations. The main reason to exclude nonprofit organizations was due to the fact that most of these organizations are established by part-time entrepreneurs, and one of the reasons to engage in these specific type of entrepreneurship is that is seen as a way to gain an extra income. Also the time frame chosen was to avoid the effect of the financial crisis (2008 and 2009) had on the process of entrepreneurial establishment. And also the period chosen is consistent with the Portuguese Classification of Economic Activities, Revision 2 (CAE.Rev2). For these new firms, we identify the founders and their background history.
23
We exclude firms for which we could not identify at least one owner or the background history of the founder. Then we identify part-time entrepreneurs as individuals who are employed in wage employment and, simultaneously in, entrepreneurial ventures.
We restricted the sample to full-time and part-time founders with age between 20 and 60. Finally, we ended up with a total of 41.293 firms, where 3.69% are stablished by part-time entrepreneurs.
Table 1 (in the appendix) summarizes the descriptive statistics of our sample. In the sample, it is possible to observe that the start-ups are typically small, employing on average approximately four employees and are founded on average by nearly two entrepreneurs. Firms established, on average, in 2002 and would exit, approximately, four years later. And it is also in the service sector that most firms are concentrated (62.69%), followed by Construction (22.11%), Low-tech (12.67%), Agriculture and Fishing (2.02%) and High-tech (0.52%).
Founders are mostly men and have on average close to 38 years old.
In terms of education, almost half (45.15%) of the founders have “Low education”8, 21.03% are in the “Medium education”9, 20.78% have “Very Low education”10, and the remaining 13.05% are located in the “High education”11. The majority (97.83%) of the founders are Portuguese, and only 3.69% are part-time entrepreneurs.
In the sample, it is possible to see the differences between part-time and full-time entrepreneurs. Both type of entrepreneurs share some similarities, such as their start-ups are small, employing on average approximately four employees and are founded on average by nearly two entrepreneurs. Firms establish, on average, in 2002 and would exit,
8 This category includes all the individuals that attended junior high school.
9 This category includes all the individuals that hold a high school diploma or vocational school degree. 10 This category includes all the individuals who never attended or completed the elementary school. 11 This category includes all the Individuals with bachelors, masters or doctoral degrees
24
approximately, four years later. And it is also in the service sector that more than half of the firms are concentrated, followed by Construction, Low-tech, Agriculture and Fishing and High-tech.
More than half of the founders in this sample are men and have on average close to 36 years old for part-time entrepreneurs, and on average close to 40 for full-time entrepreneurs.
The biggest differences between both types of entrepreneurs is in the education categories, part-time entrepreneurs seem to have a higher education than full-time entrepreneurs. This is said because over half (approximately 67%) of the full-time entrepreneurs have a “Very Low Education and a “Low Education”, while a total of 49% of the part-time entrepreneurs are in those education categories.
The majority of the founders are Portuguese.
For firms that survived for a period longer than 2 years, owned by part-time entrepreneurs, they are mainly man founders (71,4%), have on average close to 37 years old, with a “Low Education” (36,9%) and most of them are in the Service Sector (68,6%).
The firms that survived for a period longer than 2 years owned by full-time entrepreneurs, they are mainly owned by man founders (72,6%), have on average close to 38 years old, hold a “Low Education” (45,5%) and most of them are in the Service Sector (61,8%). For those who have their firm’s operating for period shorter than 2 years, the features are extremely similar with those with a longer firm survival
For those who have their firm’s operating for period shorter than 2 years, they are mainly man founders (69,3%), have on average close to 36 years old, with a “Low Education” (45,5%) and most of them with in the Service Sector (61,8%).
25
5. Empirical Methodology and Results
To evaluate the performance of part-time entrepreneurs we look at the survival start-ups. We start by using use logit, probit and Ordinary Least Squares models, but, due to the specific nature of our dependent variable, we focus on the Cox Model.
We control for the variables such as founder and venture characteristics, year of entry, region and industry effects, using the following equation:
𝑆𝑗𝑦𝑖𝑟 = 𝛼𝑦+ 𝛽𝑖+ 𝛾𝑟+ 𝛽𝑃𝑗+ 𝑋𝑗′𝜃 + 𝛽 𝑆𝑖𝑧𝑒𝑟𝑖𝑦+ 𝜀𝑗𝑦𝑖𝑟
Where j denote the industry12, r for Nuts region 13and y for the entry year.
The dependent variable is (Sjyir), a dummy variable equalling 1 if the start-up is still operation after 2 years and 0 otherwise.
Our variable of interest is P a dummy variable equaling 1 if the individual is a part time entrepreneur and zero if the individual is a full-time entrepreneur. X is a vector of founder characteristics, which includes age, gender, education, and the firm’s characteristic is namely “Size”, which is measured by the logarithm of the number of initial employees. Age is divided into four different categories: (20 - 29), (30 – 39), (40 – 49) and (50 – 60). Gender is equal to one if the entrepreneur is male and zero for female. Education level is divided in four categorical variables: high education (is a dummy variable equaling one for founders with bachelors, masters or doctoral degrees); medium education (is a dummy variable equaling one for individuals reporting a high school diploma or vocational school degree); low education (is a dummy variable equaling one for individuals that attended
12 Following the CAE.Rev2, and then it was categorized into 5 industrial groups: Agriculture and Fishing, Low-technology,
High-technology, Services and Construction. The categories Low-Tech and High-Tech followed the OECD definition. “High-technology industries” include the following sectors: pharmaceuticals, office and computing machinery, radio, TV and communication equipment, medical, precision and optical equipment, aircraft and spacecraft, chemicals excluding pharmaceuticals, machinery and equipment, electrical machinery and apparatus, motor vehicles and trailers, railroad and transport equipment. “Low-technology industries” include coke, refined petroleum products and nuclear fuel, rubber and plastic products, other non-metallic mineral products, basic metals, fabricated metal products except machinery and equipment, building and repairing ships and boats, food products, beverage and tobacco, textile and textile products, leather and footwear, wood, pulp, paper products, printing and publishing, and recycling.
13 Following the NUTS II division. Nuts II divides the country in seven regions, where five of them are in the continent, and the
26
junior high school); and very low education (is a dummy variable equaling one for individuals who never attended or completed the elementary school).
We include entry dummies (αriy) fixed effects, industry14 fixed effects (βriy) and fregions15 fixed effects (θriy).
We also introduced the Cox model, which allows us to observe the relationship between firm’s survival and the different explanatory variables (such as: founder’s age, education and gender, and the firm’s size).
Table 2 presents the marginal effects of the determinants of the firm’s survival using the logit model. On the first column, we use the full-time entrepreneurs sample, in the second column we use the part-time entrepreneurs sample, the third and the fourth columns presents the results for both full-time and part-time entrepreneurs sample.
Column 1 results suggest that all older and male entrepreneurs are more likely to survive. In other words, going through one age category to another (as an entrepreneur gets older) increases the probability of survival of the company after 2 years.
However, the empirical results show that those who have a “Lower Education” and a “Higher Education” have a positive relationship with the firm’s survival and are statistically significant.
Meanwhile, the initial size of the start-up increases firm survival by 16, 4%.
Column 2 presents similar results to ones presented in column 1. The results show that relatively older founder and initially larger firms, have a higher probability of surviving. On the other hand, founder’s education and gender are not statically significant.
14Following the CAE.Rev 2 classification
27
When having both Part-time and Full-time entrepreneurs, the results are also similar to ones presented in column (1). In this situation, a Part-time entrepreneur is less likely to survive in comparison to full-time entrepreneurs..
Column (4) show the interactions between part-time entrepreneurs, age, education and the venture’s size. The results report that (in comparison to youngers and higher educated founders) the age category (40-49), least educated and the initially larger firms have a higher survival. The results report that the age group (40-49) is a significant variable to have in mind, when leading with part-time entrepreneurs. Concerning education, this variable is not as important as it was shown in the other columns, when comparing full-time entrepreneurs with part-full-time entrepreneurs. It is important to emphasize that the empirical results show that the firm’s size is an extremely important feature to have in mind for part-time entrepreneurs. In other words, higher the firm’s size, the higher will be the firm’s survival for part-time entrepreneurs.
In appendix, Table A1 and A2 present the marginal effects using the probit model and the linear probability model, respectively.
The three models show very similar results, however the main differences are in the part-time entrepreneur’s interactions (column 4), namely on the founder’s age and gender. Table 3 reports the results from the Cox Proportional Hazard Model. This model help us understand the relationship between the firm’s survival (expressed in years) and the different explanatory variables (founder’s age, education, gender, part-time/full-time entrepreneur and the firm’s size). Column 1 shows the coefficients for the full-time entrepreneurs, column 2 reports the coefficients of part-time entrepreneurs, column 3 columns presents the results for both full-time and part-time entrepreneurs and column 4 exhibits the interaction between part-time entrepreneurs with the founder’s age, gender, education and firm’s size).
28
Column 1 (for full-time entrepreneurs) reports that the firm’s survival is higher among older and men founders, and also for initially larger firms. Empirical results report that older individuals are less likely to survive.
For part-time entrepreneurs (column 2), the results show that older founders and initially larger firms have higher chances of surviving.
In Column 3, the results show that part-time entrepreneurs are less likely to survive, in comparison with the full-time entrepreneurs
In Column 4 shows the results concerning the interaction between part-time entrepreneurs with the founder’s age, education, gender and firm’s size. In this situation, it is possible to see that the age category (40-49) and the firm’s size have a higher survival. Meanwhile, those who have some education or even higher education have a lower survival rate.
In summary, empirical evidence shows that firm’s survival is higher for full-time entrepreneurs, initially larger firms, for founders that have a higher education (in comparison to the least educated for the logit model), by men (in comparison to women) and by fairly older individuals. For part-time entrepreneurs, their age and the start-ups initial size are, in comparison to full-time entrepreneurs, the most significant variables for the firm’s survival.
29
6. Conclusion
In this study we evaluate the performance of part-time entrepreneurs in terms of survival by looking at the founders demographic characteristics (age, gender and education) and the firm’s size.
Using Portuguese employer-employee database, we explore if: i) part-time entrepreneur’s performance worse than full-time entrepreneurs; ii) more educated part-time entrepreneurs are more likely to survive, and; iii) start-ups with initial larger size established by part-time entrepreneurs are more likely to survive.
We use the Logit, Probit, a Linear Probability Models and a Cox Proportional Hazard Model
to understand the main determinants of survival by controlling for the year of entry, industry and region fixed effects.
Our empirical results from logit model, probit model and the linear probability model, suggest that firm’s survival is higher among full-time entrepreneurs, initially larger firms, for founders that have a higher education (in comparison to the least educated), by men (in comparison to women) and by fairly older individuals. For part-time entrepreneur’s, only the founder’s age and the firm’s size are significant variables for the firm’s survival, meaning that the firm’s survival is higher among relatively older founders and for initially larger firms.
Concerning the Cox Model, empirical results also show that the firm’s survival is higher among older and men full-time and part-time entrepreneurs, and also for initially larger firms. This results are consistent with Audretsch (1995), Geroski, (1995), Mata and Portugal (1994) findings, which their conclusions based on the grounds that firm’s survival is higher among initially larger firms.
Nevertheless part-time entrepreneurs have a lower chances of surviving, in comparison with the full-time entrepreneurs
30
Several limitation should be examined in future studies. The limiting factor in our study is the fact that our dataset only contains data until 2009, which did not allows us to see clearly the firm’s progress in terms of survival and would be also interesting to see the effect that the financial crisis (2007 and 2008) had on the firm’s survival for both part-time and full-part-time entrepreneurs.
Also, another theme that should be exploited in the near future is to try to see the exact moment when part-time entrepreneurs transition to full-time entrepreneurs. Basically, it would be interesting to do a similar study to Folta et al (2006) but for the Portuguese part-time entrepreneurs.
This study has implications for policy makers and practitioners. A more thorough understanding on what leads a person to become a part-time entrepreneur and, possibly, transit to a full-time entrepreneurs can help policy makers to define better funding programs and policies for start-ups. On the other hand, practitioners (part-time entrepreneurs) will be able to fully understand the influence that some demographic variables and firm’s characteristics have on their firm’s survival, and the difference between full-time entrepreneurs.
31
7. Bibliography
Agarwal, R., & Audretsch, D. B. (2001). Does Entry Size Matter? The Impact of the Life Cycle and Technology on Firm Survival. The Journal of Industrial Economics, pp. 21-43.
Aldrich, H. E. (1999). Organizations Evolving. Sage Publications.
Audretcsh, D., Carree, M., Stel, A., & Thurick, R. (2005). Does Self-Employment Reduce Unemployment? pp. 1-14.
Audretsch, D. B. (1995). Innovation, growth and survival . International Journal of
Industrial Organization , pp. 441-457 .
Audretsch, D. B., & Fritsch, M. (1994). On the Measurement of,Entry Rates . Ktuwer
Academic Publishers, pp. 105-113.
Audretsch, D. B., & Thurik, R. (2001). Linking Entrepreneurship to Growth. OECD STI
Working Paper.
Barney, J. (1991). Firm resources and sustained competitive advantage. . Journal of
managemen 17, pp. 99-120.
Becker, G. S. (2009 ). Human capital: A theoretical and empirical analysis, with special
reference to education. University of Chicago Press.
Birley, S., Harris, P., & Harris, P. (1988). Female Entrepreneurs: Are They Really Any Different? Jornal of Small Business Management.
Blanchflower, D. (2000). Self Employment in OECD countries. Labour Economics, pp. 471-505.
32
Blanchflower, D. G. (2004, February). Self-Employment More may not be better.
National Bureau of Economic Research, pp. 1-59.
Blanchflower, D., & Oswald, A. (1998). What Makes an Entrepreneur? Chicago
Journals, pp. 26-60.
Bögenhold, D., & Staber, U. (1991). The Decline and Rise of Self-Employment. Work,
Employment and Society, pp. 223-239.
Carree, M. A., & Thurik, A. R. (2003). The Impact of Entrepreneurship on Economic Growth . Handbook of Entrepreneurship Research, pp. 437–471.
Carrizosa, M. (2007). Firm growth, persistence and multiplicity of equilibria: an analysis of Spanish manufacturing and service industries.
Carter, N. M., & Allen, K. R. (1997). Size determinants of women-owned businesses: choice or barriers to resources? Entrepreneurship & Regional Development: An
International Journal, pp. 211-220.
Cefis, E., & Marsili, O. (2003 ). Survivor: The Role of Innovation in Firms’ Survival.
Research in Entrepreneurship and Small Business, pp. 1-29.
Cooper, A. C., Gimeno-Gascon, F., & Woo, C. Y. (1994). Initial human and financial capital as predictors of new venture performance. Journal of Business Venturing, pp. 371–395.
Devine, T. (1994). Characteristics of Self-employment women in United States. 1-15.
Devine, T. J. (1994). Changes in Wage-and-Salary Returns to Skill and the Recent Rise in Female Self-Employment. The American Economic Review, 108-113.
33
Dunn, T., & Holtz-Eakin, D. (2000). Financial capital, human capital, and the transition to self-employment: evidence from intergenerational links. Journal of Labor
Economics, pp. 282-305.
Dunne, P., & Hughes, A. (1994). Age, Size, Growth and Survival: UK Companies in the 1980s. The Journal of Industrial Economics, pp. 115-140.
Esteve-Pérez, & Mañez-Castillejo. (2008). The Resource-based theory of the firm and firm survival. Small business economics, pp. 30:231 - 249.
Evans, D. S. (1987). The Relationship between Firm Growth, Size, and Age: Estimates for 100 Manufacoting Industries. The Journal of Industrial Economics, 567-581.
Evans, D. S., & Jovanovic, B. (1989). An Estimated Model of Entrepreneurial Choice under Liquidity Constraints. Journal of Political Economy, pp. 808-827.
Evans, D. S., & Leighton, L. S. (1989). Some Empirical Aspects of Entrepreneurship.
The American Economic Review, pp. 519-535.
Fölster, S. (2000). Do Entrepreneurs Create Jobs? Small Business Economics, pp. 137– 148.
Folta, T. B., & Delmar, F. a. (2010). Hybrid Entrepreneurship. Research Institute of
Industrial Economics, 2-39.
Folta, T. B., Delmar, F., & Wennberg, K. (2006). A Real Options Model of Stepwise Entry into Self-Employment. Frontiers of Entrepreneurship Research, 26(6), pp. 1-13.
Geroski, P. A. (1995). What do we know about entry? . International Journal of Industrial
34
Holtz-Eakin, D., Joulfaian, D., & Rosen, H. S. (1992). Entrepreneurial Decisions and Liquidity Constraints. pp. 1-37.
Hurst, E., & Lusardi, A. (2004). Liquidity Constraint, Household Wealth and Entrepreneurship. Journal of Political Economy, pp. 319-347.
Hyytinen, A., & Rouvinen, P. (2008). The labour market consequences of self-employment spells: European evidence. Labour Economics, pp. 246-271.
Jovanovic, B. (1982). Selection and the Evolution of Industry. Econometrica, 649-670.
Le, A. T. (1999). Empircal Studies of Self-employment. Jornal of Economics Surveys, 385-415.
Lohmann, H. (2001). Self-employed or employee, full-time or part-time? Gender differences in the determinants and conditions for self-employment in Europe and the US. 1-22.
Markman, G. D., & Baron, R. A. (2003). Person–entrepreneurship fit: why some people are more successful as entrepreneurs than others. Human Resources Management
Review, 281–301.
Mata, J., & Portugal, P. (1994). Life Duration of New Firms. The Journal of Industrial
Economics, pp. 227-245.
Mata, J., Portugal, P., & Guimarães, P. (1995). The survival of new plants: Start-up conditions and post-entry evolution. International Journal of Industrial
Organization , pp. 459-481 .
Parker, S. (2009). The Economics of Entrepreneurship. New York: Cambridge University Press.
35
Petrova, K. (2005). Part-Time Entrepreneurship and Wealth: New Evidence from the Panel Study of Entrepreneurial Dynamics. The World Conference Proceedings of
the International Council of Small Business, pp. 1-33.
Petrova, K. (2011). Part-Time Entrepreneurship, Learning and Ability. Journal and
Management Policy and Practice, 64-75.
Reynolds, P. D., Bygrave, W. D., & Autio, E. (2003). The Fifth Global Assessment of
National Entrepreneurial Activity. Executive Report.
Ronstadt, R. (1986). Exit, stage left why entrepreneurs end their entrepreneurial careers before retirement . Journal of Business Venturing, pp. 323–338.
Schumpeter, J. A. (1934). The Theory of Economic Development: An Inquiry Into Profits,
Capital, Credit, Interest, and the Business Cycle. Transaction Publishers.
Simon, M., & Houghton, S. M. (2003). The Relationship between Overconfidence and
the Introduction of Risky Products: Evidence from a Field Study.
Stearns, T. M., Carter, N. M., Reynolds, P. D., & Williams, M. L. (1995). New Firm Survival: industry, location and strategy. Journal of Business Venturing, pp. 23-42 .
Stewart, W., Watson, W., & Carland, J. a. (1998). A Proclivity for Entrepreneurship: a
Comparison of Entrepreneurs, Smaçç Business Owners, and Corporate Managers.
Tamásy, C. (2006). Determinants of regional entrepreneurship dynamics in contemporary Germany: A conceptual and empirical analysis. Regional Studies, pp. 365-384.
36
Van Praag, C. M., & Versloot, P. H. (2008). The Economic Benefits and Costs of
Entrepreneurship: A Review of the Research. Now Publishers Inc.
Verheul, I., & Thurik, R. (2001). Start-Up Capital: “Does Gender Matter? Small Business
Economics , pp. 329–345.
Wennekers, S., & Thurik, R. (1999). Linking Entrepreneurship and Economic Growth.
37
8. Tables
Table 1: Summary of the descriptive statistics of our sample
Total Part-time Entrepreneurs Full-time Entrepreneurs N Mean Std. N Mean Std. N Mean Std. Panel A – Firm´s Characteristics
Size 41.293 3,74 4,56 1.524 3,94 5,75 39.769 3,73 4,50 Nº Founders 41.293 1,73 0,83 1.524 1,80 0,87 39.769 1,72 0,83 Survival 41.293 4,51 2,61 1.524 4,16 2,70 39.769 4,53 2,61 Panel B – Founder’s Characteristics
Gender 41.293 0,72 0,45 1.524 0,70 0,46 39.769 0,72 0,45 Age 41.293 37,75 9,31 1.524 36,44 9,06 39.769 37,80 9,32 Education
Very Low Education 41.293 0,21 0,41 1.524 0,12 0,33 39.769 0,21 0,41 Low Education 41.293 0,45 0,50 1.524 0,37 0,48 39.769 0,45 0,50 Medium Education 41.293 0,21 0,41 1.524 0,26 0,44 39.769 0,21 0,41 High Education 41.293 0,13 0,34 1.524 0,25 0,43 39.769 0,13 0,33 Foreign 41.293 0,02 0,15 1.524 0,02 0,15 39.769 0,02 0,15 Panel C – Industry and Region Proportions
Total Part-time Entrepreneurs Full-time Entrepreneurs
N % N % N %
Industry
Agriculture and Fishing 41.293 1,98% 1.524 1,84% 39.769 1,99% Low-Tech 41.293 12,70% 1.524 10,30% 39.769 12,79% High-Tech 41.293 0,49% 1.524 0,26% 39.769 0,50% Services 41.293 62,59% 1.524 70,08% 39.769 62,31% Construction 41.293 22,23% 1.524 17,52% 39.769 22,41% Region16 Norte 41.293 35,81% 1.524 30,91% 39.769 36,00% Centro 41.293 25,94% 1.524 25,33% 39.769 25,97% Lisboa 41.293 21,86% 1.524 29,40% 39.769 21,57% Alentejo 41.293 6,75% 1.524 4,72% 39.769 6,82% Algarve 41.293 6,33% 1.524 7,15% 39.769 6,30% R.A. dos Açores 41.293 1,19% 1.524 1,51% 39.769 1,18% R.A. da Madeira 41.293 2,13% 1.524 0,98% 39.769 2,17% This table reports descriptive statistics for start-ups established between 2000 and 2007, and respective firms’ and founders’ characteristics. All data was retrieved from the database Quadros de Pessoal.
16 Following Nuts II classification. Norte includes: Minho-Lima, Cávado, Ave, Grande Porto, Tâmega, Entre Douro e Vouga, Douro
e Alto Trás-os-Montes. Centro includes: Baixo Vouga, Baixo Mondego, Pinhal Litoral, Pinhal Interior Norte, Dão-Lafões, Pinhal Interior Sul, Serra da Estrela, Beira Interior Norte, Beira Interior Sul, Cova da Beira, Oeste e Médio Tejo. Lisboa includes: Grande Lisboa e Península de Setúbal. Alentejo includes: Alentejo Litoral, Alto Alentejo, Alentejo Central, Baixo Alentejo e Lezíria do Tejo. Algarve includes: Algarve. R. A. Açores includes: Região Autónoma dos Açores. R. A. da Madeira includes: Região Autónoma da Madeira.
38
Table 2: Marginal Effects for the Firm’s Survival (Logit)
(1) (2) (3) (4)
VARIABLES Full-time Part-time Full-time & Part-time Interaction: Part-time Part-time (P) -0.0566*** (0.0125) (30-39) 0.0835*** 0.120*** 0.0847*** (0.00555) (0.0289) (0.00547) (40-49) 0.101*** 0.113*** 0.101*** (0.00574) (0.0300) (0.00566) (50-60) 0.112*** 0.153*** 0.113*** (0.00624) (0.0329) (0.00615) Man 0.0351*** 0.0206 0.0345*** (0.00515) (0.0261) (0.00506) Low Education 0.0150** -0.0157 0.0147** (0.00686) (0.0451) (0.00681) Medium Education 0.0125 0.00327 0.0130 (0.00805) (0.0478) (0.00796) High Education 0.0769*** 0.0308 0.0751*** (0.00796) (0.0478) (0.00790) Size 0.164*** 0.207*** 0.165*** (0.00637) (0.0286) (0.00631) (30-39) x P -0.00866 (0.0230) (40-49) x P 0.0482** (0.0216) (50-60) x P 0.0382 (0.0252) Man x P 0.0626* (0.0331) (Low Education) x P -0.184*** (0.0358) (Medium Education) x P -0.199*** (0.0371) (High Education) x P -0.171*** (0.0372) (Size) x P 0.161*** (0.0243) Observations 39,769 1,513 41,293 41,293
Robust standard errors in parentheses *** p<0.01, ** p<0.05, * p<0.1
Note: The table reports estimated the marginal effects for the logit model. The dependent variable is two year survival (1 if the firm survived for a period higher than 2 years, 0 if not). Entry year, region and industry fixed effects (two digit level) are included but not reported. Standard errors clustered at the company code are in parentheses.
39
Table 3: Cox Proportional Hazard Model for the Firm’s Survival (no Hazard Ratios)
(1) (2) (3) (4)
VARIABLES Full-time Part-time Full-time & Part-time Interaction: Part-time Part-time (P) 0.0531** (0.0250) (30-39) -0.144*** -0.0979 -0.142*** (0.0129) (0.0633) (0.0127) (40-49) -0.178*** -0.246*** -0.180*** (0.0141) (0.0691) (0.0139) (50-60) -0.188*** -0.200** -0.188*** (0.0165) (0.0825) (0.0162) Man -0.0769*** -0.0572 -0.0761*** (0.00982) (0.0512) (0.00965) Low Education 0.0854*** 0.0731 0.0849*** (0.0126) (0.0698) (0.0124) Medium Education 0.176*** 0.0197 0.169*** (0.0158) (0.0759) (0.0155) High Education 0.125*** 0.104 0.125*** (0.0177) (0.0756) (0.0173) Size -0.353*** -0.330*** -0.352*** (0.0121) (0.0495) (0.0119) (30-39) x P 0.00106 (0.0653) (40-49) x P -0.133* (0.0728) (50-60) x P -0.0593 (0.0955) Man x P 0.0115 (0.0581) (Low Education) x P 0.260*** (0.0725) (Medium Education) x P 0.225*** (0.0751) (High Education) x P 0.310*** (0.0750) (Size) x P -0.283*** (0.0580) Observations 35,860 1,311 37,171 37,171
Hazard Ratio Eform in parentheses *** p<0.01, ** p<0.05, * p<0.1
Note: The table reports estimated the Cox Proportional Hazard Model of the duration (in years) of the firms. Standard errors clustered at the company code are in parentheses.
40
9. Appendix
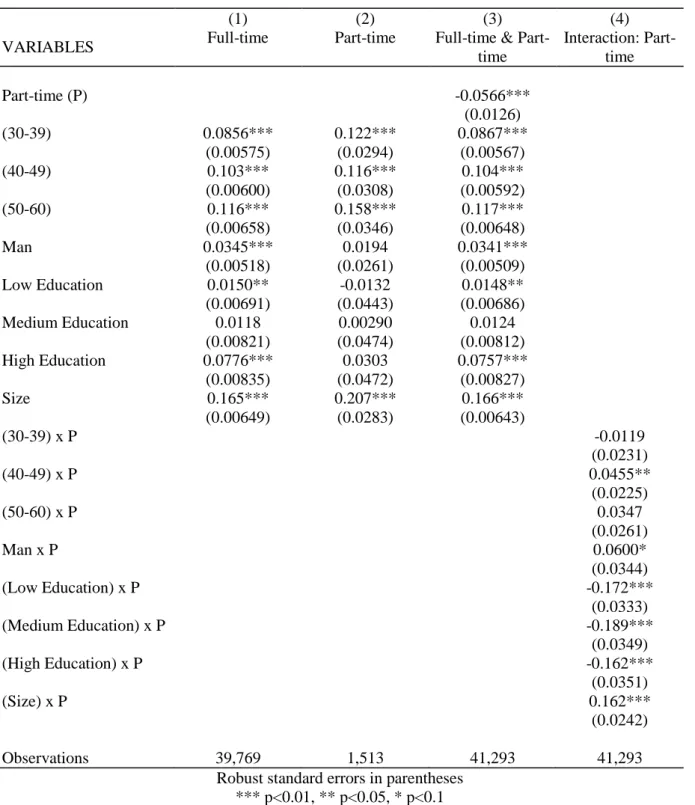
Table A1: Marginal Effects for the Firm’s Survival (Probit)
(1) (2) (3) (4)
VARIABLES Full-time Part-time Full-time & Part-time Interaction: Part-time Part-time (P) -0.0566*** (0.0126) (30-39) 0.0856*** 0.122*** 0.0867*** (0.00575) (0.0294) (0.00567) (40-49) 0.103*** 0.116*** 0.104*** (0.00600) (0.0308) (0.00592) (50-60) 0.116*** 0.158*** 0.117*** (0.00658) (0.0346) (0.00648) Man 0.0345*** 0.0194 0.0341*** (0.00518) (0.0261) (0.00509) Low Education 0.0150** -0.0132 0.0148** (0.00691) (0.0443) (0.00686) Medium Education 0.0118 0.00290 0.0124 (0.00821) (0.0474) (0.00812) High Education 0.0776*** 0.0303 0.0757*** (0.00835) (0.0472) (0.00827) Size 0.165*** 0.207*** 0.166*** (0.00649) (0.0283) (0.00643) (30-39) x P -0.0119 (0.0231) (40-49) x P 0.0455** (0.0225) (50-60) x P 0.0347 (0.0261) Man x P 0.0600* (0.0344) (Low Education) x P -0.172*** (0.0333) (Medium Education) x P -0.189*** (0.0349) (High Education) x P -0.162*** (0.0351) (Size) x P 0.162*** (0.0242) Observations 39,769 1,513 41,293 41,293
Robust standard errors in parentheses *** p<0.01, ** p<0.05, * p<0.1
Note: The table reports estimated the marginal effects for the probit model. The dependent variable is two year survival (1 if the firm survived for a period higher than 2 years, 0 if not). Entry year, region and industry fixed effects (two digit level) are included but not reported. Standard errors clustered at the company code are in parentheses.
41
Table A2: OLS for the Firm’s Survival (LPM)
(1) (2) (3) (4)
VARIABLES Full-time Part-time Full-time & Part-time Interaction: Part-time Part-time (P) -0.0561*** (0.0121) (30-39) 0.0911*** 0.121*** 0.0923*** (0.00639) (0.0310) (0.00629) (40-49) 0.113*** 0.119*** 0.114*** (0.00703) (0.0344) (0.00691) (50-60) 0.132*** 0.173*** 0.133*** (0.00838) (0.0443) (0.00826) Man 0.0342*** 0.0208 0.0338*** (0.00499) (0.0252) (0.00491) Low Education 0.0149** -0.00893 0.0147** (0.00656) (0.0406) (0.00649) Medium Education 0.0113 0.00512 0.0120 (0.00819) (0.0443) (0.00808) High Education 0.0842*** 0.0328 0.0821*** (0.00921) (0.0457) (0.00906) Size 0.156*** 0.190*** 0.157*** (0.00586) (0.0256) (0.00580) (30-39) x P 0.0455** (0.0225) (40-49) x P 0.0347 (0.0261) (50-60) x P 0.0600* (0.0344) Man x P -0.0119 (0.0231) (Low Education) x P -0.172*** (0.0333) (Medium Education) x P -0.189*** (0.0349) (High Education) x P -0.162*** (0.0351) (Size) x P 0.162*** (0.0242) Observations 39,769 1,524 41,293 41,293 R-squared 0.049 0.096 0.050 0.002
Robust standard errors in parentheses *** p<0.01, ** p<0.05, * p<0.1
Note: The table reports estimated the marginal effects for the linear probability model. The dependent variable is two year survival (1 if the firm survived for a period higher than 2 years, 0 if not). Entry year, region and industry fixed effects (two digit level) are included but not reported. Standard errors clustered at the company code are in parentheses.