Relationships between mineral composition of flowers and fruit quality in
orange trees grown in calcareous soil.
Maribela Pestana1,*, Pedro Beja2, Pedro José Correia1, Amarilis de Varennes3, Eugénio Araújo Faria1
1 Centro de Desenvolvimento de Ciências e Técnicas de Produção Vegetal, FERN,
Universidade do Algarve, Campus de Gambelas, 8005-139 Faro – Portugal.
2 ERENA, Ordenamento e Gestão de Recursos Naturais, Av. Visconde Valmôr, 11 – 3º,
1000-289 Lisboa – Portugal.
3 Instituto Superior de Agronomia, Departamento de Química Agrícola e Ambiental,
Tapada da Ajuda, 1349-017 Lisboa – Portugal.
* Corresponding author: Maribela Pestana
Telephone number: +351-289-800900 Fax number: +351-289-818419 e-mail: [email protected]
Summary
A field experiment was conducted in a commercial orange orchard (Citrus sinensis (L.) Osb. cv. ‘Valencia late’ grafted on Citrange Troyer) established on a calcareous soil in the south of Portugal, to investigate if flower analysis could be used to predict fruit quality. In April 1996, during full bloom, flowers were collected from 20 trees. In March 1997 the fruits were harvested and their quality evaluated. This procedure was repeated every year during three years.
Principal Component Analysis was used to evaluate the patterns of covariation in the concentrations of nutrients in flowers and in fruit quality parameters. Stepwise selection procedures were then used to develop regression models relating fruit quality parameters to the mineral composition of flowers. The predictive power of the regression models was evaluated using an independent set of data.
The mineral composition of flowers at full bloom could be used to predict quality parameters of fruit in the following year, namely fruit fresh weight and the maturation index. Magnesium, Ca and Zn registered in flowers were related to fruit fresh weight estimations and N, P, Mg and Fe were related to fruit maturation index. Reference values were determined for the mineral composition of flowers, corresponding to trees where fruits had a diameter > 76 mm.
Keywords: Citrus, Iron Chlorosis, Floral Analysis, Models, Nutrients, Principal
Introduction
The correction of iron chlorosis in plants grown on calcareous soils is an old problem with no easy solution (Chandra 1966, Démétriadrès et al. 1964). Obviously, the need to correct iron chlorosis is related to its effects on yield, fruit size and quality, and consequently to decreases in the growers profits. Tagliavini et al. (2000) summarized the economical impact of iron chlorosis in kiwi, peach and pear orchards established on calcareous soils in Italy, Spain and Greece, and concluded that yield losses were directly related to the intensity of iron chlorosis.
El-Kassas (1984) reported the negative effect of iron chlorosis on gross yield and fruit quality of lime, resulting in smaller fruits, more acidic and with less ascorbic acid. Iron chlorosis can also lead to a delay in fruit ripening in orange and peach (Álvarez-Férnandez et al. 2003, Pestana 2000, Pestana et al. 2001a, Pestana et al. 2002, Sanz et al. 1997b).
The correction of iron chlorosis with sprays containing iron resulted in larger oranges, representing a gain of more than 35% in the gross income of the farmer (Pestana et al. 2001a).
It is estimated that from 20 to 50% of fruit trees in the Mediterranean basin suffer from iron chlorosis (Jaegger et al. 2000). Calcareous soils are strongly buffered, with a pH between 7.5 and 8.5 and the low values of precipitation (< 500 mm), typical of these regions with arid and semi-arid climates enhance iron chlorosis (Loeppert 1986).
Until rootstocks tolerant to iron chlorosis and with other favourable agronomical characteristics become available, the prevention or correction of iron chlorosis is of paramount importance to fruit growers (For a review see Pestana et al. 2003).As a novel
approach for the prognosis of iron deficiency in pear trees, Sanz et al. (1993) proposed methods based on the mineral composition of flowers. These authors stated that floral analysis could be used to determine the nutritional status of crops at an early stage, since the mineral composition of flowers at full bloom is often related with the concentrations of the same nutrients in leaves taken 120 days later. Flower analysis has now been developed for a number of fruit trees: pear (Sanz et al. 1993, Sanz and Montañés 1995, Sanz et al. 1994), peach (Belkhodja et al. 1998, Igartua et al. 2000, Sanz et al. 1997a, Sanz and Montañés 1995), nectarine (Toselli et al. 2000), apple (Morales et al. 1998, Sanz et al. 1998), walnut
(Drossopoulos et al. 1996), olive (Bouranis et al. 1999), pistachio (Vemmos 1999), almond
(Bouranis et al. 2001), coffe-tree (Martinez et al. 2003), and citrus (Pestana et al. 2001b, Pestana et al. 2004).
Recently, Pestana et al. (2004) established a model based on the Mg:Zn ratio in flowers of orange trees that can bring forward the diagnosis of iron chlorosis from October to April. In the present work, we applied Principal Component Analysis to search for relationships between the mineral composition of orange flowers and fruit quality. We also established reference values for the mineral composition of flowers based on the values obtained in trees that produced large fruits.
Material and methods
The experimental site was on a commercial grove located in southern Portugal (37º 03´ N, 8º 23´ W; Algarve). When the experiment began, the orange trees [Citrus sinensis
(L.) Osb. cv. ‘Valencia late’ grafted on Citrange troyer (Poncirus trifoliata (L.) Raf. x
Citrus sinensis (L.) Osb.)] were 12 years old.
Soil samples were taken in the beginning of the experiment (April 1996) at a depth of 0-30 cm between tree rows, oven-dried for 48 hours at 30 oC and passed through a 2-mm sieve. Soil potassium (K) and phosphorus (P) were extracted using a solution of ammonium acetate (Riehm 1958) and sodium bicarbonate (Olsen and Sommers 1982), respectively. The P content in the extracts was quantified colorimetrically, and K by flame photometry (Isaac and Kerber 1971). Soil pH was determined in soil-water suspensions (1:2.5) and organic carbon by oxidation using dicromate (Walkley and Black 1934). Total carbonates were measured by the quantification of the CO2 produced from the reaction of the soil with
HCl (Allison and Moodie 1965), and active lime by the Drouineau method (Drouineau 1942).
Soil characteristics are presented in Table 1. The soil can be characterized as a calcareous sandy clay loam (Calcaric Fluvisol).
The climate of the region is typically Mediterranean. Total precipitation during 1996 was about 1030 mm whereas during 1997 and 1998 only 594 mm and 298 mm were recorded, respectively. Compared with a 20-year period (mean value: 514 mm) (I.N.M.G. 1991), 1996 was atypical, with more rain in January, March and December. In contrast, seasonal variation of temperatures was similar during the three years of the experiment. Maximum and minimum monthly temperatures during the three years were 23 ± 5.5ºC and 12 ± 3.8 ºC, respectively.
1. Mineral composition of flowers
Twenty orange trees were randomly selected and labelled in the spring of 1996. The experiment was carried out over three growing seasons, from April 1996 to March 1999. Each year, at full bloom (more than 75% of flowers open), 30 flowers were randomly collected per tree, irrespective of the type of the branches, in all canopy orientations. Flowers were taken from the distal part of the branches.
Flowers, including petals, sepals, reproductive parts, bracts and peduncles were washed with distilled water and dried at 60 °C for 48 h.
Plant material was grounded, ashed at 450 ºC, and digested in 10 cm3 HCl 1 mol dm-3. Standardized procedures (A.O.A.C. 1990) were used to measure nutrient concentrations. Nitrogen was analysed by the Kjeldahl method, P was determined colorimetrically by the molybdo-vanadate method, K was measured by flame photometry, and Mg, Ca, Fe, Mn and Zn were measured by atomic absorption spectrometry.
2. Fruit quality parameters
In March (1997, 1998, 1999), about 60 to 190 oranges at the same stage of maturity were collected around the canopy from the selected trees. The fruits were quickly transported to the laboratory and preserved in a refrigerator at 4 ºC. Fresh weight and diameter was determined in each fruit. The juice of each fruit was extracted with a mechanical juicer and separately analysed for total soluble solids (expressed as degree Brix), and citric acid concentration (expressed as a percentage of total juice content). All the analyses were carried out following standard methods (A.O.A.C. 1990). The
maturation index (MI) of citrus fruit was determined by the ratio between total soluble solids and citric acid concentration.
3. Statistical analysis
The experiment had a completely randomised design, and the values obtained for each tree and each parameter were considered independent replications. The number of trees sampled fell from 20 to 18 in the last year because the grower removed two trees.
The means were compared by analysis of variance and by using the Duncan Multiple Range Test at p < 0.05.
The main patterns of covariation in the variables that described the nutritional composition of flowers and fruit quality parameters were evaluated by Principal Component Analysis (PCA). This is an exploratory multivariate statistical method that reduces many variables to a small number of new derived variables. Principal components contain the same information as the original variables but have the advantage of being mutually uncorrelated so that there is no redundant information between them. Using this procedure it is also possible to reveal associations in the data that cannot be found by analysing each variable separately.
Each extracted component or factor accounts for part of the variation of all data sets, and is associated to an eigenvalue. The eigenvalue associated with each eigenvector is a measure of the variance within variables of the corresponding principal component (Legendre and Legendre 1998). For the interpretation of data, only the components with eigenvalues greater than one were kept, in agreement with the Kaiser criteria (Legendre and
Legendre 1998). To get a better appreciation of gradients in flower nutrients associated with fruit quality parameters, a varimax (normalized) rotation was applied to the PCA results. This approach makes it easier to interpret the patterns associated with any given variable of interest, as the rotation maximizes the loading of each variable in a single factorial axis.
To test if flowers could be used as a tool to assess fruit quality in orange trees, fruit parameters (fruit fresh weight and the maturation index) were related to nutrient concentrations in flowers registered at full bloom in the previous season, using multiple regression models of the form: Y = b0 + b1X1 + b2X2 +…+ bnXn. For each coefficient (b1,
b2, …bn) the standard error was also calculated. The incorporation of variables (X1...Xn) in
the models was done by stepwise backward selection to produce regression models without serious multi-collinearity. Such models have already been used to estimate relationships between yield and leaf mineral composition in carob trees (Correia et al. 2002), and between nutrient concentrations in citrus flowers and chlorophyll content later in the season (Pestana et al. 2004).
To test the regression models obtained, we used independent data from a different orchard. The nutrient concentration of flowers at full bloom and the fruit quality parameters were determined in 14 trees of ‘Valencia late’ orange trees using the procedures already described.
A new determination coefficient (R2) was calculated based on the independent data. The equation used was:
where y is the value of each observation, ymean is the mean value of all observations and y’
is the value estimated by the original model.
When a model is applied to an independent data set, different from that used for the establishment of the original model, the difference between the two R2, expresses the loss of predictive power of the model (Glantz and Slinker 1990).
Reference values were estimated by calculating the average concentration of each nutrient in flowers collected from trees that produced fruits with a diameter greater than 76 mm.
Statistical analyses, including principal component and multiple regressions were carried out using the STATISTICA software (Statsoft 1995).
Results
During the three years (1996-1998) of the experiment, the mean N concentration in flowers ranged from 20.5 to 29.7 g kg-1 dry weight (DW). Phosphorus ranged from 2.5 to
2.8 g kg-1 DW, and potassium flower mean concentrations were between 14.8 and 24.0 g kg-1 DW. Calcium and Mg were in the ranges 3.0 – 7.2 and 1.7 – 2.3 g kg-1 DW, respectively. The concentrations of micronutrients (mg of nutrient kg-1 DW) were in the
ranges 22.0 - 62.0 for Fe, 11.3 – 20.2 for Zn and 11.4-12.8 for Mn.
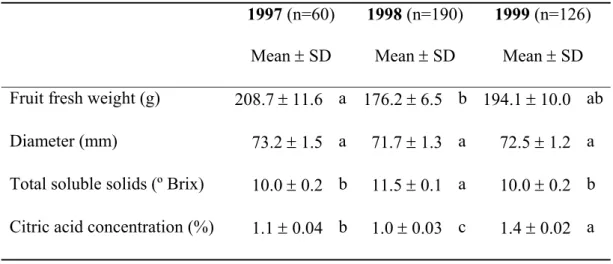
Fruit fresh weight was greater in 1997 than in 1998, with an intermediate value in 1999 (Table 2). Mean fruit diameter was similar in all the years. In 1998, total soluble
solids was greater and citric acid concentration was smaller than in 1997 and 1999. The most acidic fruits were collected in 1999.
Principal Component Analysis of flower nutrients (N, P, K, Ca, Mg, Fe, Zn and Mn) in 1996, 1997 and 1998, and quality parameters of fruits sampled in 1997, 1998 and 1999, extracted four axis with eigenvalues > 1, representing about 80% of the overall variability in the data. After the rotation of PC axis with the varimax (normalized) approach, two axis represented almost exclusively the inter-relationships between flower nutrients (not shown), whereas the other two showed the patterns associated with fruit quality parameters (Figure 1)
The first axis reflecting fruit quality represented variation in fruit size expressed as diameter and fresh weight (PC3). Fruit size was positively associated with increases of P concentration in flowers (and less strongly with increases of K, Mg and Zn) and decreases of Ca and Mn, and to a lesser extent with total soluble solids (Figure 1).
Fruit diameter (D) and fresh weight (y) were strongly related as shown in Figure 1. In fact, the value for the R2 is 0.94 (F
(1.53) = 806.2; p<0.0001) and they can be converted by the
equation (Regression coefficients are given ±SE):
y = (7.9 ± 0.3)D - (374.7 ± 20.1) (Eq. 1)
The parameters of fruit maturation, such as maturation index (MI) and citric acid (CA) were represented in a separate axis (PC4), and they were totally uncorrelated with the fruit size parameters. Increases in the maturation index were associated with decreases in
the citric acid concentration. These variations of fruit maturation parameters along this axis were associated with a nutritional gradient in flowers contrasting the increase of P with the increases of Fe, and less strongly with N, Zn and Mg (Figure 1).
Several regression models were tested to estimate fruit quality parameters based on the mineral composition of flowers at full bloom in the previous years. The best model obtained for fruit fresh weight was dependent on the concentrations of Mg, Ca and Zn (Regression coefficients are given ±SE):
y = (31.6±13.6)Mg – (17.6±2.7)Ca + (4.7±1.2)Zn + (139.6±31.6) (Eq. 2)
where y is the fruit fresh weight (g), and N (g N kg-1DW), Mg (g Mg kg-1DW), Ca (g Ca kg-1DW) and Zn (mg Zn kg-1DW) are the concentrations of these nutrients in flowers (R² = 0.46; F(3.51) = 14.8; p<0.0001). The concentration of P could be incorporated in a regression
model instead of Mg, but the equation had a lower determination coefficient (R² = 0.44; F(3.50) = 14.7; p<0.0001).
We also tested the possibility of using the nutrient composition of flowers to estimate the maturation index, since this parameter is normally used to determine the harvest date of citrus fruits. The best model included the concentrations of N, P, Mg and Fe in flowers (R2
= 0.55; F(4,50)=15.1; p<0.00001) according to the equation (Regression coefficients are
given ± SE):
where y is the maturation index, and N (g N kg-1DW), P (g P kg-1DW), Mg (g Mg kg-1DW), and Fe (mg Fe kg-1DW) are the concentrations of these nutrients in flowers.
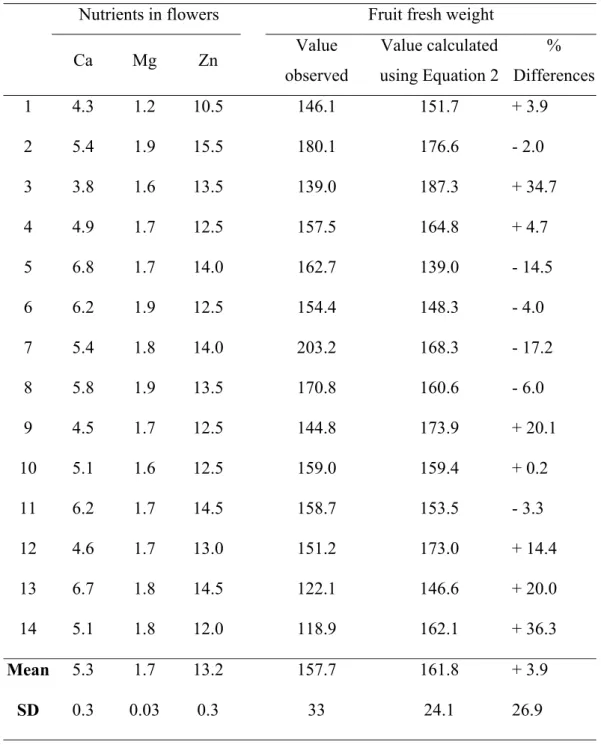
An independent set of 14 trees of ‘Valencia late’ from a different orchard was used to evaluate the predictive power of the best-fit equations. The fresh fruit weight ranged between 139 and 203 g and the maturation index from 5.4 to 8.4, respectively. While the mean observed value for the fruit fresh weight was 158 ± 33 g, the corresponding estimated value was 162 ± 24 g. There was a loss of 6% in the predictive power of the model (Table 3) as estimated by comparison of the R2 of the model (0.46) with the calculated R2 using the independent data (0.40).
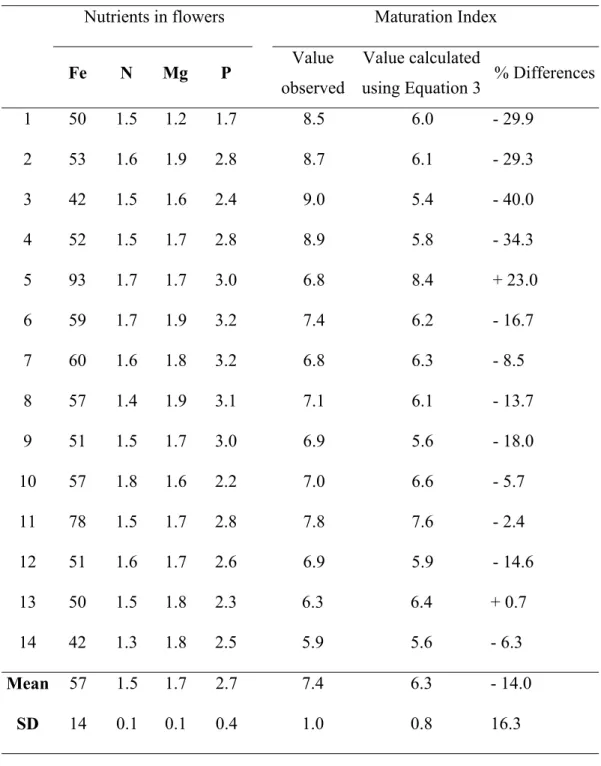
For the maturation index, the mean observed value of the independent data was 6.3 ± 1.5 while the mean estimated by the model was 7.4 ± 1.5. The model explained 55% of the variability of the original data set, but when the independent data set was used, the R2
dropped to 0.28, indicating a reduction of 27% in its predictive power (Table 4).
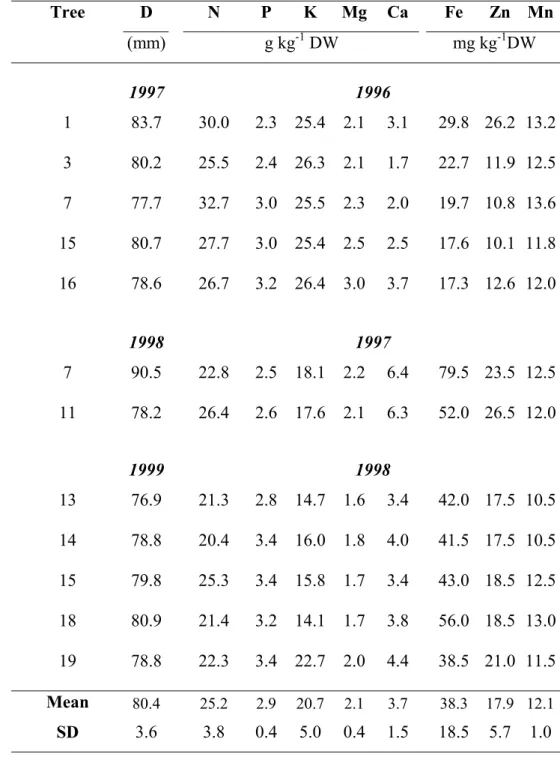
To establish reference values for the mineral composition of flowers, the mean values for the nutrient concentration of flowers from trees that produced fruits with a diameter greater than 76 mm (class of commercial fruits with the highest price) were calculated (Table 5).
The values for macronutrients (in g kg-1 DW ± SD) were: N – 25.2 ± 3.8); P – 2.9 ±
0.4; K – 20.7 ± 5.0; Mg – 2.1 ± 0.4; and Ca – 3.7 ± 1.5. The values for micronutrients (in mg kg-1 DW ± SD) were: Fe – 38.3 ± 18.5; Zn – 17.9 ± 5.7; and Mn – 12.1 ±1.0.
Discussion
Based on analysis of the mineral composition of flowers, it was possible to estimate fruit quality parameters, namely fruit diameter and fresh weight and the maturation index, parameters that are affected by iron chlorosis (Sanz et al. 1997b).
The fresh weight of fruits was positively related with their diameter. The fruit weight is normally determined by the amount of juice, which is limited, among other factors, by the diameter of the fruit (Fernández 1995). The variation of the two parameters was associated to a nutritional gradient that contrasted the increase of P, K, Mg and Zn with the increase of Ca and Mn concentrations in the flowers.
In accordance with the regression model established, the concentrations of Mg, Ca and Zn in the flowers could be used to predict the fruit fresh weight in the following year. While the concentrations of Zn and Mg in the flowers had a positive effect, Ca showed an inverse trend. This means that, high concentrations of Mg and Zn, and low concentrations of Ca in the flowers collected in April, were associated with large fruits formed on those trees.
Carranca et al. (1993) obtained positive relationships between the size of ‘Valencia Late’ oranges and the concentration of Mg in the leaves of fruiting branches, which may express a similar behaviour as in flowers. The fact that the present model includes the concentrations of Mg and Zn in the flowers strengthens the importance of these nutrients in citrus grown in calcareous soils. In fact, Pestana et al. (2004) already developed a model based on Mg and Zn in citrus flowers to estimate the concentration of chlorophyll in leaves, 90 days after full bloom.
The maturation index (MI) is used to evaluate the maturation of the fruits, which is characterized by variations in the composition and concentration of some juice components (Spiegel-Roy and Goldschmidt 1996). The variation of the MI was related to a nutritional gradient that contrasted the increase of P with the increases of Fe, N, Zn and Mg concentrations in the flowers.
It was possible to estimate the MI of oranges based on the concentrations of Fe, N, Mg and P in the flowers. However, the predictive power of this model (equation 3) dropped 27% when tested with independent data, suggesting that the maturation index also depends on factors other than the nutritional status of the trees, such as climatic conditions during fruit growth.
Increases of N, Mg and Fe in flowers lead to a greater MI. The behaviour of Fe is in accordance with the fact that fruits from trees suffering from iron chlorosis mature later (Pestana et al. 2001a, Pestana et al. 2002). Iron affects the percentage of citric acid in the juice, due to its role on aconitase activity (Sadka et al. 2000). The concentration of P in the flowers had an inverse effect comparing with the other elements. In citrus, P concentration is higher in flowers than in leaves (Pestana et al. 2004) and based on PCA it is possible to assume that P dynamics in fruit may be associated with citric acid, which is known to decrease during fruit maturation (Spiegel-Roy and Goldschmidt 1996). It seems that Mg plays an important role in fruit quality, since it is positively related with fresh weight and maturation index (equations 2 and 3). Magnesium tends to accumulate at an uniform rate in fruit (Shear 1980) and can compete with Ca for uptake and translocation, facts that may
explain the positive relationship between Mg and fruit fresh weight and also the inverse trend between this parameter and Ca.
The use of flowers to diagnose iron chlorosis brings forward the evaluation of the nutritional status from October (the recommended date for leaf sampling in Citrus) to April (Pestana et al. 2004). However, the establishment of reference values for each species and variety is needed for this purpose. Reference values are normally determined taking into account the yield of each tree (Sanz and Montañés 1995). Since in this experiment it was not possible to obtain fruit production from each selected tree, the concentrations of the elements that are proposed as reference values for flowers of orange trees were calculated based on flowers that originated fruits with large diameters (> 76 mm) and commercial value. We believe that this approach can be used to evaluate the results of floral analysis, because it is based on nutritional balances that lead to high quality.
Conclusions
The mineral composition of flowers during full bloom in a particular year may be used to estimate quality parameters of fruits collected in the following year, namely fruit fresh weight and the maturation index. These results were validated through the interpolation of external and independent data. Based on the proposed models, it is possible to correct the nutritional status of trees before yield is affected. Reference values for floral analysis were established based on trees that produce fruits with large diameters (>76 mm).
Acknowledgments
This work was supported by the POCTIA project 528/2003 and by the CDCTPV (I&D Unity nº 1584). We thank Mr. Nuno Correia and Mr. Dias Rafael for the use of their orchards.
References
A.O.A.C. 1990. Association of Official Agricultural Chemists. Official Methods of Analysis., Washington, D.C.
Allison, L.E. and C.D. Moodie 1965. Carbonates. In Methods of soil analysis. Part 2. Agronomy monograph. Eds. C.A. Black. ASA, CSSA and SSSA, Madison, WI, pp 1379-1400.
Belkhodja, R., Morales, F., Sanz, M., Abadía, A. and J. Abadía 1998. Iron deficiency in peach trees: effects on leaf chlorophyll and nutrient concentrations in flowers and leaves. Plant and Soil 203: 257-268.
Bouranis, D.L., Chorianopoulou, S.N., Zakynthinos, G., Sarlis, G. and J.B. Drossopoulos 2001. Flower analysis for prognosis of nutritional dynamics of almond tree. J. Plant Nutr. 24(4&5): 705-716.
Bouranis, D.L., Kitsaki, C.K., Chorianopoulou, S.N., Aivalakis, G. and J.B. Drossopoulos 1999. Nutritional diagnosis of olive tree flowers. J. Plant Nutr. 22(2): 245-257. Carranca, C.F., Baeta, J. and M.A.C. Fragoso 1993. Effect of NK fertilization on leaf
nutrient content and fruit quality of 'Valencia late' orange trees. In Optimiztion of plant nutrition. Eds. M.A.C. Fragoso and M.L. van Beusichem. Kluwer Academic publishers, Dordrecht, Netherlands, pp 445-448.
Chandra, L. 1966. Responses of rough lemon and trifoliata orange crown in calcareous and noncalcareous soils. Advancing Frontiers of Plant Sciences 13: 187-193.
Correia, P.J., Anastácio, I., Candeias, M.F. and M.A. Martins-Loução 2002. Nutritional diagnosis in carob-tree (Ceratonia siliqua L.): relationships between yield and leaf mineral concentration. Crop Sci. 42(5): 1577-1583.
Démétriadrès, S.D., Gavalas, N.A. and S.E. Papadopoulos 1964. Trials for the control of the lime-induced chlorosis in fruit trees in Greece. I. Preliminary observations on peach and lemon trees. Annual Institute Phytopathologie 7: 28-36.
Drossopoulos, J.B., Kouchaji, G.G. and D.L. Bouranis 1996. Seasonal dynamics of mineral nutrients by walnut tree reproductive organs. J. Plant Nutr. 19(2): 421-434.
Drouineau, J. 1942. Dosage rapid du calcaire actif des sols. Annals Agronomy 1942: 441-450.
El-Kassas, S.E. 1984. Effect of iron nutrition on the growth, yield, fruit quality, and leaf composition of seeds balady lime trees grown on sandy calcareous soils. J. Plant Nutr. 7(1-5): 301-311.
Fernández, J.L. 1995. La naranja, composición y cualidades de sus zumos y esencias. Generalitat Valenciana, Valencia, Spain, 415 p.
Glantz, S. and B.K. Slinker 1990. Primer of applied regression and analysis of variance. McGraw-Hill, Inc., New York, USA, 759 p.
I.N.M.G. 1991. Normais climatológicas da região do "Alentejo e Algarve" correspondentes a 1951-1980, O Clima de Portugal. Instituto Nacional de Meteorologia e Geofísica, Lisbon, Portugal, pp 98.
Igartua, E., Grasa, R., Sanz, M., Abadía, A. and J. Abadía 2000. Prognosis of iron chlorosis from the mineral composition of flowers in peach. J. Hort. Sci. & Biotec. 75(1): 111-118.
Isaac, R.A. and J.D. Kerber 1971. Atomic absorption and flame photometry: Techniques and uses in soil, plant, and water analysis. In Instrumental methods for analysis of soils and plant tissue. Eds. L.M. Walsh. Soil Science Society of America, Madison, WI., pp 17-37.
Jaegger, B., Goldbach, H. and K. Sommer 2000. Release from lime induced iron chlorosis by CULTAN in fruit trees and its characterisation by analysis. Acta Hortic.(ISHS) 531: 107-113.
Legendre, P. and L. Legendre 1998. Numerical ecology. Elsevier, Amesterdam, The Dordrecht, Netherlands, 853 p.
Loeppert, R.H. 1986. Reactions of iron and carbonates in calcareous soils. J. Plant Nutr. 9(3-7): 195-214.
Martinez, H.E.P., Souza, R.B., Abadía, J., Venegas, V.H. and M. Sanz 2003. Coffee-tree floral analysis as a mean of nutritional diagnosis. J. Plant Nutr. 26(7): 1467-1482. Morales, F., Grasa, R., Abadía, A. and J. Abadía 1998. Iron chlorosis paradox in fruit trees.
J. Plant Nutr. 21(4): 815-825.
Olsen, R.A. and L.E. Sommers 1982. Phosphorus. In Methods of soil analysis. Part 2. Eds. A.L. Page, R.H. Miller and D.R. Keeney. Soil Sci. Soc. Am. Inc., Madison, WI, pp 403-430.
Pestana, M. 2000. Caracterização fisiológica e nutritiva da clorose férrica em citrinos. - Avaliação dos mecanismos de resistência aos efeitos do HCO3--. PhD Thesis,
Universidade do Algarve, Faro, Portugal, 223 p.
Pestana, M., Correia, P.J., de Varennes, A., Abadía, J. and E.A. Faria 2001a. Effectiveness of different foliar applications to control iron chlorosis in orange trees grown on a calcareous soil. J. Plant Nutr. 24(4&5): 613-622.
Pestana, M., Correia, P.J., de Varennes, A., Abadía, J. and E.A. Faria 2001b. The use of floral analysis to diagnose the nutritional status of oranges trees. J. Plant Nutr. 24(12): 1913-1923.
Pestana, M., Correia, P.J., Miguel, M.G., de Varennes, A., Abadía, J. and E.A. Faria 2002. Foliar treatments as a strategy to control iron chlorosis in orange trees. Acta Hort. (ISHS) 594: 223-228.
Pestana, M., de Varennes, A. and E.A. Faria 2003. Diagnosis and correction of iron chlorosis in fruit trees: a review. Food, Agriculture & Environment 1(1): 46-51. Pestana, M., de Varennes, A., Goss, M.J., Abadía, J. and E.A. Faria 2004. Floral analysis as
a tool to diagnose iron chlorosis in orange trees. Plant and Soil 259(1-2): 287-295. Riehm, H. 1958. Die ammoniumlaktatessigsaure-methode zur bestimmung der
leichtloslichen phosphosaure in karbonathaltigen boden. Agrochimica 3: 49-65. Sadka, A., Dahan, E., Cohen, L. and K.B. Marsh 2000. Aconitase activity and expression
Sanz, M., Belkhodja, R., Toselli, M., Montañés, L., Abadía, A., Tagliavini, M., Marangoni, B. and J. Abadía 1997a. Floral analysis as a possible tool for prognosis of iron deficiency in peach. Acta Hort. (ISHS) 448: 241-245.
Sanz, M., Carrera, M. and L. Montañés 1993. El estado nutricional del peral. Possibilidad del diagnóstico floral. Hortofruticultura, 10: 60-62.
Sanz, M. and L. Montañés 1995. Flower analysis as a new approach to diagnosing the nutritional status of the peach tree. J. Plant Nutr., 18(8): 1667-1675.
Sanz, M., Montañés, L. and M. Carrera 1994. The possibility of using flower analysis to diagnose the nutritional status of pear trees. Acta Hort. (ISHS) 367: 290-295.
Sanz, M., Pascual, J. and J. Machín 1997b. Prognosis and correction of iron chlorosis in peach trees: Influence on fruit quality. J. Plant Nutr., 20(11): 1567-1572.
Sanz, M., Pérez, J., Pascual, J. and J. Machín 1998. Prognosis of iron chlorosis in apple trees by floral analysis. J. Plant Nutr., 21(8): 1697-1703.
Shear, C.B. 1980. Interactions of nutrition and environmenton mineral composition of fruits. In Mineral Nutrition of Fruit Trees. Eds. D. Atkinson, J.E. Jackson and R.O. Sharples. Buttersworths, London, pp 41-50.
Spiegel-Roy, P. and E.E. Goldschmidt 1996. Biology of Citrus. Cambridge University Press, Cambridge, UK, 230 p.
Statsoft 1995. STATISTICA General Conventions And Statistics., Vol. I. Statsoft, Inc., Tulsa.
Tagliavini, M., Abadía, J., Rombolà, A.D., Abadía, A., Tsipouridis, C. and B. Marangoni 2000. Agronomic means for the control of iron chlorosis in deciduous fruit trees. J. Plant Nutr., 23(11-12): 2007-2022.
Toselli, M., Marangoni, B. and M. Tagliavini 2000. Iron content in vegetative and reproductive organs of nectarine trees in calcareous soils during the development of chlorosis. European Journal of Agronomy, 13(4): 279-286.
Vemmos, S.N. 1999. Mineral composition of leaves and flower buds in fruiting and non-fruiting pistachio trees. J. Plant Nutr., 22(8): 1291-1301.
Walkley, A. and I.A. Black 1934. An examination of the Degtjareff method for determining soil organic matter and a proposed modification of the chromic acid titration method. Soil Science, 37: 29-38.
Table 1 – Chemical and physical parameters of the soil at the beginning of the experiment (April 1996). Parameters values Potassium (mg K kg-1) 398 Phosphorus(mg P kg-1) 166 Organic carbon (%) 1.2 Total lime (%) 17 Active lime (%) 9 pH (H2O) 7.7 Sand (%) 60 Silt (%) 11 Clay (%) 29
Table 2 – Mean value and standard deviation (SD) for some fruit quality parameters
registered in March (1997, 1998 and 1999). In each row, means followed by the same letter were not significant different - p<0.05 (Duncan test).
1997 (n=60) 1998 (n=190) 1999 (n=126)
Mean ± SD Mean ± SD Mean ± SD Fruit fresh weight (g) 208.7 ± 11.6 a 176.2 ± 6.5 b 194.1 ± 10.0 ab Diameter (mm) 73.2 ± 1.5 a 71.7 ± 1.3 a 72.5 ± 1.2 a Total soluble solids (º Brix) 10.0 ± 0.2 b 11.5 ± 0.1 a 10.0 ± 0.2 b Citric acid concentration (%) 1.1 ± 0.04 b 1.0 ± 0.03 c 1.4 ± 0.02 a
Table 3 – The concentrations of Ca, Mg and Zn in flowers of citrus and the values of
calculated and observed for fruit fresh weight. SD – standard deviation. Nutrients in flowers Fruit fresh weight
Ca Mg Zn Value observed Value calculated using Equation 2 % Differences 1 4.3 1.2 10.5 146.1 151.7 + 3.9 2 5.4 1.9 15.5 180.1 176.6 - 2.0 3 3.8 1.6 13.5 139.0 187.3 + 34.7 4 4.9 1.7 12.5 157.5 164.8 + 4.7 5 6.8 1.7 14.0 162.7 139.0 - 14.5 6 6.2 1.9 12.5 154.4 148.3 - 4.0 7 5.4 1.8 14.0 203.2 168.3 - 17.2 8 5.8 1.9 13.5 170.8 160.6 - 6.0 9 4.5 1.7 12.5 144.8 173.9 + 20.1 10 5.1 1.6 12.5 159.0 159.4 + 0.2 11 6.2 1.7 14.5 158.7 153.5 - 3.3 12 4.6 1.7 13.0 151.2 173.0 + 14.4 13 6.7 1.8 14.5 122.1 146.6 + 20.0 14 5.1 1.8 12.0 118.9 162.1 + 36.3 Mean 5.3 1.7 13.2 157.7 161.8 + 3.9 SD 0.3 0.03 0.3 33 24.1 26.9
Table 4 – The concentrations of Fe, N, Mg and P in flowers of citrus and calculated and
observed for the maturation index. SD – standard deviation.
Nutrients in flowers Maturation Index
Fe N Mg P Value
observed
Value calculated
using Equation 3 % Differences
1 50 1.5 1.2 1.7 8.5 6.0 - 29.9 2 53 1.6 1.9 2.8 8.7 6.1 - 29.3 3 42 1.5 1.6 2.4 9.0 5.4 - 40.0 4 52 1.5 1.7 2.8 8.9 5.8 - 34.3 5 93 1.7 1.7 3.0 6.8 8.4 + 23.0 6 59 1.7 1.9 3.2 7.4 6.2 - 16.7 7 60 1.6 1.8 3.2 6.8 6.3 - 8.5 8 57 1.4 1.9 3.1 7.1 6.1 - 13.7 9 51 1.5 1.7 3.0 6.9 5.6 - 18.0 10 57 1.8 1.6 2.2 7.0 6.6 - 5.7 11 78 1.5 1.7 2.8 7.8 7.6 - 2.4 12 51 1.6 1.7 2.6 6.9 5.9 - 14.6 13 50 1.5 1.8 2.3 6.3 6.4 + 0.7 14 42 1.3 1.8 2.5 5.9 5.6 - 6.3 Mean 57 1.5 1.7 2.7 7.4 6.3 - 14.0 SD 14 0.1 0.1 0.4 1.0 0.8 16.3
Table 5 – Values of fruit diameter (D) and mineral composition of flowers used to
calculate the reference values of nutrients in flowers. SD – standard deviation; DW – dry weight. Tree D N P K Mg Ca Fe Zn Mn (mm) g kg-1 DW mg kg-1DW 1997 1996 1 83.7 30.0 2.3 25.4 2.1 3.1 29.8 26.2 13.2 3 80.2 25.5 2.4 26.3 2.1 1.7 22.7 11.9 12.5 7 77.7 32.7 3.0 25.5 2.3 2.0 19.7 10.8 13.6 15 80.7 27.7 3.0 25.4 2.5 2.5 17.6 10.1 11.8 16 78.6 26.7 3.2 26.4 3.0 3.7 17.3 12.6 12.0 1998 1997 7 90.5 22.8 2.5 18.1 2.2 6.4 79.5 23.5 12.5 11 78.2 26.4 2.6 17.6 2.1 6.3 52.0 26.5 12.0 1999 1998 13 76.9 21.3 2.8 14.7 1.6 3.4 42.0 17.5 10.5 14 78.8 20.4 3.4 16.0 1.8 4.0 41.5 17.5 10.5 15 79.8 25.3 3.4 15.8 1.7 3.4 43.0 18.5 12.5 18 80.9 21.4 3.2 14.1 1.7 3.8 56.0 18.5 13.0 19 78.8 22.3 3.4 22.7 2.0 4.4 38.5 21.0 11.5 Mean 80.4 25.2 2.9 20.7 2.1 3.7 38.3 17.9 12.1 SD 3.6 3.8 0.4 5.0 0.4 1.5 18.5 5.7 1.0
PC3 PC4 D TSS Nf Pf Mgf Caf Znf MI -1.0 -0.8 -0.6 -0.4 -0.2 0.0 0.2 0.4 0.6 0.8 1.0 -1.0 -0.8 -0.6 -0.4 -0.2 0.0 0.2 0.4 0.6 0.8 1.0 FFW Kf CA Fef Mnf
Figure captions
Figure 1 – Rotated axis (varimax normalized) of a Principal Component Analysis of
nutrients in flowers during three consecutive years (1996, 1997 and 1998) and quality parameters of fruits sampled the following year (1997, 1998 and 1999). FFW – fruit fresh weight; D - diameter; TSS - total soluble solids; MI – maturation index; CA – citric acid concentration; Nf, Kf, Pf, Mgf, Caf, Fef, Znf, Mnf – concentration of nutrients in flowers. Vectors represent the variables (nutrients and fruit quality parameters) loadings in each principal component, which are proportional to the relative contribution of each variable to that component. The axis shown herein are those reflecting variation in fruit quality parameters (PC3 and PC4).