IRRIGATION FREQUENCY ON ECONOMIC PERFORMANCE AND
PRODUCTIVITY OF TOMATO IN THE COAST OF CEARÁ, BRAZIL
1MARIO DE OLIVEIRA REBOUÇAS NETO2*, BENITO MOREIRA DE AZEVEDO3, THALES VINÍCIUS VIANA DE ARAÚJO3, DENISE VIEIRA DE VASCONCELOS3, CARLOS NEWDMAR VIEIRA FERNANDES4
ABSTRACT - The objective of this work was to technically and economically evaluate the productivity of
tomato grown under different irrigation frequencies in the coast of Ceará, Brazil. The experiment was conducted in the experimental area of the Federal University of Ceará, Fortaleza, State of Ceará, Brazil, from August to December of 2011 and 2012. A randomized block experimental design was used in the two crop cycles, with six irrigation frequencies, consisted of 2 (F2), 3 (F3), 4 (F4), 5 (F5), 6 (F6) and 7 (F7) days of interval between irrigations, and four replications. The treatments were evaluated at twenty days after transplanting (DAT), when the plants were fully acclimated to the field. The harvesting began at seventy DAT and ended at ninety DAT. The variables analyzed were fruit length, diameter and weight, number of fruits per plant and fruit yield. The economic performance of the crop was also evaluated. Tomato producers of the
coastal region of the State of Ceará, who aim to increase economic return, i.e., net income, must adopt a two
-day irrigation frequency (F2).
Keywords: Lycorpersicum esculentum. Irrigation management. Production.
FREQUÊNCIA DE IRRIGAÇÃO NO DESEMPENHO ECONÔMICO E PRODUTIVO DO TOMATEIRO NO LITORAL CEARENSE
RESUMO- Objetivou-se, com esse trabalho, a avaliação técnica e econômica da produtividade do tomateiro cultivado com diferentes frequências de irrigação no litoral cearense. O experimento foi conduzido em campo na área experimental da Universidade Federal do Ceará, Fortaleza, Ceará, durante o período de agosto a dezembro nos anos de 2011 e de 2012. O delineamento experimental utilizado nos dois ciclos de avaliações foi de blocos ao acaso, composto de seis tratamentos equivalentes às frequências de irrigação: F2 (dois dias); F3
(três dias); F4 (quatro dias), F5 (cinco dias), F6 (seis dias) e F7 (sete dias), com quatro repetições. Aos vinte
dias após o transplantio (DAT), quando as plantas já estavam aclimatizadas no campo, foram diferenciados os tratamentos. A colheita se iniciou aos setenta DAT e foi concluída aos noventa DAT. Foram analisadas as seguintes variáveis: comprimento, diâmetro e massa do fruto, número de frutos por planta e a produtividade, sendo também realizada a análise econômica do cultivo. Os produtores da região litorânea do estado do Ceará, que visem um maior rendimento econômico quanto a receita liquida devem adotar uma Frequência de irrigação de dois dias (F2).
Palavras-chave: Lycorpersicum esculentum. Manejo de irrigação. Produção.
____________________
*Corresponding author
1Received for publication in 06/03/2016; accepted in 02/01/2017. Paper extracted from the first author’s doctoral thesis, financed by CNPq. 2Instituto Federal do Piauí, Campo Maior, PI, Brazil; [email protected].
3Department of Agricultural Engineering, Universidade Federal do Ceará, Fortaleza, CE, Brazil; [email protected], [email protected], [email protected].
INTRODUCTION
Tomato (Lycopersicum esculentum Mill.) is
originally from the Andean region, Ecuador to northern Chile (HIGUTI et al. 2010). It is the second most important vegetable grown in Brazil (RONCHI et al., 2010). The tomato production in the Northeast of Brazil was 611.7 thousand Mg, and the state of Ceará had the Northeast third largest production
(114.5 thousand Mg), with a planted area of 2.2 thousand hectares, in 2013 (IBGE, 2013).
Water is scarce in the Northeast of Brazil, and rainfall distribution throughout the year does not adequately supply the water needs of crops in most of its states, affecting the growth and development of plants (FAGAN et al., 2009).
Thus, irrigation management for vegetables is needed, meaning to define the irrigation type, amount and timing, aiming to increase productivity and quality of plants and maximize water use efficiency (MAROUELLI; SILVA; SILVA, 2008).
Proper management of nutrition, supplying of water, use of improved cultivars and phytosanitary measures are required to obtain high fruit yields and consequently, economic returns with tomato crops (SILVA et al., 2013). The supplying of water is one of the main of these factors due to its great effect on growth, development and production characteristics of tomato (SANTANA; VIEIRA; BARRETO, 2009). Thus, irrigation increases productivity and improve fruit quality, which may result in better
prices in the market (LIMA JÚNIOR et al., 2011). The required irrigation frequency by crops depends on the local climate, amount of water that can be stored in the soil after irrigation (BERNARDO; SOARES; MANTOVANI, 2009), effective depth of the plant root system and soil area covered (SEPASKHAH; AHMADI, 2010).
Researches have shown the effects of carefully managed irrigations, presenting their contributions to increase yield of several vegetables and improve product quality (CARVALHO et al., 2011; SILVA et al., 2014).
In this context, the objective of this work was to technically and economically evaluate the productivity of tomato grown under different irrigation frequencies in the coast of Ceará, Brazil.
MATERIAL AND METHODS
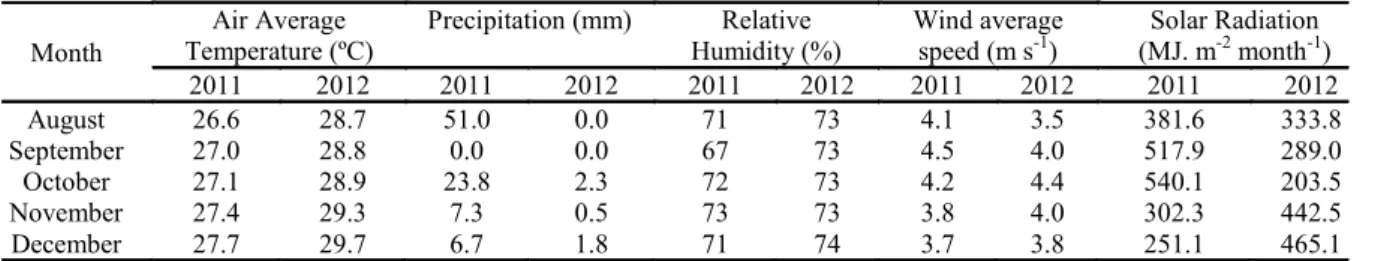
Field experiments were conducted from August to December of 2011 and 2012 in the experimental area of the Agrometeorological Station of the Federal University of Ceará (UFC), Fortaleza, State of Ceará (CE), Brazil (3°44'45''S, 38°34'55''W and 20 m of altitude). According to the classification of Köppen, the climate of the region is type Aw', tropical rainy. The monthly data of the climatic variables collected during the experiments are shown in Table 1.
Table 1. Monthly data of the climatic variables during the conduction of the experiments.
Month
Air Average Temperature (ºC)
Precipitation (mm) Relative Humidity (%)
Wind average speed (m s-1)
Solar Radiation (MJ. m-2 month-1)
2011 2012 2011 2012 2011 2012 2011 2012 2011 2012
August 26.6 28.7 51.0 0.0 71 73 4.1 3.5 381.6 333.8
September 27.0 28.8 0.0 0.0 67 73 4.5 4.0 517.9 289.0
October 27.1 28.9 23.8 2.3 72 73 4.2 4.4 540.1 203.5
November 27.4 29.3 7.3 0.5 73 73 3.8 4.0 302.3 442.5
December 27.7 29.7 6.7 1.8 71 74 3.7 3.8 251.1 465.1
Source: Agrometeorological Station of the Federal University of Ceará.
The soil of the experimental area was
classified as Red-Yellow Argissolo of sandy-loam
texture (EMBRAPA, 2006). Composite soil samples
were collected from the layer 0.0-0.2 m before the
implementation of the experiments. The soil
presented mean field capacity of 7.52 (g 100 g-1),
mean permanent wilt point of 4.52 (g 100 g-1),
specific mass of 1.43 g cm-3, 113 g kg-1 of clay, 96 g kg-1 of silt, 386 g kg-1 of fine sand and
405 g kg-1 of coarse sand.
The tomato type “persimmon” of the company Topseed, a dominant F1 hybrid, which presents indeterminate growth habit, was used. The
seeds were sowed manually in 128-cell polystyrene
trays, on July 15, 2011 and July 17, 2012. The seedlings were transplanted to the field, with spacing
of 0.5 m between plants and 1.0 m between rows, 26 days after sowing. A water depth of 13.3 mm was
applied after transplanting based on the
Penman-Monteith (ETo) equation (Equation 01)
(ALLEN et al., 1998) and on the coverage factor, so that the seedlings were established in the field through the acclimatization process. The effects of the different irrigation frequencies were assessed at twenty days after transplanting (DAT), when the plants were fully acclimated to the field.
A randomized block experimental design was used in the two crop cycles, with six irrigation frequencies, consisted of 2 (F2), 3 (F3), 4 (F4), 5 (F5), 6 (F6) and 7 (F7) days of interval between irrigations, and four replications.
inserted into polyethylene tubes and flow of 4 liters per hour was used.
A deep plowing (approximately 30 cm) followed by two cross harrowing was carried out in the area before the transplanting of tomato seedlings. Afterwards, the area was cleaned with a rake, aiming to remove cultural remains from the soil, which could affect the installation of the irrigation system or application of the treatments. The terrain was
manually leveled and the plant rows (20-cm-high
and 30-cm-wide) were arranged to enable a greater
deepening of the plant roots.
Soil fertilization consisted of applications of
nitrogen (N) (urea) and of potassium (K2O)
(potassium chloride). One third of the total nitrogen (urea) (11.11 g per hole) and total potassium (potassium chloride) (11.11 g per hole) was applied
before planting, and two thirds of the N and K2O
split in 11 applications, via fertigation, representing a total of 300 kg ha-1 of N and 300 kg ha-1 of K
2O,
following the recommendations of the Campinas Agronomic Institute (RAIJ et al., 1997). Phosphorus (simple superphosphate) was applied in a single application (56 g per hole) before planting,
representing 200 kg ha-1 of P
2O5, following the
recommendations of Alvarenga (2004).
The irrigation depth (Di) used was the same
of the evapotranspiration estimated by the
Penman-Monteith equation (Equation 01) (ALLEN
et al., 1998), based on data obtained by a fully equipped automated meteorological station, installed near the experimental area.
(1)
in which ETo is the reference evapotranspiration
(mm day-1); S is the slope vapor pressure curve
(kPa ºC-1); γ is the psychometric coefficient
(kPa ºC-1); Rn is the radiation balance (MJ m-2 day-1); G is the heat flow in the soil (MJ m-2 day-1); T is the
daily average temperature (ºC); U2is the wind speed
at a height of 2 m (m s-1); e
sis the saturation vapor
pressure (kPa); eais the partial vapor pressure(kPa);
and is the vapor pressure deficit.
The irrigation water management was based on the daily accumulated water depth, i.e., the total amount of water applied to each treatment was the same, but it was divided into applications of different amounts depending on the irrigation frequency of each treatment.
The time of irrigation for each treatment was calculated by the Equation 02,
(2)
𝐸𝑇𝑜=0.408 ∆ Rn−G +γ 900
T + 273U2(es−ea )
∆+γ (1 + 0.34 U2)
(𝑒𝑠− 𝑒𝑎)
𝐓𝐢=𝐋𝐢×𝐄𝐋×𝐄𝐠×𝐅𝐜
𝐄𝐢×𝐪𝐠
in which Ti is the time of irrigation (h); Li is the
irrigation water depth to be applied (mm day-1); E
L is
the spacing of the lateral lines (1.0 m); EG is the
spacing of the drippers (0.5 m); FC is the coverage
factor (dimensionless); Ei is the irrigation efficiency
(dimensionless) (0.9); and qg is the drip flow
(4 L h-1).
The irrigation efficiency value was determined after the installation of the irrigation system in the field, using the methodology developed by Keller and Karmeli (1975).
The coverage factor (Fc) used were 0.1 (20 to 25 DAT), 0.2 (26 to 31 DAT), 0.3 (32 to 37 DAT), 0.4 (38 to 43 DAT), 0.5 (44 to 49 DAT), 0.6 (49 to 54 DAT), 0.7 (55 to 59 DAT), 0.8 (60 to 65 DAT), 0.9 (66 to 71 DAT) and 1.0 (72 to 90 DAT, which is the
stage of maximum water demand by the crop). These Fc were adapted from Dutra et al. (2000), following the criteria of intervals between each vegetative and reproductive stage of the tomato, comparing with the Fc of the melon crop in each vegetative and reproductive phase.
The accumulated precipitation in the period between irrigations was subtracted from the irrigation water depths to be applied, in order to ensure a correct irrigation water depth for each treatment and period.
The harvesting began at seventy DAT and ended at ninety DAT. The fruits were collected manually twice a week as their coloration changed, then, they were identified and placed in plastic bags, packed in boxes and taken to the Laboratory of the Agrometeorological Station of the UFC. The variables fruit diameter (FD), fruit length (FL), number of fruits per plant (NFP), fruit weight (FW) and fruit yield (FY) were evaluated.
The fruit length and diameter were measured with a digital caliper (mm). The average fruit weight
was measured in a semi-analytical balance, weighing
each fruit individually. The total number of fruits of the evaluation area was counted. Fruit yield was estimated by multiplying the fruit weight per plant of each treatment by the planting density.
The prices of crop inputs were assessed in agricultural stores of Fortaleza CE, in September of 2011 and 2012, to carried out the economic analysis. The electricity cost was calculated based on the price
of the kW h-1 charged for rural properties. The prices
paid for the 25-kg box of table tomato, practiced in
the State Food Supply Center (CEASA-CE) was also
considered.
RESULTS AND DISCUSSION
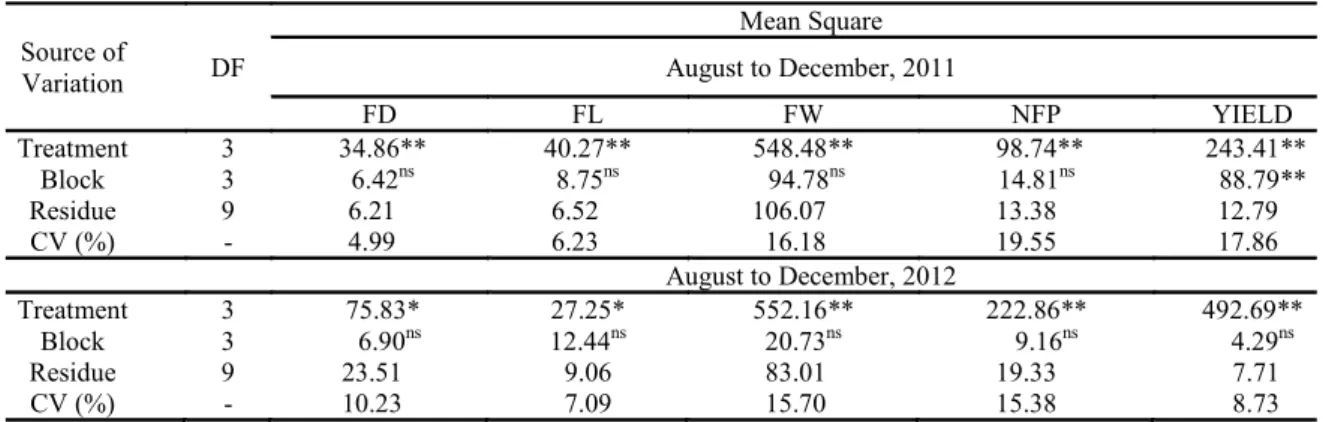
The irrigation frequency affected (p<0.01) the fruit diameter (FD), fruit length (FL), fruit weight
(FW), number of fruits per plant (NFP) and fruit yield (FY) of tomatoes grown in the coastal region of the State of Ceará (CE), Brazil, during the crops season of 2011 and 2012 (Table 2).
Source of
Variation DF
Mean Square
August to December, 2011
FD FL FW NFP YIELD
Treatment 3 34.86** 40.27** 548.48** 98.74** 243.41**
Block 3 6.42ns 8.75ns 94.78ns 14.81ns 88.79**
Residue 9 6.21 6.52 106.07 13.38 12.79 CV (%) - 4.99 6.23 16.18 19.55 17.86
August to December, 2012
Treatment 3 75.83* 27.25* 552.16** 222.86** 492.69**
Block 3 6.90ns 12.44ns 20.73ns 9.16ns 4.29ns
Residue 9 23.51 9.06 83.01 19.33 7.71
CV (%) - 10.23 7.09 15.70 15.38 8.73
Table 2. Analysis of variance of fruit diameter (FD), fruit length (FL), fruit weight (FW), number of fruits per plant (NFP) and fruit yield (FY) of tomatoes grown under different irrigation frequencies.
FD = Degrees of Freedom, CV = coefficient of variation; **= Significant at 1%, *= Significant at 5%; ns= non- significant.
The effect of the irrigation frequency on the tomato fruit diameter is presented in Figure 1.
The irrigation frequency F2 resulted in the highest tomato FD, with 55.5 (2011) and 53.84 mm
(2012), and the F7 resulted in the lowest FD, with 47.3 (2011) and 41.5 mm (2012). This results represent an increase in FD from F7 to F2 of 22.6% (2011) and 15.6% (2012).
Figure 1. Fruit diameter (FD) of tomatoes as a function of irrigation frequency. Fortaleza, State of Ceará, Brazil. ■ = 2011;
Δ = 2012.
Monte et al. (2009) grew tomatoes of the
cultivar Débora (long-life) with irrigation frequency
of two days and found higher fruit diameters to those found in the present work (above 60 mm), however, they used a different cultivar and the plants were under different edaphoclimatic conditions.
Tomato fruits are classified according to their diameter. Fruits with diameter less than 40 mm are
considered non-commercial. The FD found in the
present work were above this minimum diameter required for commercial fruits, in both years (BRASIL, 1995).
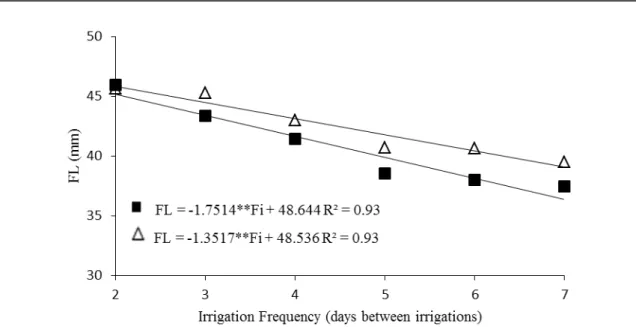
Figure 2. Fruit length (FL) of tomatoes as a function of irrigation frequency. Fortaleza, State of Ceará, Brazil. ■ = 2011;
Δ = 2012.
The FL of the tomato fruits ranged from 37.44 to 45.91 (2011) and from 39.47 to 45.65 mm (2012). The reduction of the irrigation frequency reduced the length of the tomato fruits in both years. The FL of the tomato fruits were lower in 2011 than in 2012, which were probably because the precipitation was greater in 2011 than in 2012. The precipitation occurred in the period of fruiting and fruit growth of the first year (October 2011) may have stressed the plants by excess water, contributing to a lower FL, since climatic variations affect the quality and yield of vegetables (OLIVEIRA et al., 2011).
Moreover, according to Monte et al. (2013),
tomato is sensitive to high temperatures, and plants subjected to temperatures above the ideal range reduce photosynthesis and increase mitochondrial respiration, which may decrease their carbon biomass (PIMENTEL, 1998). Santana et al. (2010) evaluated tomato crops under prolonged and severe water deficit and reported a reduced fruit growth. These results confirm those from other authors who evaluated tomato crops under water deficit and found negative effects on fruit quality and yield. (SOARES et al., 2011; SILVA et al., 2013).
The fruit weight (FW) of the tomatoes presented similar response to those for fruit diameter and length (Figure 3).
Figure 3. Fruit weight (FW) of tomatoes as a function of irrigation frequency. Fortaleza, State of Ceará, Brazil. ■ = 2011;
The FW data fitted to a negative linear model. The plants under the highest irrigation frequency (F2) presented FW of 61.34% (2011) and 76.1% (2012), which were higher than those under the lower irrigation frequency (F7). The highest (83.8 g) and lowest (51.6 g) FW were found in 2011 in the treatments F2 and F7, respectively. The treatments presented similar results in 2012, with highest FW of 76.4 g (F2) and lowest FW of 43.8 g (F7).
Madrid et al. (2009) assessed the effects of organic fertilization and irrigation rates on tomato crops and reported that the water deficit reduces leaf
area and affects photosynthesis and water accumulation by the fruits and consequently, the fruit weight. Other authors also evaluated irrigation management in tomato crops and found responses of FW, with decreasing irrigation frequency, similar to those found in the present work (KOETZ et al., 2010; SILVA et al., 2013).
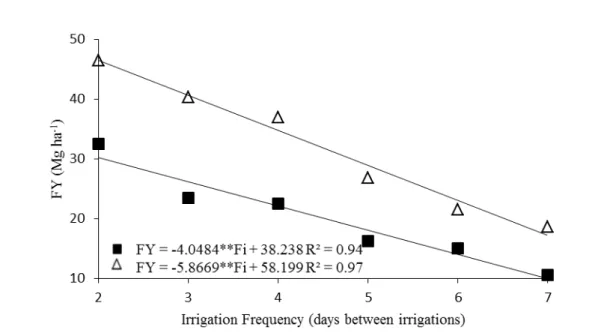
It can be observed (Figure 4) the fruit yield (FY) of tomato presented a negative linear response to the reducing irrigation frequency in both years evaluated (2011 and 2012).
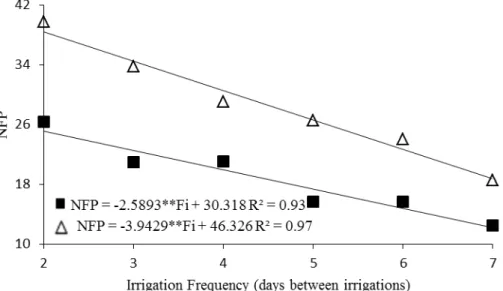
Figure 4. Number of fruits per plant (NFP) of tomatoes as a function of irrigation frequency. Fortaleza, State of Ceará, Brazil. ■ = 2011; Δ = 2012.
Pires et al. (2009), evaluated different irrigation frequencies in tomato crops and also observed a reduction in NFP with decreasing irrigation frequency, as well as other authors, who observed the same trend (SILVA et al., 2013; OZBAHCE; TARI, 2010).
The precipitation occurred during the first year (August 2011) may have contributed to a greater flowering, since more frequent irrigations are recommended to plants during flowering and fruiting (NAIKA et al., 2006). Moreover, according to Marouelli and Silva (2005), the best performance of tomato is achieved with irrigations performed every two days.
The water stress, combined with an inadequate irrigation management and low initial soil moisture may cause abortion of flowers and fall of flower buds, thus reducing the number of fruits in the
plant (GUANG-CHENG et al., 2008; PATANÈ,
COSENTINO, 2010).
The fruit yield (FY) of tomato presented a negative linear response to the reducing irrigation frequency in both years evaluated (2011 and 2012)
(Figure 5).
The maximum yield found was 32.54 (2011)
and 46.43 (2012) Mg ha-1, both from plants under the
highest irrigation frequency (F2).
The crops of 2012 presented higher yields than those in 2011, which may be related to the different precipitation in these years. The precipitation during the first experiment (2011) was 88 mm, which may have increased the leaching of nutrients, while during the second experiment (2012), the precipitations were 4.6 mm.
The excessive water is a limiting factor to high yields (PATANÈ, CONSENTINO, 2010), as confirmed by Kramer and Boyer (1995), who report that the more the crop is sensitive to the water deficit, the greater is the yield reduction.
Figure 5. Fruit yield (FY) of tomatoes as a function of irrigation frequency. Fortaleza, State of Ceará, Brazil. ■ = 2011;
Δ = 2012.
Figure 6. Net income (R$) obtained with tomato crops as a function of irrigation frequency. Fortaleza, Ceará, 2011 and 2012.
On the other hand, treatments with irrigation intervals greater than four days presented losses in 2011.
The higher income obtained with the crops in 2012, compared with those in 2011, were due to the higher yields of 2012.
Monte et al. (2009) evaluated irrigation frequencies in tomato crops and reported that the
two-day irrigation interval results in plants with the
same fruit quality than those under most frequent irrigations, but with greater water savings. Therefore, this is the recommended irrigation frequency for tomato producers.
According to Lima et al. (2012), economic analysis and reduction in water consumption are the
basic factors to increase profit for tomato producers and promote water and energy savings in tomato
crops. Thus, the irrigation frequency F2 (2-day
interval between irrigations) was the best irrigation management for the tomato crops in both years and conditions evaluated.
CONCLUSION
The irrigation frequency F2 (2-day interval
between irrigations) promotes better productive performance of field crops of tomato in the soil and climate conditions of Fortaleza, Ceará, Brazil.
State of Ceará, who aim to increase economic return,
i.e., net income, must adopt a two-day irrigation
frequency (F2).
REFERENCES
ALLEN, R. G. et al. Crop evapotranspiration:
guidelines for computing crop water requirements. Roma: FAO, 1998. 328 p. (Irrigation and Drainage Paper, 56).
ALVARENGA, M. A. R. Tomate: Produção em
campo, em casa-de-vegetação e em hidroponia. 1.
ed.Lavras, MG: UFLA, 2004. 400 p.
BERNARDO, S.; SOARES, A. A.; MANTOVANI,
E. C. Manual de irrigação. 8. ed. Viçosa, MG:
UFV, 2009. 625 p.
BRASIL. Ministério da Agricultura do
Abastecimento e da Reforma Agrária. Portaria n553
de 30 de agosto de 1995. Diário Oficial da
República Federativa do Brasil. Brasília: Imprensa
Oficial. 1995. p. 25.
CARVALHO, J. A. et al. Análise produtiva e
econômica do pimentão-vermelho irrigado com
diferentes lâminas, cultivado em ambiente protegido.
Revista Brasileira de Engenharia Agrícola e Ambiental, Campina Grande, v. 15, n. 6, p. 569-574, 2011.
DUTRA, I. et al. Determinação do fator de cobertura do melão cultivado sob diferentes lâminas e
salinidades da água de irrigação. Revista Brasileira
de Engenharia Agrícola e Ambiental, Campina
Grande, v. 4, n. 2, p. 146-151, 2000.
EMPRESA BRASILEIRA DE PESQUISA
AGROPECUÁRIA - EMBRAPA. Sistema
brasileiro de classificação de solos. 2. ed. Rio de
Janeiro, RJ: Embrapa Solos, 2006. 306 p.
FAGAN, E. B. et al. Eficiência do uso de água do
meloeiro hidropônico. Bioscience Journal,
Uberlandia, v. 25, n. 2, p. 37- 45, 2009.
GUANG-CHENG, S. et al. Comparative effects of
deficit irrigation (DI) and partial root zone drying (PRD) on soil water distribution, water use, growth
and yield in greenhouse grown hot pepper. Scientia
Horticulturae, Amsterdam, v. 119, n. 1, p. 11-16,
2008.
HIGUTI, A. R. O. et al. Produção de tomate em
função da “vibração” das plantas. Bragantia,
Campinas, v. 69, n. 1, p. 87- 92, 2010.
INSTITUTO BRASILEIRO DE GEOGRAFIA E
ESTATÍSTICA - IBGE. Sistema IBGE de
recuperação automática – SIDRA. Disponível em: <http://www.ibge.gov.br/home/estatistica/
indicadores/agropecuaria/lspa/lspa_201203.pdf>. Acesso em: 8 Jul. 2013.
KELLER, J.; KARMELI, D. Trickle irrigation
design. Rain Bird Sprinkler Manufacturing Corporation, 1975. 133 p.
KOETZ, M. et al. Caracterização agronômica e ºbrix em frutos de tomate industrial sob irrigação por
gotejamento no sudoeste de Goiás. Revista
Brasileira de Agricultura Irrigada, Fortaleza, v. 4.
n. 1, p. 14-22, 2010.
KRAMER, P. J.; BOYER, J. S. Water relations of
plants and soils. San Diego: Academic Press, 1995, 495 p.
MADRID, R. et al. Effects of organic fertilizers and irrigation level on physical and chemical quality of
industrial tomato fruit (cv. Nautilus). Journal of the
Science of Food and Agriculture, Oxford, v. 89, n. 15, p. 2608–2615, 2009
MAROUELLI, W. A.; SILVA, W. L. C. Frequência de irrigação por gotejamento durante o estádio vegetativo do tomateiro para processamento
industrial. Pesquisa Agropecuária Brasileira,
Brasília, v. 40, n. 7, p. 661-666, 2005.
MAROUELLI, W. A.; SILVA, W. L. C.; SILVA, H. R. Irrigação por aspersão em hortaliças: qualidade
da água, aspectos do sistema e método prático de manejo. 2. ed. Brasília, DF: Embrapa Informação Tecnológica, 2008. 150 p.
MONTE, J. A. et al. Influência do turno de rega no crescimento e produção do tomateiro no verão em
Seropédica. Horticultura Brasileira, Brasília, v. 27,
n. 2, p. 222-227, 2009.
MONTE, J. A. et al. Growth analysis and yield of tomato crop under different irrigation depths.
Revista Brasileira de Engenharia Agrícola e Ambiental, Campina Grande, v. 17, n. 9, p. 926–931, 2013.
NAIKA, S. et al. A cultura do tomate, produção,
processamento e comercialização. 1. ed.
Wageningen, Países Baixos: DIGIGRAFI, 2006. 104 p.
LIMA, E. M. C. et al. Produção de pimentão cultivado em ambiente protegido e submetido a
diferentes lâminas de irrigação. Revista
Agrotecnologia, Anápolis, v. 3, n. 1, p. 40-56, 2012.
produção de alface americana em função de lâminas
de irrigação. Engenharia Agrícola, Jaboticabal, v.
35, n. 2, p. 392-398, 2011.
OLIVEIRA, E. C. et al. Viabilidade técnica e econômica da produção de ervilha (pisum sativum l.) cultivada sob diferentes lâminas de irrigação.
Engenharia Agrícola, Jaboticabal, v. 31, n. 2, p.
324-333. 2011.
OZBAHCE, A.; TARI, A. F. Effects of different emitter space and water stress on yield and quality of processing tomato under semiarid climate
conditions. Agricultural Water Management,
Turkey v. 97, n. 9, p. 1405-1410, 2010.
PATANÈ, C.; COSENTINO, S. L. Effects of soil water deficit on yield and quality of processing
tomato under a Mediterranean climate. Agricultural
Water Management, Amsterdam, v. 97, n. 1, p.
131-138, 2010.
PIMENTEL, C. Metabolismo do carbono na
agricultura tropical. 1. ed. Seropédica, RJ: EDUR, 1998. 150 p.
PIRES, R. C. M. et al. Desenvolvimento e produtividade do tomateiro sob diferentes
frequências de irrigação em estufa. Horticultura
Brasileira, Brasília, v. 27, n. 2, p. 228-234, 2009.
RAIJ, B. V. et al. Recomendações de adubação e
calagem para o Estado de São Paulo. 2. ed.
Campinas: IAC, 1997. 285p. (Boletim Técnico, 100).
RONCHI, C. P. et al. Manejo de plantas daninhas na
cultura do tomateiro. Planta Daninha, Viçosa, v. 28,
n. 1, p. 215-228, 2010.
SANTANA, M. J. et al. Resposta do tomateiro
irrigado a níveis de reposição de água no solo.
Revista Irriga, Botucatu, v. 15, n. 4, p. 443-454,
2010.
SANTANA, M. J.; VIEIRA, T. A.; BARRETO, A. C. Efeito dos níveis de reposição de água no solo na
produtividade do tomateiro. Horticultura
Brasileira, Brasília,v. 27, n. 2, p. 1378-1384, 2009.
SEPASKHAH, A. R.; AHMADI, S. H. A review on
partial root-zone drying irrigation. International
Journal of Plant Production, Gorgan, v. 4, n. 4, p.
1735-8043, 2010.
SILVA, J. A. S. et al. Aspectos agronômicos do tomateiro “Caline Ipa 6” cultivado sob regimes
hídricos em área do semiárido. Revista
Agro@mbiente On-line, Boa Vista, v. 8, n. 3, p. 336-344, 2014.
SILVA, J. M. et al. Cultivo do tomateiro em ambiente protegido sob diferentes taxas de reposição
da evapotranspiração. Revista Brasileira de
Engenharia Agrícola e Ambiental, Campina
Grande, v. 17, n. 1, p. 40-46, 2013.
SOARES, L. A. A. et al. Crescimento do tomateiro e qualidade física dos frutos sob estresse hídrico em
ambiente protegido. Revista Verde, Pombal, v. 6, n.