doi: 10.3389/fmars.2017.00277
Edited by: Mark Meekan, Australian Institute of Marine Science, Australia Reviewed by: Maelle Connan, Nelson Mandela Metropolitan University, South Africa Nuno Queiroz, University of Porto, Portugal *Correspondence: Julie C. McInnes [email protected]
Specialty section: This article was submitted to Marine Megafauna, a section of the journal Frontiers in Marine Science Received: 31 May 2017 Accepted: 14 August 2017 Published: 31 August 2017 Citation: McInnes JC, Jarman SN, Lea M-A, Raymond B, Deagle BE, Phillips RA, Catry P, Stanworth A, Weimerskirch H, Kusch A, Gras M, Cherel Y, Maschette D and Alderman R (2017) DNA Metabarcoding as a Marine Conservation and Management Tool: A Circumpolar Examination of Fishery Discards in the Diet of Threatened Albatrosses. Front. Mar. Sci. 4:277. doi: 10.3389/fmars.2017.00277
DNA Metabarcoding as a Marine
Conservation and Management Tool:
A Circumpolar Examination of
Fishery Discards in the Diet of
Threatened Albatrosses
Julie C. McInnes1, 2*, Simon N. Jarman3, 4, Mary-Anne Lea1, Ben Raymond1, 2,
Bruce E. Deagle2, Richard A. Phillips5, Paulo Catry6, Andrew Stanworth7,
Henri Weimerskirch8, Alejandro Kusch9, Michaël Gras10, Yves Cherel8, Dale Maschette2
and Rachael Alderman11
1Institute for Marine and Antarctic Studies, University of Tasmania, Hobart, TAS, Australia,2Australian Antarctic Division, Kingston, TAS, Australia,3Trace and Environmental DNA Laboratory, Department of Environment and Agriculture, Curtin University, Perth, WA, Australia,4CSIRO Indian Ocean Marine Research Centre, The University of Western Australia, Perth, WA, Australia,5British Antarctic Survey, Natural Environment Research Council, Cambridge, United Kingdom,6Marine and Environmental Sciences Centre, ISPA-Instituto Universitário, Lisbon, Portugal,7Falklands Conservation, Stanley, Falkland Islands,8Centre d’Etudes Biologiques de Chizé, UMR 7372 du Centre National de la Recherche Scientifique-Université de La Rochelle, Villiers-en-Bois, France,9Wildlife Conservation Society, Punta Arenas, Chile,10Directorate of Natural Resources-Fisheries of the Falkland Islands Government, Stanley, Falkland Islands,11Department of Primary Industries, Parks, Water and Environment, Hobart, TAS, Australia
Almost all of the world’s fisheries overlap spatially and temporally with foraging seabirds, with impacts that range from food supplementation (through scavenging behind vessels), to resource competition and incidental mortality. The nature and extent of interactions between seabirds and fisheries vary, as does the level and efficacy of management and mitigation. Seabird dietary studies provide information on prey diversity and often identify species that are also caught in fisheries, providing evidence of linkages which can be used to improve ecosystem based management of fisheries. However, species identification of fish can be difficult with conventional dietary techniques. The black-browed albatross (Thalassarche melanophris) has a circumpolar distribution and has suffered major population declines due primarily to incidental mortality in fisheries. We use DNA metabarcoding of black-browed albatross scats to investigate their fish prey during the breeding season at six sites across their range, over two seasons. We identify the spatial and temporal diversity of fish in their diets and overlaps with fisheries operating in adjacent waters. Across all sites, 51 fish species from 33 families were identified, with 23 species contributing >10% of the proportion of samples or sequences at any site. There was extensive geographic variation but little inter-annual variability in fish species consumed. Several fish species that are not easily accessible to albatross, but are commercially harvested or by-caught, were detected in the albatross diet during the breeding season. This was particularly evident at the Falkland Islands and Iles Kerguelen where higher fishery catch amounts (or discard amounts where known) corresponded to higher occurrence of these species in diet samples. This study indicates ongoing
interactions with fisheries through consumption of fishery discards, increasing the risk of seabird mortality. Breeding success was higher at sites where fisheries discards were detected in the diet, highlighting the need to minimize discarding to reduce impacts on the ecosystem. DNA metabarcoding provides a valuable non-invasive tool for assessing the fish prey of seabirds across broad geographic ranges. This provides an avenue for fishery resource managers to assess compliance of fisheries with discard policies and the level of interaction with scavenging seabirds.
Keywords: scat, trawl fishery, fisheries resource management, Southern Ocean, Thalassarche melanophris, seabird-fishery interaction, fish diversity, seabirds
INTRODUCTION
Effective ecosystem-based management of commercial fisheries requires information not just on the sustainability of target stocks, but also on the interactions of other marine organisms with fishing operations. Globally, seabirds frequently interact with commercial fisheries through competition for shared
resources (Frederiksen et al., 2004; Okes et al., 2009), incidental
mortality in fishing gear (Brothers et al., 1999; Sullivan et al.,
2006; Watkins et al., 2008; Tuck et al., 2011) and consumption
of fishery discards (Garthe et al., 1996; Gonzalez-Zevallos and
Yorio, 2006). Seabird survival and breeding success can be
reduced by competition with fisheries (Furness and Tasker, 2000;
Frederiksen et al., 2004), and incidental mortality in fishing
gear can be a major cause of population declines, particularly
of albatrosses and large petrels (Weimerskirch and Jouventin,
1987; Barbraud et al., 2008; Phillips et al., 2016). Physical
and operational mitigation measures have been developed to
reduce seabird mortality (Løkkeborg, 2008; Phillips et al., 2016),
including the reduction of fishery discards, which decreases the
attractiveness of vessels (Abraham et al., 2009; Pierre et al.,
2012). Scavenging birds are attracted to the supplementary food
source provided by discards, which may consist of (i) the head, tail and offal of retained catch (commercial species caught at commercial size); (ii) whole fish of commercial species but caught at a non-commercial size; (iii) non-commercial species and (iv) unused baits (in longline fishing). These discards are often fish or other species that may not be naturally accessible. Some populations benefit from the additional food source, with higher breeding success and survival resulting in population growth
(Oro et al., 1995; Bertellotti and Yorio, 2000). However, discards
can alter food-web structure by providing nutritionally-poor
food (Grémillet et al., 2008), or artificially inflating populations
of predatory gulls or skuas, which may not be sustainable in the absence of discards or which also prey on smaller seabirds,
with potentially major impacts (Phillips et al., 1999b; Foster
et al., 2017). The interactions between seabird populations and
fisheries are likely to vary over time, space and species; therefore, understanding the nature and extent of these interactions is imperative for effective ecosystem management.
Seabird dietary studies can inform ecosystem risk assessments for fishery management by identifying interactions between
fisheries and seabirds for different populations (Phillips et al.,
1999a). Understanding the dietary flexibility of seabirds is also
fundamental for predicting the responses of individuals and populations to spatial and temporal changes in natural prey abundance, and availability from fisheries, and hence for the
effective management of marine resources (Constable et al.,
2000). Stomach content and stable isotope analyses are the two
main approaches for assessing seabird diet (Duffy and Jackson,
1986; Barrett et al., 2007). The former primarily relies on the
use of otoliths and bones to identify fish prey, enabling prey size and meal mass estimates to be obtained. However, discrimination can be poor or impossible if the prey (including larvae or eggs) is small, has no hard parts, or digests quickly; the hard-parts are eroded; or those from closely-related species cannot
be readily distinguished (Duffy and Jackson, 1986; Barrett et al.,
2007). These problems apply in particular to items originating
as fisheries offal, as viscera float and are therefore easier to ingest than fish heads with otoliths, particularly those from large
species (Thompson and Riddy, 1995). More recent studies have
used DNA analysis to identify parts that were not taxonomically
diagnostic (Alonso et al., 2014). However, studies using stomach
samples are usually restricted to the chick-rearing period, thus focusing on chick rather than adult diet across the annual cycle and usually requires handling of birds.
Stable isotope analysis of blood or feathers does not suffer from the biases associated with differential digestion of prey and can be applied to all stages of the breeding season. This method has been used to determine likely fishery overlaps by comparing the estimated proportions of pelagic and demersal prey, on the assumption that the latter were obtained from
fisheries (Granadeiro et al., 2013). However, in most systems
stable isotope analyses lack the resolution to identify prey beyond broad trophic groups. DNA metabarcoding of predator scats is a useful alternate or complementary method for assessing seabird
diet (Deagle et al., 2007; Bowser et al., 2013). It can provide
high-level taxonomic resolution and does not require prey remains to
be physically identifiable (Pompanon et al., 2012). Although the
method cannot be used to identify prey size and meal mass, it does give an indication of species occurrence in the diet. Samples
can also be collected during all breeding stages (McInnes et al.,
2017a) and the technique is non-invasive and requires minimal
field time compared to conventional diet sampling, increasing the options for simultaneous sampling across broad spatial scales
(Jarman et al., 2013).
The black-browed albatross (BBA, Thalassarche melanophris) has a circumpolar distribution and is the most abundant
albatross species in the southern hemisphere (Phillips et al.,
2016). Populations have experienced extensive declines which
are strongly linked to incidental mortality in longline and trawl
fisheries (Phillips et al., 2016). While the population at South
Georgia is still declining (Poncet et al., 2017), numbers in the
Falkland Islands and on islands off Chile are currently increasing
(Wolfaardt, 2013; Robertson et al., 2014, 2017). The increases in
Chile have been attributed to a reduction in incidental seabird mortality due to faster sink rates of baited longline hooks associated with a change in fishing practices, and the use of bird-scaring (streamer or tori) lines, making hooks less accessible
to birds (Robertson et al., 2014). However, longline and trawl
fisheries are still thought to cause high mortality of this species
elsewhere, especially in the wintering grounds (Yeh et al., 2013;
Kuepfer, 2015; Tamini et al., 2015). Fishery resource overlaps
with the diet of black-browed albatrosses have been shown at all breeding sites where fish have been characterized, including
Iles Kerguelen (Cherel et al., 2000), Diego Ramirez (Arata and
Xavier, 2003), South Georgia (Reid et al., 1996; Xavier et al.,
2003) and the Falkland Islands (Thompson, 1992). However, the
most recent samples used in these studies were collected over 15 years ago (1995, 2002, 2000, and 1991, respectively; Data Sheet 1 in Supplementary Material), over which time fishing operations and regulations, including discarding policies and mitigation requirements, have changed substantially in many
regions (Phillips et al., 2016).
We used DNA metabarcoding of BBA fecal DNA to investigate the fish prey consumed at six sites across their breeding range to: (1) determine the fish prey diversity and any spatial and temporal variability; (2) identify any fishery target, bycatch
and bait species in the diet of BBA to distinguish regions in which rates and risks of vessel interactions may be greater (and hence efforts to improve discard management and monitoring of compliance with seabird bycatch mitigation may be targeted); and (3) evaluate sources of potential resource competition or food supplementation by fisheries. We use this study to show that DNA metabarcoding can quantify fish diversity and the presence of discards in the diet of seabirds, providing a valuable tool for fishery resource and conservation management.
METHODS
Study Sites and Sample Collection
Fresh scat samples were collected from black-browed albatrosses at six breeding colonies over multiple seasons: in austral summers 2013/14 and 2014/15 at New Island and Steeple Jason Island (Falkland Islands), Macquarie Island (Australia) and Bird Island (South Georgia); in 2013/14 and 2015/16 at Canyon des Sourcils Noirs (Iles Kerguelen); and in 2014/15 at Albatross Islet (Chile;
Figure 1). The majority of samples were collected during the chick-rearing period (December-March) with additional samples collected during incubation in 2014/15 at Steeple Jason Island and New Island, Kerguelen in 2013/14 and during incubation in both years at Macquarie Island (Table 1). Sampling years are hereafter termed 2014 for samples collected in 2013/14 and 2015 for 2014/15 samples. This project was approved by the University of Tasmania Animal Ethics Committee (Permit A13745).
A small fragment of the non-uric acid portion (dark part) of each scat was collected using tweezers or a spatula and stored in 80% ethanol. Where possible, fresh scats were obtained (where
FIGURE 1 | Breeding distribution of black-browed albatrosses and sampling sites. Blue dots represent the six colonies where scat samples were collected, and the red dots the remaining colonies not sampled during the study. The inset shows the individual Chilean and Falkland Island colonies. Samples were collected from Albatross Islet, Chile (40–50 breeding pairs, population increasing); New Island (13,343 breeding pairs, population increasing) and Steeple Jason Island (183,135 pairs, population increasing), Falkland Islands; Bird Island, South Georgia (8,264 breeding pairs, population declining); Canyon des Sourcils Noirs, Iles Kerguelen (∼1,200 breeding pairs, population stable); and Macquarie Island (∼200 breeding pairs, population stable;ACAP, 2010; Wolfaardt, 2013; Robertson et al., 2014; Phillips et al., 2016; Poncet et al., 2017)
T A B L E 1 | T h e to ta ls a m p le s a t e a c h si te w h ic h c o n ta in e d fo o d D N A d e riv e d fr o m th e 1 8 S _S S U p rim e r se t a n d 1 6 S _F is h p rim e r se t. S it e Y e a r F O O o f fi s h s e q u e n c e s (1 8 S )* R R A o f fi s h s e q u e n c e s (1 8 S )* N u mb e r o f s a mp le s w it h fo o d D N A (1 8 S )* N u mb e r o f s a mp le s a mp li fi e d (1 6 S ) # In c u b a ti o n E a rl y c h ic k -r e a ri n g L a te c h ic k -r e a ri n g To ta l O c t N o v E a rl y D e c L a te D e c J a n F e b M a r In c u b a ti o n E a rl y C R L a te C R A ll A lb a tr o ss Is le t 2 0 1 4 /1 5 1 0 0 .0 9 7 .2 5 1 4 9 4 9 4 9 N e w Is la n d 2 0 1 3 /1 4 9 5 .5 6 7 .9 2 2 1 2 (4 ) 7 (2 ) 1 9 (6 ) 1 9 (6 ) 2 0 1 4 /1 5 9 2 .9 7 5 .7 2 8 2 1 0 6 1 2 5 (3 ) 1 8 3 5 (3 ) 2 6 (3 ) S te e p le Ja so n Is la n d 2 0 1 3 /1 4 7 2 .9 4 0 .8 5 9 1 5 1 4 (1 4 ) 1 5 1 4 (1 4 ) 2 9 (1 4 ) 2 0 1 4 /1 5 7 7 .5 5 8 .2 4 0 1 3 2 7 (7 ) 1 3 2 7 (7 ) 2 2 (7 ) B ird Is la n d 2 0 1 3 /1 4 9 0 .9 7 6 .4 3 3 1 7 4 (1 ) 6 (1 ) 1 7 1 0 (2 ) 2 7 (2 ) 2 0 1 4 /1 5 9 2 .9 7 9 .3 4 2 3 9 2 3 9 2 4 1 Ile s K e rg u e le n 2 0 1 3 /1 4 1 0 0 .0 9 2 .4 3 6 3 6 1 2 0 9 2 1 3 0 2 0 1 5 /1 6 1 0 0 .0 9 3 .4 1 6 1 6 1 6 1 6 M a c q u a rie Is la n d 2 0 1 3 /1 4 9 3 .9 5 9 .4 3 3 6 3 6 6 (5 ) 2 (1 ) 3 (3 ) 9 1 2 (5 ) 5 (4 ) 2 6 (9 ) 2 0 1 4 /1 5 8 3 .3 5 4 .9 1 2 3 2 4 (4 ) 1 (1 ) 5 4 (4 ) 1 (1 ) 1 0 (5 ) O ve ra ll a ve ra g e 9 0 .9 7 3 .3 3 7 2 1 5 2 2 1 7 2 0 (4 ) 1 2 8 (1 1 ) 6 0 3 3 5 4 1 4 8 (9 ) 9 3 (3 1 ) 2 9 5 (4 6 ) *S a m pl e s w ith > 1 0 0 fo o d s e qu e n c e s ; #S a m pl e s w ith > 100 fis h s e qu e n c e s . V a lu e s in br a c ke ts re pr e s e n t th e n u m be r of s a m pl e s fr om c h ic ks . Th e fr e qu e n c y of oc c u rr e n c e (F O O , % ) a n d re la ti ve re a d a bu n da n c e (R R A , % ) of fis h a re pr e s e n te d fo r th o s e s a m pl e s fr o m w h ic h > 1 0 0 food s e qu e n c e s a m pl ifi e d w ith th e 18S _ S S U pr im e r s e t. F is h in c lu de s A c ti n opte ry gi i( bon y fis h ) a n d C h on dr ic h th ye s (s h a rk s a n d s ka te s ).
the bird was seen defecating or the sample was on the ground but still wet) and the developmental stage of the bird (chick, juvenile or adult) was recorded. Given the low sample sizes remaining when samples were split by site, age, and month, differences between diet of chicks and adults (self-feeding) could not be explored in this study, and therefore samples from different ages were pooled. Further research with greater sample sizes are required to test partitioning of diet by adults for
provisioning compared with self-feeding (Davoren and Burger,
1999; Danhardt et al., 2011), and potential dietary differences
between breeders, non-breeders and juveniles (Campioni et al.,
2016).
The foraging ranges of black-browed albatross are greater during incubation than chick-rearing, and the magnitudes of
these differences depend on the colony (Wakefield et al.,
2011). For example, at South Georgia, mean maximum foraging
distances of tracked adults were 980–1,690 km (262–327 h) and 275–505 km (45–77 h) during incubation and chick-rearing,
respectively (Phillips et al., 2004). The prey detected in scat
samples is likely to reflect the most recent meal consumed by albatross, which is similar to stomach contents analysis. The digestion rates of seabirds are influenced by numerous variables, such as predator species, metabolic rate, meal size, food type,
and feeding frequency (Hilton et al., 1998). In sooty albatross
(Phoebetria fusca), the mean retention rate of prey ranged from 11 to 15 h, however some prey was still detected up to 50 h after
eating (Jackson, 1992). In little penguins (Eudyptula minor) prey
could be detected for up to 4 days using DNA metabarcoding
(Deagle et al., 2010). The retention time is also likely to vary
depending on whether the food is consumed for self-feeding or regurgitated to the chick partially digested. During this study, it is assumed that the prey DNA recovered reflects the most recent foraging trip. For extended foraging trips during incubation, some of the food may not be detected.
DNA Metabarcoding
DNA was extracted from albatross scat samples using a Promega
“Maxwell 16” instrument and a Maxwell R 16 Tissue DNA
Purification Kit. PCR inhibitor concentrations were diluted by mixing a small amount (∼30 mg) of the fecal samples in 250 µL of STAR buffer (Roche Diagnostics) prior to extraction. Two different DNA markers were amplified. The first used a metazoan primer set that is highly conserved and amplifies a region of the nuclear small subunit ribosomal DNA (rDNA) 18S gene
(McInnes et al., 2017a, Table 2). For this marker the taxonomic
resolution is relatively low; however, it recovers DNA from all animal lineages and provides a broad view of the diet. The second primer pair amplifies a region of the 16S rDNA gene specifically from fish and varies enough to allow species-level identification for most of the targeted fish species (Table 2). This primer set was designed based on an alignment of mtDNA 16S sequences from representative Southern Ocean fish that were publicly available on Genbank (a full alignment with sequences in fasta format can be found in Data Sheet 2 of the Supplementary Material). The primer set was designed not to match bird DNA. Primers were tested with fish flesh and scat DNA. All samples were run with the 18S_SSU primer set first, and those that had fish DNA
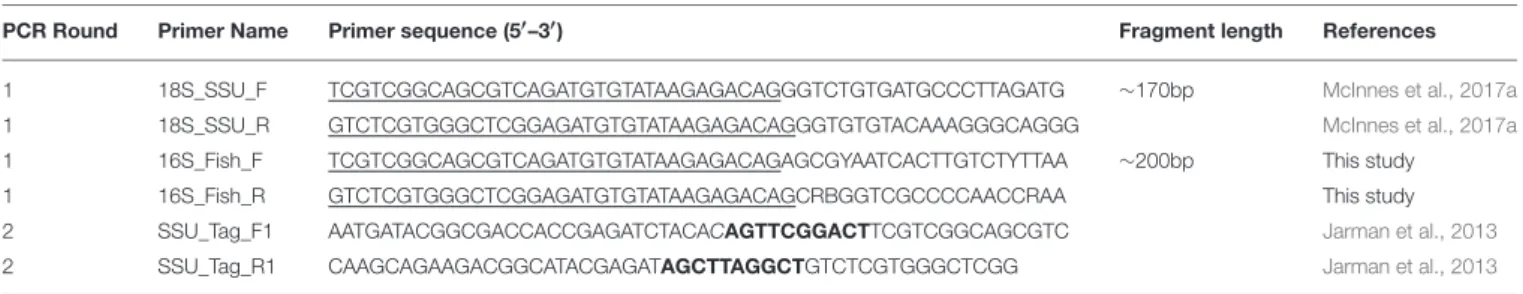
TABLE 2 | Oligonucleotides used in this study.
PCR Round Primer Name Primer sequence (5′–3′) Fragment length References
1 18S_SSU_F TCGTCGGCAGCGTCAGATGTGTATAAGAGACAGGGTCTGTGATGCCCTTAGATG ∼170bp McInnes et al., 2017a
1 18S_SSU_R GTCTCGTGGGCTCGGAGATGTGTATAAGAGACAGGGTGTGTACAAAGGGCAGGG McInnes et al., 2017a
1 16S_Fish_F TCGTCGGCAGCGTCAGATGTGTATAAGAGACAGAGCGYAATCACTTGTCTYTTAA ∼200bp This study
1 16S_Fish_R GTCTCGTGGGCTCGGAGATGTGTATAAGAGACAGCRBGGTCGCCCCAACCRAA This study
2 SSU_Tag_F1 AATGATACGGCGACCACCGAGATCTACACAGTTCGGACTTCGTCGGCAGCGTC Jarman et al., 2013
2 SSU_Tag_R1 CAAGCAGAAGACGGCATACGAGATAGCTTAGGCTGTCTCGTGGGCTCGG Jarman et al., 2013
Underlined bases in PCR Round 1 are the Miseq tag primer. Bolded bases in PCR Round 2 are an example of the unique tags attached to each sample.
were amplified using the 16S_Fish primer set (See Image 1 of the Supplementary Material for the DNA metabarcoding workflow). PCR reactions for each primer set were carried out separately as a two stage process. Stage one PCR reactions (10 µL) were performed with 5 µL 2 × Phusion HF (NEB), 1 µL 100 × Bovine Serum Albumin (NEB), 0.1 µL 5 µM of each 18S_SSU or 16S_Fish amplification primer (Table 2), 0.5 µL of Evagreen, 2 µL fecal DNA and 1.3 µL of water. Thermal cycling conditions
were 98◦C, for 2 min; followed by 35 cycles for 18S_SSU, and 45
cycles for 16S_Fish, of 98◦C for 5 s, 67◦C for 20 s, 72◦C for 20 s,
with an extension of 72◦C for 1 min. Each sample was run in
triplicate on a LightCycler 480 (Roche Diagnostics). A negative control containing no template DNA and positive control containing fish DNA were included in each PCR amplification run. If either the negative amplified or the positive failed to amplify, the PCR was re-run. If ≥2 replicates of each sample had a ct score <30 for the 18S_SSU, or <40 for 16S_Fish, they were combined to reduce biases produced by amplification from
samples with low template concentrations (Murray et al., 2015).
Pooled samples were diluted 1:10 for the second stage PCR. In the second stage PCR, a unique tag was attached to each sample (Table 2). PCR reactions (10 µL) were performed with 5 µL 2 × Phusion HF (NEB), 1 µL 100 × Bovine Serum Albumin (NEB), 1 µL of 1 µM of each tag primer, and 2 µL of diluted PCR product
from stage one. Thermal cycling conditions were 98◦C, for 2 min;
followed by 10 cycles of 98◦C for 5 s, 55◦C for 20 s, 72◦C for 20 s,
with an extension of 72◦C for 1 min. Samples were pooled and
purified from unincorporated reaction components by washing, utilizing reversible binding to Ampure (Agencourt) magnetic beads following the manufacturer’s protocol. Sequencing of PCR products was performed with an Illumina MiSeq high throughput sequencer, using the MiSeq reagent kit V2 (300 cycles).
Bioinformatics
Amplicon pools were de-multiplexed based on unique 10 bp Multiplex IDentifiers (MIDs) incorporated in the Illumina two-step MID protocol. Fastq files were processed using USEARCH
v8.0.1623 (Edgar, 2010). Reads R1 and R2 from the paired end
sequencing were merged using the fastq_mergepairs function, retaining only merged reads flanked by exact matches to the primers and primer sequences were trimmed. Reads from all samples were pooled and dereplicated, then clustered into broad Operational Taxonomic Units (OTUs) using the cluster_otus
command (-otu_radius_pct = 10). Potentially chimeric reads were discarded during this step. Reads for each sample were assigned to these OTUs (usearch_global -id 0.97) and a summary table generated using a custom R script. Each OTU was identified by BLAST and categorized to closest match using MEGAN 5
(Huson et al., 2007) and the Lowest Common Ancestor (LCA)
assignment algorithm. LCA parameters were set at a minimum score of 250 and a top-percent of 5% for the 18S_SSU and 340 and 5% for the 16S_Fish. These cut-offs were determined by manually checking a subset of samples against BLAST. Sequences were also manually checked on Genbank to ensure that all species from that genus in the region were represented. Additional
flesh samples were obtained at the Falkland Islands (Gras et al.,
2016) and through the Australian Antarctic Division and were
sequenced and added to Genbank (see Data Availability Section for accession numbers).
OTUs derived from the 18S_SSU primer set were assigned to class, whereas OTUs derived from the 16S_Fish primers were classified to genus or species. OTUs were assigned only to genus if there was any uncertainty in the species match, either due to insufficient difference between species in the 16S region amplified, or if species from that genus were not present on Genbank. The geographic distribution of species in each
genus was checked inGon and Heemstra (1990)and Duhamel
et al. (2014), and species was assigned if only one occurred
within the foraging range of BBA from a particular site. In such cases, the species name in tables and figures is given in parentheses. Samples amplified with the 18S_SSU primers were included if they contained at least 100 sequences of food DNA, whereas samples amplified for the 16S primers were included
if they contained at least 100 sequences of fish DNA (Jarman
et al., 2013). Results are presented as the number of samples
with a prey item (n), the frequency of occurrence (FOO) and the relative read abundance of sequences (RRA). For FOO calculations, any food item or fish species was deemed present if it comprised >1% of food sequences for 18S_SSU, or fish sequences for 16S_Fish. The RRA for 18S was calculated as the total sequences for that prey group divided by the total food sequences for that sample, whereas the RRA for the 16S was the number of sequences for a fish species divided by the total fish sequences for that sample. The RRA was averaged across island or year groups. These multiple measures of diet composition are presented to reduce potential biases in interpretation that might result from consideration of a single metric. The results
from the 18S region are presented to show the fish component of the diet and allow calculations of the overall proportion of the population consuming discards. Further details and discussion on the proportions of each prey group for each site can be found
inMcInnes et al. (2017b).
Assessing Overlaps between Commercial
Fisheries and BBA Prey
Data on fishery catches and target species were provided by the Directorate of Natural Resources of the Falkland Islands Government; the Australian Fisheries Management Authority and the Australian Antarctic Division; the Pecheker database
(Martin and Pruvost, 2007) and online Commission for the
Conservation of Antarctic Marine Living Resources (CCAMLR)
Statistical Bulletins (CCAMLR, 2015). These included fishing
effort (total hours for trawl and total hooks for longline); the total catch of target species and the main bycatch species (those comprising >1% of the total catch); the fish bait used in long-line fishing operations; and, at Iles Kerguelen, the mass of target and bycatch species that were discarded. No data were available on Illegal, Unreported, and Unregulated (IUU) fishing. During the relevant sampling periods, trawl and longline fisheries were operating during the sampling period within the Falkland Islands Inner and Outer Conservation Zones (FICZ/FOCZ;
Table 2), with no trawl fishing during January; longline but no trawl fisheries were operating within the Kerguelen Economic Exclusion Zone (EEZ); trawl but no longline fisheries operated
close to South Georgia during the sampling period (CCAMLR Division 48.3; excluding March); no fishery was operating in the Macquarie Island EEZ; nor was there a fishery within the Admiralty Sound or Magellan Strait, which are used by foraging
birds from Albatross Islet during chick rearing (Arata et al.,
2014). Fishery species were defined as any target fish species,
or bycatch fish species that made up >1% of the total catch (Table 3). Bait species used during fishing operations were also identified. For the main fish species (those contributing >10% of amplified sequences), the depth profile for each species during different age stages were compiled from the literature to determine which were likely to be naturally accessible to albatrosses (Table S1 in Supplementary Material). This study focused on the fishing zones adjacent to the breeding sites, as these are likely to be used more intensively than distant waters
by foraging birds during chick-rearing (Phillips et al., 2004;
Terauds et al., 2006; Catry et al., 2013; Arata et al., 2014), and
secondly, the management of these areas is within the same national jurisdiction as the relevant breeding site. However, we acknowledge that birds may have also interacted with fisheries further from colonies, especially during incubation when BBA are foraging farther from the colony than during chick rearing
(Phillips et al., 2004; Wakefield et al., 2011)
Statistical Analyses
Analyses were carried out using R software (R Core Team). Poisson generalized linear models (GLM) with a log link
TABLE 3 | Details of commercial fisheries operating in waters adjacent to breeding colonies of black-browed albatrosses during the sampling periods. Island
site
Fishery Area Fishery Operation dates
Target fish Main bycatch
species
Discard policy Bait species
Albatross Islet
Admiralty Sound and Magellan strait
Artisanal fisheries
All year Assorted fish – – –
Falkland Islands
FICZ/FOCZ Long-line All year Dissostichus eleginoides Rajiformes Discards permitted Sardina pilchardus (Squid sp.) FICZ/FOCZ Trawl All year Patagonotothen ramsayi
Dissostichus eleginoides Genypterus blacodes Macruronus magellanicus Micromesistius australis Merluccius sp. Salilota australis Rajidae
Macrouridae Discards permitted –
Bird Island CCAMLR Division 48.3 Pelagic trawl
All Year Champsocephalus gunnari Pseudochaenichthys georgianus Patagonotothen guntheri Notothenia rossii Lepidonotothen squamifrons Discards prohibited during shooting and
hauling (CM 25-03;CCAMLR, 2014b) – Iles Kerguelen
EEZ Long-line March-January Dissostichus eleginoides Macrouridae Rajiformes Antimora rostrata Discards prohibited during setting (CM 25-02;CCAMLR, 2014b) Sardinops sagax Cololabis saira Trachurus trachurus Scomber japonicas Scomber scombrus (Illex argentinus)
function were used to test if there were differences in fish species composition between colonies and years, and between years and breeding stages at each site. The model included the count of samples with fish DNA (n) as the dependant variable and predictor variables included fish species (F), year (Y) and breeding stage (S), or colony (C). The base model included the sample size as a function of the main effects (fish species, year, breeding stage, or colony) as well as the year:stage or year:colony interaction. These terms effectively describe the patterns in the data arising from the experimental sampling process (e.g., total number of samples within a given year). The interaction terms, fish:year, fish:stage, or fish:colony were added to the base model to test the effect of year or stage (or colony for the pooled data) on diet composition. The analysis of deviance (with Chi-squared test) and Akaike’s information criterion (AIC) were used to compare fitted models and test
the significance of predictor terms (Burnham and Anderson,
2002). A linear regression was used to assess the relationship
between the proportion of samples with discards and breeding success, based on monitoring of BBA nesting attempts at each colony in the year that the diet samples were collected. Dissimilarity indices were calculated with the Manhattan method
using the command “vegdist” in the package “Vegan” (Oksanen
et al., 2016). From these indices, a hierarchical clustering was
then constructed using the average agglomeration method,
and plots created using the package “ggplot2” (Wickham,
2009). The proportion of samples that amplified with the
16S_Fish primer which contained species that are also caught in fisheries was calculated, and applied to the total number of samples collected that amplified fish with the 18S_SSU primers.
RESULTS
Diversity, and Spatial and Temporal
Variability in Fish Prey of BBA
A total of 1,091 scat samples were collected. DNA was amplified in 793 samples using the 18S_SSU primers; 372 samples contained at least 100 sequences of food DNA, and 327 contained fish DNA. These samples were then amplified with the 16S_Fish group specific primers; 295 samples contained at least 100 fish sequences and were included in subsequent analyses (Table 1).
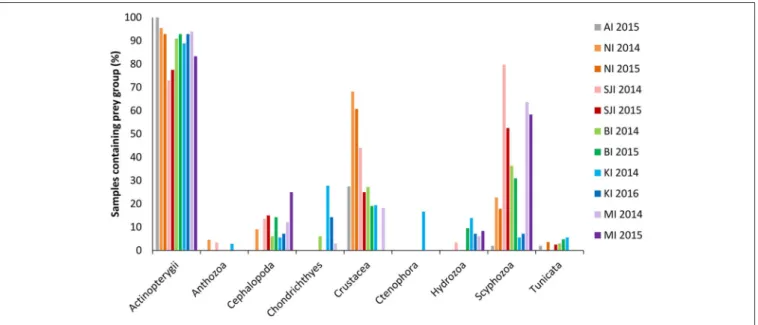
Fish were found to be the most common prey group across all sites and years, based on the 18S_SSU data. In total, 91% of samples contained fish and this made up 72% of sequences (ranging from 73 to 100% of samples, and between 41 and 97% of sequences at different sites; Table 1). Chondrichthyes (sharks and skates) were present in 2.7% of samples and comprised 2% of these sequences (Figure 2).
The higher resolution provided by the mtDNA 16S marker identified at least 51 fish species, from 33 families in the diet of BBA across the six breeding sites, with 23 species constituting
>10% of the amplified sequences for different colonies and
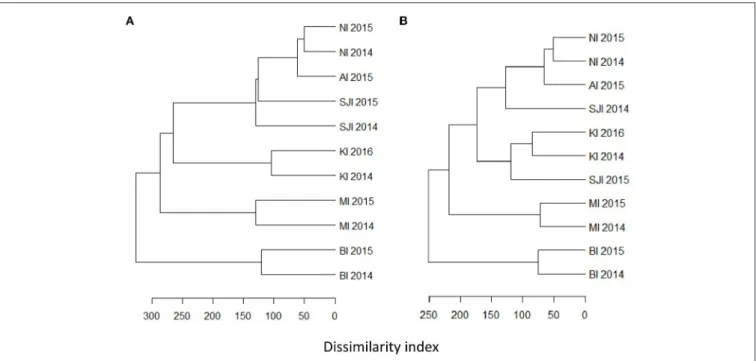
years (Table 4). The most common fish prey belonged to four families: Nototheniidae (notothens), Channichthyidae (crocodile icefishes), Congiopodidae (horsefishes), and Clupeidae (herrings, sardines and allies; Tables 5, 6). Colonies were clustered into four distinct groups according to fish species composition: (1) Falkland Islands and Albatross Islet, (2) Iles Kerguelen, (3) Macquarie Island, and (4) Bird Island (Figure 3). When grouped by family, clusters were similar to fish species, except samples from Steeple Jason in 2015 were more similar to those from Iles Kerguelen due to the high occurrence of Nototheniidae.
FIGURE 2 | Overall prey groups found in black-browed albatross scats from 2014 to 2016 using 18S_SSU primers. Sites were New Island (NI) and Steeple Jason Island (SJI), Falkland Islands; Bird Island, South Georgia (BI); Canyon des Sourcils Noirs, Iles Kerguelen (KI); and Macquarie Island (MI). Values represent the frequency of occurrence for each site. Lighter colored bars correspond to 2014, darker bars to 2015 (or 2016 for Iles Kerguelen). A prey group was considered to be present if it contributed >1% of the total sequences for that sample. Further details on the non-fish prey groups can be found inMcInnes et al. (2017b).
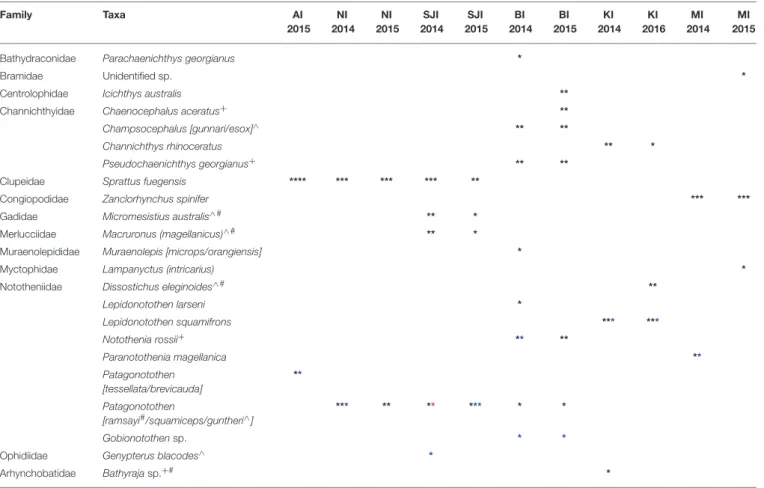
TABLE 4 | Main fish prey at each sampling colony of black-browed albatrosses. Family Taxa AI 2015 NI 2014 NI 2015 SJI 2014 SJI 2015 BI 2014 BI 2015 KI 2014 KI 2016 MI 2014 MI 2015
Bathydraconidae Parachaenichthys georgianus *
Bramidae Unidentified sp. *
Centrolophidae Icichthys australis **
Channichthyidae Chaenocephalus aceratus+ **
Champsocephalus [gunnari/esox]∧ ** **
Channichthys rhinoceratus ** *
Pseudochaenichthys georgianus+ ** **
Clupeidae Sprattus fuegensis **** *** *** *** **
Congiopodidae Zanclorhynchus spinifer *** ***
Gadidae Micromesistius australis∧# ** *
Merlucciidae Macruronus (magellanicus)∧# ** *
Muraenolepididae Muraenolepis [microps/orangiensis] *
Myctophidae Lampanyctus (intricarius) *
Nototheniidae Dissostichus eleginoides∧# **
Lepidonotothen larseni * Lepidonotothen squamifrons *** *** Notothenia rossii+ ** ** Paranotothenia magellanica ** Patagonotothen [tessellata/brevicauda] ** Patagonotothen [ramsayi#/squamiceps/guntheri∧] *** ** ** *** * * Gobionotothensp. * *
Ophidiidae Genypterus blacodes∧ *
Arhynchobatidae Bathyrajasp.+# *
∧target fishery species;+bycatch species,#not naturally accessible. Stars represent the frequency of occurrence (FOO) and relative read abundance (RRA) of amplified fish sequences:
*10–25%, ** 25–50%, *** 50–75% and **** >75%. A colored star is used when the FOO (blue) or RRA (red) were greater than the other measurement. Only species that occurred in more than one sample are included. Species in brackets are those where the genus could be confirmed but the species were either genetically similar [square brackets] or not all in Genbank (round brackets). Where only one species is in the bracket, this is the likely species given spatial distribution. Sites were Albatross Islet, Chile (AI); New Island (NI) and Steeple Jason Island (SJI), Falkland Islands; Bird Island, South Georgia (BI); Canyon des Sourcils Noirs, Iles Kerguelen (KI); and Macquarie Island (MI).
Fish from the family Nototheniidae were common to all groups. Clupeidae was common in group 1, Channichthyidae in groups 2 and 4, and Congiopodidae in group 3. The differences between years were less marked than those among colonies, as the inclusion of colony provided the best model fit (Base model AIC=1,618, F:Y AIC = 1,560, F:C AIC = 1,054, F:C+F:Y AIC
=1,175). Two to eight fish species contributed >10% of the fish
prey for each colony-year combination (in either FOO or RRA), and were found in more than one sample (Table 4).
Albatross Islet
Eight fish species were found in the 49 samples from Albatross Islet; the majority contained Fueguian sprat (Sprattus fuegensis; 88% FOO), and black southern cod or Patagonian rockcod (Patagonotothen tessellata or brevicauda) was the second most common item (29% FOO; Table 5, Figure 4).
Falkland Islands
Eight fish species were identified in the 45 samples from New Island, and contained almost exclusively (>90% of sequences) Fueguian sprat (68% FOO) and rockcod (Patagonotothen sp.; 53%
FOO; Table 5). There was no difference in the FOO of fish species consumed between years [Base model AIC = 80.27, F:Y AIC =
84.05; χ72=10.22, p = 0.17] or breeding stages [F:S AIC=97.45;
χ142 =10.82, p = 0.70; Figure 4].
Ten fish species were identified in the 51 samples from Steeple Jason Island, of which sprat was the most common species in 2014 (48% FOO), followed by hoki (Macruronus magellanicus; 21% FOO), southern blue whiting (Micromesistius australis australis; 21% FOO), rockcod (17% FOO) and kingclip (Genypterus blacodes; 10% FOO; Table 5). In 2015, rockcod was the main item (64% FOO) followed by sprat (18% FOO) and hoki (14% FOO). There was a difference in the fish species consumed between years [Base model AIC = 157.4, F:Y AIC
=152.51; χ92=22.90, p < 0.01] and breeding stages [F:S AIC
= 129.3; χ182 = 64.13, p < 0.001]. When data were adjusted
for year, the effect of stage was still significant [F:Y and F:S
AIC = 142.5; χ92 = 46.1, p < 0.001], but not vice versa [F:S
and F:Y AIC = 142.5; χ2
9 = 4.83, p = 0.85]. This is likely
to be an artifact of the timing of sampling, as no samples were collected in incubation in 2014. During incubation in 2015, samples comprised mostly rockcod, whereas in both years,
TABLE 5 | Fish prey of black-browed albatrosses at Albatross Islet (AI), Chile; and New Island (NI) and Steeple Jason Island (SJI), Falkland Islands.
Family Taxa AI 2015 (n = 49) NI 2014 (n = 19) NI 2015 (n = 26) SJI 2014 (n = 29) SJI 2015 (n = 22)
n FOO RRA n FOO RRA n FOO RRA n FOO RRA n FOO RRA
Atherinopsidae Odontesthes (regia) 1 2 2
Channichthyidae Champsocephalus [esox] 3 6 3.5
Clupeidae Sprattus fuegensis 43 88 76 13 68.4 59.5 18 69.2 63.2 14 48.3 34.9 4 18.2 18.3
Emmelichthyidae Emmelichthys nitidus (cyanescens) 1 2 0
Gadidae Micromesistius australis (australis) 6 20.7 14.4 1 4.5 0.1
Merlucciidae Macruronus (magellanicus) 1 3.8 0.8 6 20.7 17.5 3 13.6 9.7
Merluccius [hubbsior australis] 2 6.9 3.4 2 9.1 8.5
Monacanthidae Monacanthidae sp. 1 2 0.1
Moridae Salilota australis 1 4.5 0.7
Moridae sp. 2 1 3.8 1.1 Moridae sp. 3 1 3.4 3 Nototheniidae Patagonotothen [tessellata/brevicauda] 14 29 16 Patagonotothen [ramsayi/squamiceps/guntheri] 10 52.6 36.5 9 34.6 31.2 5 17.2 10.7 14 63.6 62.8
Ophidiidae Genypterus blacodes 1 5.3 3.9 3 10.3 9.6
Oreosomatidae Oreosomatidae (Pseudocyttus maculatus) 1 3.8 1 Arhynchobatidae Bathyraja sp. Salmonidae Salmoninae sp. 1 1 2 2 Salmoninae sp. 2 1 3.4 3.2 Scombridae Scombersp. 1 2 0.1
Sebastidae Sebastes (oculatus) 2 6.9 3.2
Stromateidae Stromateus (brasiliensis) 2 7.7 1.5
Unmatched Unmatched 2 7.7 1.2
Number of samples (n), frequency of occurrence (FOO, %) and relative read abundance (RRA, %). Species in brackets are those where the genus could be confirmed but the species were either genetically similar [square brackets] or not all in Genbank (round brackets). Where only one species is in the bracket, this is the likely species given spatial distribution.
samples collected during early chick-rearing were mostly of sprat and in 2014 were of kingclip. During late chick-rearing diet was more diverse, including hoki and rockcod in both years, southern blue whiting in 2014, and sprat in 2015 (Table 5,
Figure 4).
South Georgia
Sixteen fish species were found in the 68 samples from Bird Island, with two species particularly common in both years: South Georgia icefish (Pseudochaenichthys georgianus; 48 and 42% FOO) and mackerel icefish (Champsocephalus gunnari; 44 and 34% FOO). Marbled rockcod (Notothenia rossii; 26 and 24% FOO), yellow-fin notothen (Patagonotothen guntheri; 11 and 17% FOO) and humped rockcod (Gobionotothen sp.; 11.1 and 17.1% FOO) were also common. In 2014, moray cod (Muraenolepis (microps/orangiensis; 14.8% FOO) was in >10% of samples, whereas in 2015 a large proportion of samples included blackfin icefish (Chaenocephalus aceratus; 29% FOO) and southern driftfish (Icichthys australis; 27% FOO; Table 6,
Figure 4). There was an effect of year [Base model AIC = 200.2,
F:Y AIC = 196.3; χ2
15 = 33.9, p < 0.01] and breeding stage
on fish consumed [F:S AIC = 200.7; χ2
15 = 29.5, p = 0.01].
However, although breeding stage was statistically significant, the base model excluding stage still provided a better fit to the data,
even when both year and stage were included [F:Y and F:S AIC =
207.3; χ152 =18.9, p = 0.21; F:S and F:Y AIC = 207.3; χ152 =23.3,
p = 0.08].
Iles Kerguelen
Eleven fish species were found in the 46 samples from Iles Kerguelen, with the main fish species gray rockcod (Lepidonotothen squamifrons; 53 and 56% FOO) and unicorn icefish (Channichthys rhinoceratus; 33 and 19% FOO) in both years. In 2014, the other common species were skates (Bathyraja sp.; 17% FOO) and moray cod (Muraenolepis marmoratus/orangiensis; 10% FOO), whereas in 2016, Patagonian toothfish (Dissostichus eleginoides) was the second most common item (44% FOO; Table 6, Figure 4). There were more samples with unicorn icefish during incubation than chick-rearing, whereas all the toothfish was consumed during chick-rearing. There was an effect of year [base model AIC = 113.6, F:Y AIC =
112.8; χ102 =20.8, p = 0.03] and breeding stage on the fish species
consumed [F:S AIC =113.1; χ2
10=20.5, p < 0.03].
Macquarie Island
Sixteen species were found in the 36 samples from Macquarie Island (Table 6). In both years, samples mostly contained Antarctic horsefish (Zanclorhynchus spinifer; 65 and 70% FOO)
TABLE 6 | Fish prey of black-browed albatrosses at Bird Island, South Georgia UK (BI); Iles Kerguelen, France (KI) and Macquarie Island, Australia (MI). Family Taxa BI 2014 (n = 27) BI 2015 (n = 41) KI 2014 (n = 30) KI 2016 (n = 16) MI 2014 (n = 26) MI 2015 (n = 10)
n FOO RRA n FOO RRA n FOO RRA n FOO RRA n FOO RRA n FOO RRA
Alepisauridae Alepisaurus (ferox/brevirostris) 1 3.7 1.2
Anotopteridae Anotopterus vorax 1 3.7 0.1 1 2.4 0.1
Bathydraconidae Parachaenichthys georgianus 3 11.1 4.4 4 9.8 4.8
Bramidae Unidentified sp. 2 20 10
Centrolophidae Icichthys australis 11 26.8 20.4 1 3.3 3.3
Channichthyidae Chaenocephalus aceratus 2 7.4 4.4 12 29.3 9.3 Champsocephalus [gunnari/esox] 12 44.4 23.5 14 34.1 18.7
Channichthys rhinoceratus 10 33.3 20.6 3 18.8 6.9
Pseudochaenichthys georgianus 13 48.1 25.4 17 41.5 20.2
Congiopodidae Zanclorhynchus spinifer 1 3.3 3.3 17 65.4 55.7 7 70 57.3
Gempylidae Unidentified sp. 1 3.7 3.3 1 2.4 0.8
Harpagiferidae Harpagifer
(macquariensis/georgianus)
1 3.8 0.1
Lampridae Lampris immaculatus 1 3.8 3.8 1 10 9.8
Macrouridae Coryphaenoidessp. 1 3.8 3.8 1 10 10
Microstomatidae Microstoma (microstoma/australis) 2 7.7 4.2
Moridae Halargyreus johnsonii 1 6.3 4.4 1 3.8 3.8
Muraenolepididae Muraenolepis [marmorata/orangiensis]
3 10 5.9 1 6.3 6.2
Muraenolepis [microps/orangiensis] 4 14.8 11.4
Muraenolepissp. 1 3.8 1 1 10 1.7
Myctophidae Lampanyctus (intricarius) 1 3.8 1.8 1 10 0.1
Myctophidaesp.1 1 3.8 0.6
Myctophidaesp.2 1 3.8 1
Nomeidae Cubiceps (caeruleus) 1 3.8 2.9
Nototheniidae Dissostichus eleginoides 2 6.7 3.5 7 43.8 32.9 1 3.8 1.3
Lepidonotothen larseni 3 11.1 3.8 Lepidonotothen squamifrons 1 3.7 0.7 1 2.4 0.3 16 53.3 48.5 9 56.3 49.4 Notothenia rossii 7 25.9 11.1 10 24.4 8.7 Paranotothenia magellanica 2 6.7 3.7 8 30.8 17.4 1 10 10.1 Patagonotothen (ramsayi/squamiceps/guntheri) 3 11.1 4.6 7 17.1 6.4 Trematomussp. 1 3.3 3.3 Gobionotothen (gibberifrons/marionensis) 3 11.1 6 7 17.1 8.2
Oreosomatidae Oreosomatidae (Pseudocyttus maculatus)
1 2.4 1.7
Paralepididae Magnisudis (atlantica/prionosa) 1 2.4 0.2
Psychrolutidae Psychrolutidae sp. 1 3.8 2.6
Arhynchobatidae Bathyrajasp. 5 16.7 7.7
Scombridae Scomber scombrus 1 6.3 0.1
Number of samples (n), frequency of occurrence (FOO) and relative read abundance (RRA). Species in brackets were those where the genus could be confirmed but the species were either genetically similar [square brackets] or not all on Genbank (round brackets). Where only one species is in the bracket, this is the likely species given spatial distribution.
and Magellanic rockcod (Paranotothenia magellanica; 31 and 10% FOO). In 2015, one unidentified species, likely from the family Bramidae, made up 20% of samples, although this may reflect the small sample size (n = 10). Fish species composition did not differ between years [Base AIC
= 177.4, F:Y AIC = 190.6; χ152 = 16.8, p = 0.33];
the effect of breeding stage was of borderline statistical
significance [F:S AIC = 193.5; χ2
30 = 43.9, p = 0.05], but
the base model excluding stage still provided a better fit to the data.
FIGURE 3 | Hierarchical clustering of frequency of occurrence of fish at each site at the level of (A) species, and (B) family. Clusters were based on dissimilarity indices calculated with the Manhattan method, and hierarchical clustering was constructed using the average agglomeration method.
Overlaps between Commercial Fishery
Species and BBA Prey
Longline Fisheries
Diets of BBA from New Island and Steeple Jason Island did not include any target or bycatch species from longline fisheries operating in the Falkland Islands FICZ/FOCZ. At Iles Kerguelen, diet samples included DNA from the target species, Patagonian toothfish in January of both years (with much higher proportions in 2016; Tables 6, 7) and a bycaught group, skates, in December/January 2014/15 (Table 7, Figure 5). Bait fish, Scomber scombrus also appeared in samples, but occurred infrequently (<2% of sample sequences). This is a northern hemisphere species used as baits in longline fishing, and is therefore only available to BBA from fisheries. In the Kerguelen EEZ, the amount of toothfish discarded was lowest in November and December 2013 (0.19 and 0.18 t, respectively) and highest in January (1.6 t in 2014 and 2.9 t in 2016). More skates were discarded in December and January 2013/14 (0.3 t in November, 5.3 t in December and 9.4 t in January 2013/14; and 2 t in January 2016), which matched with the relative FOO in the diet in the 2 years.
Trawl Fisheries
The trawl fisheries operating in the Falkland FICZ/FOCZ target eight fish species (Table 3). No bycatch species made up more than 1% of the reported catch. Fishery target species were found in the diet at both sites in each year (Table 7, Figure 5). At New Island, the main fishery target species in the diet was rockcod (91% of those samples with a target species); one sample also contained hoki, and one was of kingclip only. At Steeple Jason Island, BBAs consumed five target species in 2014 (rockcod, hake,
hoki, southern blue whiting, and kingclip), whereas samples included three target species in 2015 (rockcod, hoki, and hake;
Table 6, Figure 6). The number of samples with fishery target species was lower during early chick rearing (December/January) than either incubation (October-November) or late chick rearing (February-March; Figure 6A). This corresponded to the relative catch in the fishery, particularly during January when it was not operating (Figure 6A). The main catch species in the fishery was rockcod during incubation, and hoki in late chick rearing (Figure 6C). The cluster analysis showed four distinct clusters, with one highlighting the similarity between fishery catch and fish prey of BBA during December 2013 at New Island and October 2014 at both sites, and between fishery catch during March and fish prey of BBA at Steeple Jason (Figure 6D).
At South Georgia, the fishery target species (mackerel icefish) and four bycatch species (South Georgian icefish, yellow-fin notothen, gray rockcod, and marbled rockcod) were all recorded in the diets of BBA (Table 6), and in a substantial proportion of the samples in both years (Table 7, Figure 5). The amount of target and bycatch fish species in the diet of BBA did not correspond to the relative catch rates in the fishery. During the sampling period the fishery caught very little mackerel icefish during January 2014 (65 kg), and only 3 tons during February 2014, with 1 ton of South Georgia icefish as bycatch. Over the same period in 2015, the fishery caught 133 tons of mackerel icefish in January, and 144 tons in February, with 70 and 51 tons of yellow-fin notothen bycaught in each month, respectively. Other bycatch included 1 ton of South Georgia icefish, 2 tons of gray rockcod and 4 tons of marbled rockcod, all of which were caught during the 2015 South Georgia groundfish survey.
FIGURE 4 | The proportion of fish sequences in the diet of black-browed albatrosses by breeding stage, site and year. Breeding stages were: incubation
(October-mid December), early-chick rearing (mid-December-end of January), late-chick-rearing (February onwards). The single sample collected at Macquarie Island during late chick rearing in 2015 was excluded (the DNA sequences were all from the family Bramidae; genus unknown).
Breeding Success and Use of Discards
The proportion of sampled birds that had consumed discards was estimated to range from zero at Bird Island to 60% at Steeple Jason. This is based on the conservative assumption that any species which was also available naturally to albatrosses
was not considered to have been obtained as a discard (Table 7). Breeding success (chicks fledged/eggs laid) during the years that diet samples were collected ranged from zero at Albatross Islet to 84% at New Island. There was a positive correlation between the proportion of samples that contained
TABLE 7 | The proportion of scat samples that contained DNA from target and bycaught species in commercial fisheries operating in adjacent waters during the study.
Site Year Proportion of fish
samples with fishery target species∧ Proportion of fish samples with fishery bycatch species∧ Proportion of fish samples containing any fishery species∧ Proportion of fish samples with inaccessible species∧ Proportion of all samples containing fishery species* Proportion all samples with inaccessible species* TRAWL FISHERY New Island 2013/14 57.9 0 57.9 52.6 55.3 50.2 2014/15 34.6 0 34.6 34.6 32.1 32.1
Steeple Jason Island 2013/14 62.1 0 62.1 55.2 45.3 40.2
2014/15 81.8 0 81.8 77.3 63.4 59.9 Bird Island 2013/14 44.4 74.1 85.2 0 77.4 0 2014/15 34.1 70.7 78.1 0 72.5 0 LONG-LINE FISHERY New Island 2013/14 0 0 0 0 0 0 2014/15 0 0 0 0 0 0
Steeple Jason Island 2013/14 0 0 0 0 0 0
2014/15 0 0 0 0 0 0
Iles Kerguelen 2013/14 6.7 16.7 20.0 20 20.0 20
2015/16 43.8 0 43.8 43.8 43.8 43.8
These are the proportion of samples that amplified with the 16S_Fish primer (∧), except the final two columns which is the proportion of all samples that contained food DNA amplified
with the 18S_SSU primers (*). All listed fishery bycatch species constituted >1% of the total catch. Inaccessible fish species—those that occur below the dive depth of albatrosses; includes skates, toothfish, southern blue whiting, rock cod and hoki (Table S1 in Supplementary Material).
discarded fish, and breeding success (r = 0.81, p < 0.001;
Figure 7).
DISCUSSION
This is the first study to use DNA metabarcoding to identify the fish prey diversity of seabird and use this to evaluate the occurrence of fishery discards in the diet across a broad geographic scale. This technique enabled us to identify an extensive diversity of fish in the diet of BBA, including a similar number of species and families as that recorded in all previous published studies for this species combined (31 families and 52 species). We also detected more fish species on average at each sampling site than in the conventional studies based on otoliths and similar numbers to studies using multiple body parts (Data Sheet 1 in Supplementary Material). There was a clear overlap between the species targeted by fisheries operating in adjacent waters, and the diet of BBA at the local colony. This was most evident at the Falkland Islands and Iles Kerguelen where the higher catch rates of target and bycatch species (or the amount discarded, where known) in a particular year corresponded with the relative occurrence in the diet. Our data also highlighted regions, such as South Georgia, where BBA diet overlapped with fishery target species, but the birds likely obtained the fish naturally. In this situation, there is the potential for resource competition but no reason to assume direct interaction with vessels or incidental mortality of foraging adults.
Amplification Success
The number of samples that contained food DNA in this study varied between sites and in some cases were quite low. There are
numerous factors that can affect the amplification of food DNA including the primers/markers chosen, whether blocking primers were used, sample selection, timing during the breeding season and experience of the field personnel. We chose the combination of the universal metazoan marker (18S) and group specific markers (16S) to get a broad picture of the diet at the population level and specific information on the fish species consumed. Universal metazoan markers are useful dietary markers as they amplify DNA from all eukaryotes, which enables all possible prey groups to be identified. However, they also amplify
non-food DNA such as plant, parasite, and consumer DNA (McInnes
et al., 2017a). A consumer blocking primer can increase the
detection of food DNA (Vestheim and Jarman, 2008), but
was not used in this study as they may inadvertently block
similar groups such as other vertebrates like fish (Piñol et al.,
2015). This likely reduced the sample size, but provided more
reliable results from higher quality samples containing more food DNA. During our study, fresh samples were targeted and the inadvertent collection of dirt and vegetation was minimized where possible. However, with such a large study across a range of environmental conditions this was not always possible. In addition, many samples collected during incubation had little food DNA due to birds fasting. Subsequent to the data collection for this study, optimized scat collection protocols for DNA dietary metabarcoding have been developed that will hopefully improve the amount of DNA detected in future studies allowing
diet data to be collected during all breeding stages (McInnes et al.,
2017a).
Fish Prey Diversity
The fish prey consumed by BBAs varied considerably across their breeding range. Species in the family Nototheniidae were
FIGURE 5 | The proportion of samples that contained target, bycatch or non-fishery species as either (A) >1% of sequences in a sample, or (B) >75% of the sequences in a sample. Samples with <75% of sequences in any category were considered to be mixed. Bycatch species each constituted >1% of the total catch. Sites were New Island (NI) and Steeple Jason Island (SJI), Falkland Islands; Bird Island, South Georgia (BI) and Canyon des Sourcils Noirs, Iles Kerguelen (KI).
common in scat samples from the sub-Antarctic sites, as were icefish (Channichthyidae) and horsefish (Congiopodidae). However, aside from the genus Patagonotothen, there were no nototheniids found in the samples from the Falkland Islands and Chile, whereas sprat (Clupeidae) was common. Of those species that contributed >10% of the sequences/samples at any site, 80% of these fish species were likely to be obtained naturally, as they are known to occur at depths accessible to albatrosses (maximum
4.5 m;Prince and Huin, 1994). The remaining species are not
known to occur in waters shallower than 4.5 m and are hence likely to be obtained as discards.
This study detected several species that were not identified, or were very uncommon, in the diet of BBA in previous studies, particularly the Fueguian sprat, Antarctic horsefish, and southern
driftfish. This was the first study of fish in the diet of BBA at Albatross Islet, and the first published study of BBA diet at Macquarie Island, which may explain some of these discoveries. Sprat was not recorded previously in the diet of BBA at any site (Data Sheet 1 in Supplementary Material), despite being the most common item in our study at the Falkland Islands and Chile. There was an unidentified clupeid in the diet at Diego
Ramirez in 2001 and 2002 (Arata and Xavier, 2003), and a small
unidentified fish at New Island in 1987 that made up 80% of
the fish prey (Thompson, 1992), which may have been sprat.
This species has a high biomass across the southern Patagonian
shelf as far as the Magellan Strait (Sánchez et al., 1995), Chilean
channel waters (Diez et al., 2012) and around the Falkland Islands
FIGURE 6 | Comparison between back-browed albatross fish prey and fishery catch amounts at the Falkland Islands by month from December 2013-March 2014 (excluding February) and October 2014 to March 2015. Solid borders represent New Island; dashed borders represent Steeple Jason. (A) Scats with or without fishery target species (black and gray bars, respectively), compared to the total catch in the fishery (blue line). (B) The proportion of scat samples containing each of the target species. (C) Total catches in the fishery by species. (D) The hierarchical clustering of albatross diet and fishery catch data by month, based on the proportion of sequences (RRA, black text) and proportion of catch (blue text). Clusters were based on dissimilarity indices calculated with the Manhattan method, and hierarchical clustering was constructed using the average agglomeration method (note low sample sizes during January 2014 and 2015). As food DNA may persist in scats for several days (Deagle et al., 2010), there may be some carry-over of prey caught in the previous month if samples were collected early in the month, which was the case in January of both years.
FIGURE 7 | The proportion of scat samples from black-browed albatrosses that contained discard species in relation to breeding success for that site and year. The colors corresponds to the current population trend:
green—increasing; blue—stable; black—declining (ACAP, 2010; Wolfaardt, 2013; Poncet et al., 2017). These are minimum estimates of discard occurrence, including only the species that are not known to be naturally accessible to albatrosses (Table S1 in Supplementary Material). Albatross Islet suffered complete breeding success failure due to mammalian predation and was therefore excluded from the analysis.
marine mammals in the region (Thompson, 1993; Baylis et al.,
2014; Handley et al., 2016). There is also a sprat hotspot to the
west of the Falkland Islands, close to both Steeple Jason and New Island, which may explain the prevalence in the diet at these sites
(Gras et al., 2017).
Antarctic horsefish was the main fish species consumed at Macquarie Island and is endemic to the Macquarie and
Kerguelen plateaus (Duhamel et al., 2014). Antarctic horsefish
has been detected previously, but only in low frequency in
BBA diets at Iles Kerguelen (Cherel et al., 2000, 2002). Very
little is known about the abundance of horsefish or other fish around Macquarie Island. Horsefish have been detected in the diet of gentoo penguins (Pygoscelis papua; 39% FOO) and itinerant New Zealand sea lions at Macquarie Island (Phocarctos
hookeri; 63% FOO;Robinson and Hindell, 1996; McMahon et al.,
1999); however the majority of fish consumed by other seabirds
and seals are myctophids, and to a lesser extent nototheniids
(Goldsworthy et al., 2001).
The southern driftfish was detected in a quarter of samples at Bird Island in 2015 and one sample at Iles Kerguelen. It has only been recorded once in the diet of BBA at South Georgia,
in 1986 (Reid et al., 1996; Croxall et al., 1997), and rarely in
the diet of other seabirds (Croxall et al., 1995; Catard et al.,
2000), though has been detected more commonly in seal diets
(Guinet et al., 2001; Lea et al., 2008). Southern driftfish have a
circumpolar distribution (Gon and Heemstra, 1990), although
are rarely caught during trawls in the Scotia Sea (Collins et al.,
2012) and none were recorded during a groundfish survey in
January 2015, at the time when the scat samples were obtained
(Belchier et al., 2015). It is surprising given our results that
only one sample was detected in 20 years of conventional diet studies at South Georgia (British Antarctic Survey unpublished data). There are a few possible explanations: most of the previous studies were later in the season (February onwards) and represent chick diet, whereas our samples were from adults; alternatively, driftfish may be consumed as larvae and therefore the hardparts may be undetectable in stomach contents.
The other main fish prey at Bird Island and Iles Kerguelen were similar to the previous studies at each site (Data sheet 1 in Supplementary Material). At South Georgia, mackerel icefish are
common prey (Prince, 1980; Reid et al., 1996; Croxall et al., 1997,
1999; Xavier et al., 2003). However, the diversity of fish in our
study was much higher than in previous studies at Bird Island using only otoliths, which identified ten fish species overall, and less than five in any year (Data Sheet 1 in Supplementary Material). In comparison, we detected 16 species using DNA metabarcoding, with 13 in each year. Some of this diversity could relate to secondary ingestion; however, all of the species that contributed >10% of the diets (n = 8 and n = 7) were the sole prey item in at least one sample, suggesting they were the primary prey. At Iles Kerguelen, gray rockcod and unicorn icefish are two
of the most abundant fish species in the Kerguelen EEZ (Duhamel
and Hautecoeur, 2009) and were common in the diet of BBA
at Canyon des Sourcils Noirs in a previous study (Cherel et al.,
2000). When sample size differences were taken into account, the
fish diversity was similar to previous studies at Iles Kerguelen
where otoliths, bones and vertebrae were used (Cherel et al.,
2000). In our study, there were some fish species identified in
just one sample that are not usually found at those sites, such as Trematomus sp. at Iles Kerguelen. These could have originated from scats produced by juvenile or non-breeding birds, or as residual DNA from previous foraging trips far from the islands. For these reasons, we focused on fish species present in at least 10% of samples.
Overlaps between Commercial Fisheries
and Albatross Diet
There were five fish species detected in the scats that were unlikely to be naturally accessible to BBAs during the sampling period due to the known depth profile of fish. These included skates and Patagonian toothfish at Iles Kerguelen, and rockcod, hoki and southern blue whiting at the Falkland Islands. These species were present in fishery catches from the same time period, suggesting vessels were the likely source. At Iles Kerguelen, Patagonian toothfish and skates have no developmental stage where they have been observed at an accessible depth to albatross (Table S1 in Supplementary Material). Skates are demersal and the closest to the surface that toothfish have been recorded is during their larval stage (∼50 m depth), during winter and spring
at Iles Kerguelen (Loeb et al., 1993; Mori et al., 2016). Patagonian
toothfish were the most common fish in previous BBA dietary studies at Iles Nuageuses in 1994, and second most common at
Canyon des Sourcils Noirs in 1994 (Cherel et al., 2000, 2002).
exulans) suggest that albatross can consume Patagonian toothfish
naturally (Weimerskirch et al., 1997), but how they obtain
demersal prey is largely unknown (Cherel et al., 2000). It is
possible that albatrosses scavenge prey brought up by deep-diving
predators such as seals or whales (Sakamoto et al., 2009). In our
study, the occurrence of Patagonian toothfish in the diet of birds from Iles Kerguelen did increase with an increase in discards, however, the amount of discarded toothfish from the fishery was low relative to the large albatross population. This result suggests that albatross may also be consuming Patagonian toothfish as natural prey as well as fishery discards during this study in unknown respective proportions. Although seabird bycatch rates in this fishery were very high in the 1990s and early 2000s
(Delord et al., 2005), no albatross mortalities have been reported
in recent years (CCAMLR, 2014a). This reflects the adoption
of mitigation measures which include night setting, streamer lines, retention of offal during setting and fast hook sink rates
(CCAMLR, 2014b). Discarding is still permitted in the Kerguelen
toothfish fishery, which is still of concern. Discards increase vessel attractiveness and it is difficult to ensure mitigation is 100% effective for the smaller, more maneuvrable, deeper-diving species, particularly those such as white-chinned petrels (Procellaria aequinoctialis) which, unlike albatrosses, scavenge
behind vessels in large numbers during darkness (Phillips et al.,
2016). Moreover, individual birds will associate vessels with
food, which is problematic if they overlap with fisheries under a different jurisdiction where there is poor compliance with seabird bycatch mitigation. Indeed, wandering albatrosses, which habitually follow vessels, may alter their flight path from 30 km
away to approach a fishing vessel (Collet et al., 2015).
At the Falkland Islands, the frequency of rockcod and hoki in the diet corresponded to the relative fishery catches of these species, suggesting they were likely obtained as discards. Although this correlation could also reflect availability of fish stocks, these species are not known to be naturally accessible to albatross. Occurrence varied between sites and breeding stages, and was lowest during early chick rearing, which is consistent with the previous stable isotope study which found that pelagic
fish were more common than demersal species (Granadeiro et al.,
2013). During early chick-rearing, the fishery catch was zero
to low, and therefore there was limited opportunity to exploit discards. However, during incubation and late chick rearing, the frequency of target fishery species in the albatrosses’ diet was much higher. The occurrence of fishery species in BBA samples was greater at Steeple Jason than New Island, which is 70 km further south. This may be an artifact of the sampling month, given differences in timing; however, this does not explain all of the variation. The samples collected in the same month (e.g., January) were comparable, but no trawl fishery was operating. The few samples with fishery target species at New Island in November, when catch rates were relatively high, does not seem to match the trend at Steeple Jason for the preceding month. Previous studies at the Falklands also found more offal and discards in the diet of BBA at Steeple Jason than New Island, however, as there were few heads and therefore otoliths, the fish
species could not be identified (Thompson, 1992). In the western
part of the FICZ, there are two types of fishing grounds: one is
to the northwest of Steeple Jason where trawlers target rockcod and one in deeper waters (>200 m) to the west-southwest which targets primarily hoki and southern blue whiting. Previous tracking studies found that Steeple Jason birds were more likely to attend vessels even when the distance to the fishing ground was
similar for each colony (Granadeiro et al., 2011). Further research
is needed to understand this observation.
The consumption of fishery discards by black-browed albatrosses at both sites in the Falklands puts birds at risk of incidental mortality. An estimated 800 BBAs are killed annually
in Falkland Island trawl fisheries (Kuepfer, 2015). Although
use of paired streamer lines is compulsory on all vessels,
continuous discarding is still permitted (Quintin and Pompert,
2014). At the time of this study, the fishing fleet had limited
capacity to retain offal on-board or process this into fishmeal; however, it has been recommended that any new vessels entering the fishery should have capabilities for more effective waste
management (Sancho, 2009). Strict discard policies employed
by trawl vessels operating in waters within the jurisdiction of CCAMLR have minimized exposure of birds to warp cables by retaining discards on-board until after shooting or hauling of fishing gear; consequently, the occurrence of incidental mortality
is close to zero (CCAMLR, 2014b). Implementation of improved
discard management measures around the Falkland Islands will be essential to reduce incidental mortality in trawl fisheries in the
future (Abraham et al., 2009; Pierre et al., 2012).
Competition with Fisheries and Reliance
on Fishery Discards
South Georgian and mackerel icefishes were the two most common fish consumed by BBA at South Georgia in both years. Although, mackerel icefish is targeted by the fishery, and South Georgia icefish is bycaught, the BBA at Bird Island were likely to have obtained these species naturally. Very few fish were caught by the fishery during the diet sampling period of 2014 and they are known to occur at an accessible depth to albatross. Five other common prey species of BBAs at South Georgia are also caught in the icefish fishery, with bycatch limits set by CCAMLR (South Georgia icefish, marbled rockcod, yellow-fin notothen, humped rockcod, blackfin icefish). Mackerel icefish was the most common
fish in the diet of BBA at South Georgia from 1996 to 2000 (Xavier
et al., 2003) and in more recent years (British Antarctic Survey
unpublished data). Icefish and BBA are both krill predators, and in years of low krill availability, icefish are likely to provide a
valuable alternate food source for albatrosses (Reid et al., 1996).
The BBA population at South Georgia is declining, and although this appears to be due mainly to incidental mortality during the
non-breeding period (Poncet et al., 2017), their breeding success
is also lower than conspecifics in the Indian Ocean (Nevoux
et al., 2010). During our study, the proportion of krill in the diet
was low (Figure 2), and over the last 20 years of conventional sampling (in mid-late chick rearing), krill has contributed <20% of the diet in only 4 years, two of which were 2014 and 2015 (18.5 and 5.6%, respectively; British Antarctic Survey unpublished data). Given the decline in krill, and high consumption by BBAs of species that are also targeted or bycaught in the icefish fishery,