Tiago Ferreira de Azevedo
Liquid effluent treatment resorting to
microalgae cultivation
Outubro 2019 UMinho | 2019 Tiago F er reir a de Aze vedo Liq uid ef fluent tr eatment r esor ting t o micr oalg ae cultiv ationUniversidade do Minho
Escola de Ciências
Tiago Ferreira de Azevedo
Liquid effluent treatment resorting to
microalgae cultivation
Dissertação de Mestrado
Mestrado em Biologia Molucular, Biotecnologia e
Bioempreendedorismo em Plantas
Trabalho efetuado sob a orientação da
Professora Doutora Sara Martins Badenes
Professora Isabel Aguiar Pinto Mina
Universidade do Minho
Escola de Ciências
ii
DIREITOS DE AUTOR E CONDIÇÕES DE UTILIZAÇÃO DO TRABALHO POR TERCEIROS
Este é um trabalho académico que pode ser utilizado por terceiros desde que respeitadas as regras e boas práticas internacionalmente aceites, no que concerne aos direitos de autor e direitos conexos. Assim, o presente trabalho pode ser utilizado nos termos previstos na licença abaixo indicada.
Caso o utilizador necessite de permissão para poder fazer um uso do trabalho em condições não previstas no licenciamento indicado, deverá contactar o autor, através do RepositóriUM da Universidade do Minho.
iii
A
GRADECIMENTOSI would like to thank to University of Minho, School of Science and A4F – Algae for Future for the opportunity given to perform this thesis. Thank to PhD. Sara Badenes and teacher Isabel Aguiar Pinto Mina for embrace this theme and for all the availability, guidance, support, advices and suggestions.
Thanks to all A4F team members and special thanks to the remaining students that were performing their thesis and their internships for the fun moments in the lab and all the advices, help and support given.
Thanks to all my family and my girlfriend Nina for the love, the support, for believing in me and for being by my side not only during tough times but also in glorious moments.
Last but not least, thanks to my closest friends that I know since we were little kids and all remaining friends that somehow contribute to achieve the level where I am in this stage of my life.
iv
STATEMENT OF INTEGRITY
I hereby declare having conducted this academic work with integrity. I confirm that I have not used plagiarism or any form of undue use of information or falsification of results along the process leading to its elaboration.
v
R
ESUMOBioreatores do tipo raceway para produção de microalgas instalados numa estação de tratamento de águas residuais domésticas (ETAR) e numa unidade industrial de fertilizantes foram acompanhados e avaliados por um período de aproximadamente 11 meses. O crescimento natural de microalgas, maioritariamente Scenedesmus obliquus e Scenedesmus quadricauda, foi determinado para avaliar a sua eventual participação no tratamento de águas residuais domésticas e do efluente proveniente de uma fábrica de fertilizantes. Na ETAR foram instalados dois raceways, respetivamente após o tratamento primário e o tratamento secundário. Na Unidade industrial, a instalação de um bioreator raceway teve por objetivo o desenvolvimento das microalgas visando a redução de nutrientes do efluente com a eventual redução de custos associados ao seu tratamento.
A avaliação do crescimento das microalgas nos raceways foi feita por determinação de peso seco (g / m2) de 107 amostras.
Para avaliar a atividade das microalgas foram feitas análises rotineiras para determinação de nitratos e análises em laboratórios externos para determinação de outro tipo de nutrientes (azoto total, amónia, azoto Kjeldahl, fósforo total). Os resultados obtidos das análises feitas pelos laboratórios externos demonstraram que na amostra recolhida do raceway após o tratamento secundário uma remoção de amónia de 95 %, 39 % azoto Kjeldahl e 73% de azoto total. Apenas o valor de amónia de 3.36 mg / L esteve abaixo do limite de descarga de 10 mg/ L.
Para avaliar a qualidade do efluente após a atividade das microalgas foram também avaliados a carência bioquímica de oxigénio (CBO5) e carência química de oxigénio (CQO), no entanto foram feitas
análises apenas a uma amostra dos diferentes sistemas e por isso não pode ser considerada representativa.
Um dos passos após o tratamento de efluentes é o aproveitamento da biomassa. Para isso foi necessário recorrer à desidratação da mesma usando processos de floculação.
Apesar dos resultados, esta abordagem ficou por otimizar ao contrário da colheita feita por centrifugação onde foi obtido um rendimento de 76%.
Palavras-chave
vi
A
BSTRACTBioreactors from raceway category for microalgae production installed in domestic wastewater treatment facility and in fertilizers industrial plant were followed for approximately 11 months.
Microalgae natural growth, mainly Scenedesmus obliquus and Scenedesmus quadricauda, was determined to evaluate their participation in domestic wastewater treatment and effluent from fertilizer plant.
At WWTF, two raceways were installed, respectively after primary treatment and secondary treatment.
At FIP, the installation of one raceway bioreactor had as main goal microalgae development, aiming nutrient removal from the effluent with potential reduction costs associated to the treatment.
Microalgae growth evaluation in raceways was accomplished through determination of biomass dry weight from 107 samples.
To evaluate microalgae activity, routine analysis were made for nitrate determination and external laboratories analysis for nutrient content determination (total nitrogen, ammonia, Kjeldahl nitrogen and total phosphorus). The obtained results from analysis performed by external laboratories demonstrated that collected sample from secondary treatment raceway presented 95 % ammonia removal, 39 % Kjeldahl nitrogen and 73 % total nitrogen. Only ammonia concentration of 3.36 mg/ L was under discharged limit value of 10 mg/ L.
To evaluate effluent quality after microalgae activity biochemical oxygen demand and chemical oxygen demand were also evaluated. However, only one sample from the different systems were evaluated and, therefore, they cannot be considered representative.
One of the following steps after effluent treatment is biomass recovery. It was necessary to reach their dehydration using flocculation processes.
Although the results, this approach was not optimized unlike the harvest performed using centrifuge where 76% yield was achieved.
Key-Words
vii
I
NDEX Agradecimentos ... iii Resumo... v Abstract... vi List of Figures ... ix List of Tables ... xiList of Abbreviations ... xii
1 Introdução ... 1
1.1 Framework ... 1
1.2 Wastewater resource recovery facility ... 1
1.3 Fertilizer Industrial Plant ... 3
1.4 Microalgae characteristics ... 3
1.5 Nitrate, Phosphorus and Carbon Dioxide ... 4
1.6 Open cultivation systems vs closed cultivation systems ... 6
1.7 Harvesting ... 8
2 Aim ... 11
3 Materials and Methods ... 12
3.1 Operational procedures at the Water Resources Recovery Facility (WRRF) for sample collection, replace volume and renewals ... 12
3.2 Operational procedures at the Chemical Industrial Plant (FIP) for sample collection, replace volume and renewals ... 12
3.3 Analytical methods ... 13
3.3.1 Biomass Dry Weight ... 13
3.3.2 Nitrate Concentration ... 13
3.3.3 Ammonia Concentration ... 13
3.3.4 Microscopic Observation ... 14
3.4 Flocculation ... 14
3.5 Separator operation ... 16
viii
4 Results and Discussion ... 19
4.1 WRRF culture analysis ... 19
4.2 External Laboratory Results ... 27
4.3 FIP culture analysis ... 30
4.4 Flocculation tests... 35
4.5 Harvesting ... 41
5 Conclusion ... 43
ix
L
IST OFF
IGURESFigure 1 - Wastewater treatment plant diagram (Nammam Ali Azadi, Reza Ali Falahzadeh, 2015). ... 2
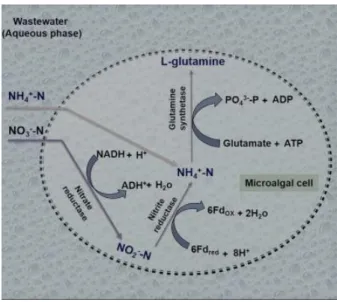
Figure 2 - Nitrogen pathway in microalgae cell (Salama, Kurade, Abou-shanab, & El-dalatony, 2017). .. 4
Figure 3 - Calvin-Benson cycle (Sydney et al., 2014). ... 6
Figure 4 - Raceway pond, circular pond and artificial pond scheme. ... 7
Figure 5 - Harvesting process diagram (Barros, Gonçalves, Simões, & Pires, 2015). ... 8
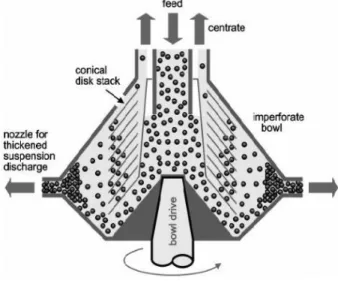
Figure 6 - Representation of a disc stack centrifuge (E.S.Tarleton; R.J.Wakeman, 2007). ... 10
Figure 7 – Falcons with microalgae culture for flocculation process with different FeCl₃ concentrations. ... 14
Figure 8 – Falcons with microalgae culture for flocculation test with biopolymer and FeCl3 different concentrations. ... 15
Figure 9 – Microalgae culture from A4F raceway for biopolymer and FeCl3 flocculation test. ... 15
Figure 10 – Separator scheme for biomass dehydration. ... 16
Figure 11 - Secondary treatment raceway (STRW) biomass concentration (DW g/m²) (x) and nitrate content (mg / L) (o) along a 311 days period. ... 19
Figure 12 – Secondary treatment raceway (STRW) biomass concentration (DW g/m²) (x) and nitrate content (mg / L) (o) from September to December. ... 21
Figure 13 – Secondary treatment raceway (STRW) biomass concentration (DW g/m²) (x) and nitrate content (mg / L) (o) from January to April. ... 22
Figure 14 – Secondary treatment raceway (STRW) biomass concentration (DW g/m²) (x) and nitrate content (mg / L) (o) from May to July. ... 22
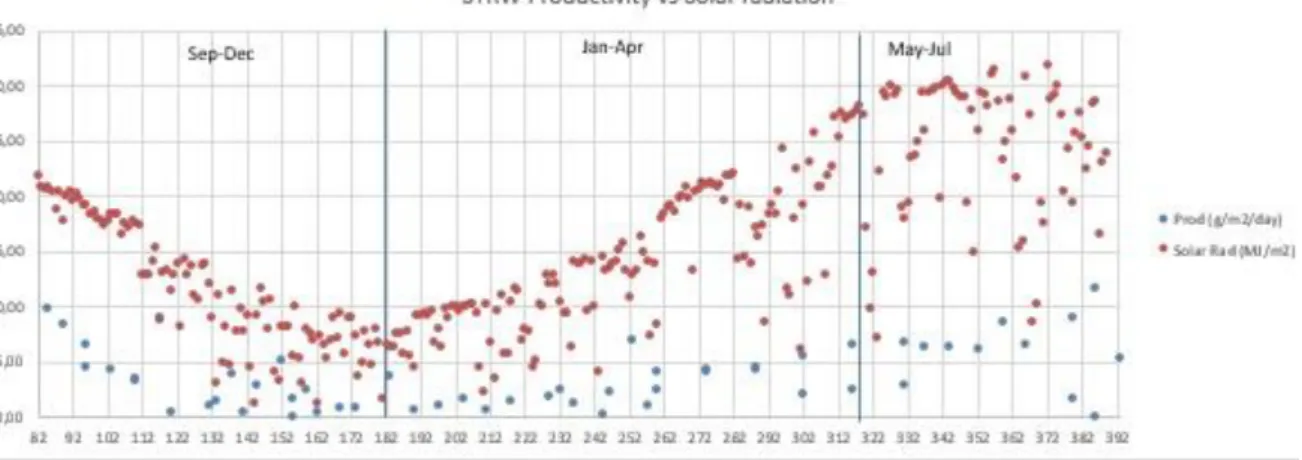
Figure 15 – Secondary treatment raceway (STRW) productivity (o) vs Average Solar radiation (o) from September to July. ... 23
Figure 16 – Tertiary treatment raceway (TTRW) biomass concentration (DW g/m²) (x) and nitrate content (mg / L) (o) along a 311 days period. ... 24
Figure 17 - Tertiary treatment raceway (TTRW) biomass concentration (DW g/m²) (x) and nitrate content (mg / L) (o) from September to December. ... 24
Figure 18 - Tertiary treatment raceway (TTRW) biomass concentration (DW g/m²) (x) and nitrate content (mg / L) (o) from January to April. ... 25
Figure 19 - Tertiary treatment raceway (TTRW) biomass concentration (DW g/m²) (x) and nitrate content (mg / L) (o) from May to July. ... 26
x
Figure 20 - Secondary treatment raceway (STRW) productivity (o) vs Average Solar radiation (o) from September to July. ... 26 Figure 21 – Ammoniacal nitrogen (NH4 – N), Kjeldhal nitrogen (Kjeldhal – N), Total nitrogen (Total – N), Biochemical oxygen demand (BOD5), Chemical oxygen demand (COD) and Total phosphorus (Total – P) from Secondary treatment raceway effluent (o) and culture (o) ;Tertiary treatment raceway effluent (o) and culture (o);Discharge Limit Values (o). ... 28 Figure 22 – Fertilizer Industrial Plant Raceway (FIPRW) biomass concentration (DW g/m²) (x) and nitrate content (mg / L) (o) along a 316 days period. ... 31 Figure 23 – Fertilizer Industrial Plant Raceway (FIPRW) biomass concentration (DW g/m²) (x) and nitrate content (mg / L) (o) from September to December. ... 31 Figure 24 - Fertilizer Industrial Plant Raceway (FIPRW) biomass concentration (DW g/m²) (x) and nitrate content (mg / L) (o) from January to April. ... 32 Figure 25 - Fertilizer Industrial Plant Raceway (FIPRW) biomass concentration (DW g/m²) (x) and nitrate content (mg / L) (o) from May to July. ... 33 Figure 26 – Fertilizer Industrial Plant raceway (FIPRW) productivity (o) vs Average Solar radiation (o) from September to July. ... 33 Figure 27 – Ammonia (o) and Nitrate (o) concentration in the beginning and end of FIPRW cycle... 34 Figure 28 – Flocculation evolution since moment 0 (a), after 30 min (b), after 2h (c) and after24h (d). Falcons with microalgae submitted through different concentrations of biopolymer and FeCl3. 500 ppm WRRF biopolymer and 200 ppm of FeCl₃, 250 ppm WRRF biopolymer and 100 ppm of FeCl₃, 100 ppm WRRF biopolymer and 40 ppm of FeCl₃ and 50 ppm WRRF biopolymer and 20 ppm of FeCl₃ (standard concentrations used by WRRF) and monitoring sample. ... 38 Figure 29 – Microalgae culture from A4F raceway before (a) and after (b) the addiction of WRRF biopolymer and FeCl3. 2 L of microalgae culture with standard WRRF concentrations (20 ppm of WRRF biopolymer and 50 ppm of FeCl3) and 500 mL of microalgae culture with ten times standard concentrations. ... 39 Figure 30 – Microalgae after being applied in the separator. (a) Microalgae applied without addiction of flocculant. (b) Microalgae applied with addiction of flocculant. ... 42
xi
L
IST OFT
ABLESTable 1 - Discharge limit values for treated urban wastewater ... 3 Table 2 – Characteristics of open and closed microalgae bioreactors. ... 7 Table 3 - Analyzed parameters on the collected samples from secondary treatment effluent and culture; tertiary treatment effluent and culture and fertilizer industrial plant raceway effluent and culture... 17 Table 4 - Equipment used and respective Manufacturer - Model ... 18 Table 5 - Secondary treatment raceway (STRW) and Tertiary treatment raceway (TTRW) average removal of nitrogen (g / L.day) during evaluation period microalgae cultures. ... 27 Table 6 – Comparison between Secondary treatment and Tertiary treatment raceway microalgae content removal with Wastewater resource recovery facility content removal. ... 28 Table 7 – Secondary treatment raceway (STRW) and Tertiary treatment raceway (TTRW) total suspended solids (g / m²) determined at A4F and external lab. ... 29 Table 8 – Enumeration of Microbiological parameters content comparison between secondary treatment raceway (STRW) beginning of cycle and end of cycle and tertiary treatment raceway (TTRW) beginning of cycle and end of cycle ... 30 Table 9 – A4FRW microalgae under the microscope with the addition of different FeCl3 concentrations: 30 mg/L, 60 mg/L, 90 mg/L, 120 mg/L, 150 mg/L and 180 mg/L ... 36 Table 10 – Fertilizer Industrial Plant raceway microalgae with different cationic flocculant 1 concentrations. FIPRW culture (a), FIPRW culture + 10ppm Cationic flocculant 1 (b), FIPRW culture + 20ppm Cationic flocculant 1 (c), FIPRW culture + 50ppm Cationic flocculant 1 (d) and FIPRW culture + 100ppm Cationic flocculant 1 (e). ... 40 Table 11 - Fertilizer Industrial Plant raceway microalgae with different cationic flocculant 2 concentrations.: FIPRW culture (a), FIPRW culture + 10 ppm Cationic flocculant 2 (b), FIPRW culture + 20 ppm Cationic flocculant 2 (c) and FIPRW culture + 50 ppm Cationic flocculant 2 (d). ... 41
xii
L
IST OFA
BBREVIATIONSA4F – A4F - Algae for Future
BOD₅ - Biochemical Oxygen Demand after 5 days period COD – Chemical Oxygen Demand
CO₂ - Carbon Dioxide FeCl₃ - Iron (III) Chloride
FeCl₃.6H₂O – Iron (III) chloride hexahydrate FIP – Fertilizer Industrial Plant
FIPRW – Fertilizer Industrial Plant Raceway IBC – Intermediate Bulk Containers N - Nitrogen
NH₄ - Ammonia NO₂ - Nitrite NO₃ - Nitrate
STRW – Secondary Treatment Raceway TTRW – Tertiary Treatment Raceway TSS – Total Suspended Solids
WRRF – Wastewater Resource Recovery Facility
1
1 I
NTRODUÇÃO1.1 Framework
A4F - Algae for Future (A4F) is a Portuguese biotechnology company with experience in microalgae research, development and production. It is also specialized in the design, build, operation and transfer of commercial-scale microalgae productions units using different technologies that better adapt to customers business. This company also develops standard operation procedures for optimize microalgae production according to productions goals.
A4F works with different species of microalgae using different growth media such as freshwater, saltwater and hypersaline water. It also uses different bioreactors such as tubular and flat-panel photobioreactores, open pounds, cascade raceways and fermenters. One of the objectives of A4F is to cooperate alongside with other industries that share synergies with the microalgae production and therefore create new opportunities for sustainable processes.
During this internship different assays with microalgae on a Wastewater Resource Recovery Facility (WRRF) and on a Fertilizer Industrial Plant (FIP) were followed in order to evaluate nutrient recovery through microalgae activity and achieve and optimize biomass harvesting.
1.2 Wastewater resource recovery facility
Wastewater Resource Recovery facilities (WRRF) are very important due to their ability to receive wastewater from near cities, treat it and release it back into nature. Released water must obey to certain parameters according to current legislation (Decreto-Lei n.o 152/97 de 19 de Junho, 1997).
Non treated water discharges can lead to eutrophication of water bodies. Eutrophication occurs when nutrient rich effluent is discharge into lakes, rivers or bays, leading to microalgae blooms that fed by nitrogen and phosphorus excess. After microalgae die, microorganisms start to feed on the remains consuming the available oxygen for fish and other aquatic organisms (Michael, Departm, & Aquacultures, 2013).
WRRF include different stages to treat wastewater: a preliminary treatment, a primary treatment, a secondary treatment and a tertiary treatment.
The preliminary treatment aims to remove big dimensions materials frequently found in raw wastewater.
2
The removal of inorganic solids, like sands, is achieved in a sedimentation process and fats removal by flotation process that occur in primary treatment stage.
The secondary treatment comprises the biological treatment. The microorganisms present on wastewater metabolize organic matter in an “aeration tank” where oxygen is supplied, a process known as activated sludge (Sonune & Ghate, 2004).
After the aeration tank, treated water reaches a final settling tank where microorganisms clumped with suspended organic matter, settle to the bottom. They are removed from wastewater and can be recycled back to the beginning of the treatment process.
On the final stage, treated water is submitted through a decontamination process to eliminate remain bacteria and viruses.
It can be performed using different techniques such as chlorination, ozonation and/or UV irradiation, among others (Kadir, 2018).
Figure 1 - Wastewater treatment plant diagram (Nammam Ali Azadi, Reza Ali Falahzadeh, 2015).
Nitrogen may be present in wastewater in dissolved forms such as ammonia-N, nitrite-N and nitrate-N and organic-N. Total Nitrogen is the sum of all forms of nitrogen and Total Kjeldhal Nitrogen is the sum of organic-N and ammonia-N. In order to remove nitrogen content from wastewater, the process of nitrification and denitrification are needed (CHAN, 1971).
Nitrification comprises two steps: the first one consist on the ammonia (NH₃) oxidation by Nitrosomonas that results on nitrogen dioxide - NO₂ (equation 1). On the second step, nitrite is converted in nitrate (NO₃) by Nitrobacteria – Nitrobacter spp (equation 2) (CHAN, 1971).
3
(Equation 2)
On other hand, denitrification is performed by heterotrophic bacteria in an anoxic environment that reduce nitrate and nitrite to gaseous forms of nitrogen (CHAN, 1971).´
1.3 Fertilizer Industrial Plant
Besides domestic wastewater, industrial facilities also generate wastewater that needs to be treated. The industrial wastewater can be treated by biological processes, similar that used on domestic wastewater treatment plants, and also with physical and chemical processes. The treatment choice will depend on the waste discharge period, waste concentration, low biodegradability grade and wastewater toxicity as well as costs associated to the process.
After the treatment water quality parameters must respect the required discharge limit values (Table 1), according to National Official Journal (Lisboa & Do, 2016).
Table 1 - Discharge limit values for treated urban wastewater
Parameters % Reduction Discharge Limit Value (mg / L) Total Nitrogen (N) 70 - 80 90 Phosphorus (P) 80 10 BOD5 (mg O2 / L) 70 - 90 500 COD (mg O2 / L) 75 1000 TSS 90 1000 1.4 Microalgae characteristics
Microalgae are microscopic and photosynthetic organisms found in freshwater and marine habitats. They exist as individual cells or under the form of colonies or chains and can multiply exponentially under favorable environmental conditions. These organisms possess a very efficient carbon- fixing mechanism - the photosynthesis. They also have the ability to uptake compounds from surrounding medium, such as nitrates and phosphorus from, for example, contaminated water bodies. These type of process are called phytoremediation and are defined as an eco-friendly bioremediation process that
4
removes pollutants or nutrients from soil, sediments or water using any plant/algae based system (Marcel Martinez-Porchasa, Luis Rafael Martinez- Cordovab, 2014).
Microalgae also possess the ability to resist to severe temperature, pH and salinity (Uma Devi, Swapna, & Suneetha, 2014)(Matteo Marsullo, Alberto Mian, Adriano Viana Ensinas, Giovanni Manente, 2015).
Produced biomass from microalgae can be used as raw material for different applications, e.g., biofuels production, aquaculture feed, agriculture fertilizer or high value compounds such as pigments, proteins or fatty acids (Mata, Melo, Simões, & Caetano, 2012).
The main species generally found in ponds are Chlorella sp, Scenedesmus and Micratinium able to grow in fertilized environments (Oswald, 2003).
1.5 Nitrate, Phosphorus and Carbon Dioxide
To control eutrophication in waters exposed to treated sewage, nitrogen ,phosphorus and carbon dioxide are the main nutrients that need to be eliminated from treated sewage (Martinez, Jimnez, & Yousfi, 1999).
In a culture medium microalgae can uptake ammonia and nitrate. Nitrogen in form of ammonia is directly used by glutamine synthetase to synthetize glutamate into L – glutamine. Nitrates are reduced by nitrate reductase to form nitrite and reduced by nitrite reductase to obtain the form ammonia to be used in L-glutamine production (fig.2)
5
Besides Nitrogen, Phosphorus has a fundamental role in microalgae metabolism as it is essential for different molecules such as DNA, RNA, ATP, proteins, lipids and cell membrane materials (Singh, Nedbal, & Ebenhöh, 2018). This element often exists in wastewater compounds as inorganic anionic forms, e.g. dihydrogen phosphate (H₂PO₄ˉ)/hydrogen phosphate (HPO₄²ˉ). A depletion of inorganic phosphate can affect photosynthesis process due to their role in microalgae growth and metabolism.
Microalgae perform three different processes to transform phosphorus into high energy organic compounds: phosphorylation, oxidative phosphorylation and photophosphorylation (Martinez et al., 1999).
Another essential component for microalgae growth is carbon dioxide (CO₂). Microalgae require CO₂ to perform photosynthesis and, therefore, they are able to fix CO₂ from three different sources: atmosphere, discharge gases from industry and soluble carbonates (Brennan & Owende, 2010).
This process happens due to conversion of CO₂ and water into metabolites and oxygen under a redox reaction driven by light energy. It is divided into light reactions and dark reactions.
The first stage, or light dependent reactions, are performed in the grana and involves the direct energy of light to create energy carrier molecules that are used in dark reactions.
The second stage, or light independent reaction, occurs in chloroplasts stroma and the accumulated products originated during the first stage are used to form C-C covalent bonds of carbohydrates.
Although there are different paths, Calvin-Benson cycle is the most important in microalgae. The enzyme responsible for CO₂ fixation in this cycle is called ribulose 1,5-biphosphate carboxylase/oxygenase, also known as Rubisco. One molecule of ribulose 1,5-biphosphate and one molecule of CO₂ are converted into two glycerate phosphate. CO₂ diffuses through the cell and is captured by Rubisco. This CO₂ fixation occurs in three distinct phases (fig.3).
First phase is Carboxylation. In this process, CO₂ is added to a five sugar ribulose bisphosphate to form two molecules of phosphoglycerate (Glycerate-P). Rubisco catalyzes this reaction.
Second phase is Reduction. The conversion of Glycerate-P into 3-cabon sugars (Triose-P) happens only in the presence of energy under ATP and NADPH2 form. In a first stage Glycerate-P is phophorylated into diphosphoglycerate (Glycerate–bis-P) and in a second stage, Glycerate-bis-P is reduced to phosphoglyceraldehyde by NADPH2.
Third phase is called Regeneration. Ribulose-P is regenerated for further CO₂ fixation (Sydney, Novak, Carvalho, & Soccol, 2014).
6
Figure 3 - Calvin-Benson cycle (Sydney et al., 2014). 1.6 Open cultivation systems vs closed cultivation systems
In order to obtain microalgae cultures, nutrients, light and CO₂ are needed, being also required a cultivation system, known as bioreactor. Microalgae bioreactors are usually differently designed from bioreactors used to grow heterotrophic microorganisms. The two main parameters to consider for microalgae bioreactors are the efficiency of light utilization and availability of dissolved CO₂ (Sydney et al., 2014).
These bioreactors can be open systems located outdoor. Open systems have as advantages (table 2), low costs at installation, maintenance and operation process. On other hand, the systems are susceptible to different contaminants that compete with the desired culture, rotifers that feed on microalgae, weather conditions that influence culture volume and nutrient concentration and light intensity (Xu & Xiong, 2009).
The alternative to better manage these parameters is the use of closed photo bioreactors. Closed photo bioreactors (table 2) provide better control of culture conditions such as volume and nutrient content. Since productivity is mainly dependent on light availability, closed systems can be implemented outdoor using solar radiation and occupy larger areas or implemented indoors supplemented with artificial light and using reduced space to achieve similar productivities. However, artificial light will increase operation costs. As disadvantages the closed systems are more expensive to install, to operate and to maintain (Xu & Xiong, 2009).
7
Table 2 – Characteristics of open and closed microalgae bioreactors.
Open systems Closed systems
Contamination risk High Low
CO2 losses High Low
Evaporative losses High Low
Area required High High and Low
Process control Difficult Easy
Operation costs Low High
For open cultivation systems we can mention natural or artificial ponds, circular ponds, cascade raceways and raceway ponds. Raceway ponds (fig.4) are oval shaped structure with 15 to 25 cm in depth, possess a paddle wheel for culture homogenization and are easily scaled up. The paddle wheel mixes the liquid medium allowing sun light to reach all microalgae cells. Carbon dioxide sources can be provided artificially to the liquid medium through aerators or from surrounding air (Liang, Y., Kashdan, T., Sterner, C., Dombrowski, L., Petrick, I., Kröger, M., & Höfer, 2015).
8
1.7 Harvesting
In order to achieve a profitable operation it is necessary to find the most efficient and economic harvesting process. As harvesting strategies there are physical, chemical and biological methods. Most of the times, two or more techniques are combined to achieve better and higher quantities of biomass recovery.
The following diagram (fig.5) represents the harvesting process from algal suspension to the biomass recovery.
Figure 5 - Harvesting process diagram (Barros, Gonçalves, Simões, & Pires, 2015).
The process starts with the suspended microalgae in the liquid medium that are collected to be identified (screening step). This step is used to obtain specific size microalgae and to retain undesirable suspended solids. Between retained solids there is also some microalgae with bigger dimensions. This will depend on the size of the porosity of the used mesh.
To obtain a higher microalgae concentration liquid medium is submitted to a thickening process. This will reduce the liquid volume needed for the process and costs associated for downstream steps. Within this step, chemical coagulation/ flocculation process can make operation easier and more efficient. Coagulation involves pH adjustment or electrolyte addition whereas flocculation consists in the addition of cationic polymers. Both techniques will lead to microalgae aggregation, producing more easily settling that leaves a clear supernatant.
Flocculation can be induced in three different ways: (i) through electrostatic covering which occurs when a charged polymer binds to opposite charge particle and reversing that charge create a coat that
9
will connect with opposite charged covers; (ii) polymers or colloids bind to the surface of two different particles forming a bridge between them; (iii) sweep flocculation where particles are entrapped in a massive mineral precipitation (Barros et al., 2015).
Coagulation/ flocculation process can be affected by the properties of cellular surface, pH of growth medium, coagulant/flocculant concentration and biomass concentration (Papazi, Makridis, & Divanach, 2010).
Several salts have been tested as coagulants for microalgae harvesting process. One of those salts is FeCl₃ and when dissociated in the culture medium reduces electrostatic repulsion between negatively charged cell surfaces supporting the formation of cell agglomerates. The used salt will be selected according to the following process step and final application. Ferric salts when applied, leave a yellow-brown coloration in microalgae but do not affect either photosynthetic apparatus or cell viability. Aluminum salts are cheaper and faster coagulants but can affect the cell state leading to cell lysis (Papazi et al., 2010).
Another thickening technique is auto flocculation and bio flocculation. These are low cost, nontoxic and low energy phenomenon. Auto flocculation can occur naturally in microalgae cultures when pH is above 9. This happen due to excessive sunlight exposure with limited CO₂ supply - microalgae growth with CO₂ uptake from the medium, increase pH levels (Barros et al., 2015)(Vandamme, Foubert, & Muylaert, 2013). However, bio flocculation occurs in microalgae that growth in media such as wastewater, with bacteria and fungi with hyphae positively charged that will connect to negatively charged microalgae surface causing flocculation (Zhang & Hu, 2012).
Gravity sedimentation often follows coagulation/ flocculation step that accelerate settling of microalgae. The process is highly energy efficient and can be applied to different microalgae species. However, it is a slow process and biomass can deteriorate during sedimentation (Barros et al., 2015).
Flotation is the opposite process to gravity sedimentation, where microalgae are lift by gas bubbles.
The final thickening technique comprise electrical based methods. These include electrolytic coagulation, electrolytic flotation and electrolytic flocculation. Some of the advantages of these methods are environmental compatibility, versatility, energy efficiency and safety (Uduman, Qi, Danquah, Forde, & Hoadley, 2010).
After the thickening stage the biomass is ready to the dewatering phase. It can be performed by several filtration or centrifugation processes.
10
Filtration process consists in forcing microalgae to flow across a filter medium using a suction pump. With filtration it is possible to harvest low density microalgae.
Filtration can be performed by pressure, vacuum, deep-bed filtration, cross-flow ultrafiltration and magnetic filtration (Show & Lee, 2014).
The fastest harvesting method is centrifugation, however, is the most expensive due to high energy consumption. These characteristics reduce the use of centrifuge to high value products such as highly unsaturated fatty acids or pharmaceuticals and for small scale research operations. Nevertheless, some microalgae cells may be damage when exposed to high gravitational and shear forces (Melinda J. Griffiths, Reay G. Dicks, 2011).
Harvesting by centrifugation can be performed on disc stack and or on decanter centrifuges. Disc stack centrifuges are the most common used industrial centrifuge. The centrifuge consists in a shallow cylindrical bowl with numerous stacks of metal disks which are closely spaced together. The different densities leads to the separation of the material. Microalgae culture enters to the centrifuge through a central stacks of discs. Lighter phase of the culture remains on the inside towards the center while denser phase is displaced outwards to the underside of the discs (Al, Ghaly, & Hammoud, 2015).
Figure 6 - Representation of a disc stack centrifuge (E.S.Tarleton; R.J.Wakeman, 2007).
After centrifugation stage, biomass can be used under the form of paste or it can be dried using different techniques.
11
2 A
IMThe performed work aimed to study the use of microalgae to treat effluents. Routine analysis were performed in order to evaluate microalgae growth and to evaluate nutrients removal. For better effluent composition evaluation, external analysis were also performed.
These internship in business environment intended to contribute for a partnership between A4F and external facilities, such as Wastewater Resource Recovery Facility (WRRF) and Fertilizer Industrial Plant (FIP), aiming to reach a sustainable, less expensive and improved process for effluent treatment and, at the same time, for nutrients recovery.
12
3 M
ATERIALS ANDM
ETHODS3.1 Operational procedures at the Water Resources Recovery Facility (WRRF) for sample collection, replace volume and renewals
A4F installed two pilot scale raceways for wastewater treatment using microalgae cultivation, in a WRRF. The secondary treatment raceway (STRW) is located next a primary treatment tank and works as a secondary treatment and the tertiary treatment raceway TTRW) is located next to a secondary treatment tank and works as a tertiary treatment.
These raceways (RWs) are operating in semi- continuous, with a set point of culture volume of 700 L corresponding to 16.45 cm of culture high and a photosynthetic area of 5 m². The culture is homogenized by a paddle wheel operating at 50Hz. These cultivation systems operate outdoors and therefor are exposed to rain or evaporation that might influence the culture volume. The microalgae developed inside these RWs grew spontaneously.
Sampling campaigns were performed twice a week and according to a previous visit plan.
3.2 Operational procedures at the Chemical Industrial Plant (FIP) for sample collection, replace volume and renewals
Beside the previously referred RWs, A4F installed another RW in a FIP for the bioremediation of an effluent rich in nitrate and ammonium. It has the same characteristics as the ones placed at the WRRF but uses a set point of culture volume of 750 L that corresponds to a culture high of 15.75 cm. The culture in this RW uses tap water and is supplemented with the N-rich effluent and a nutritive medium prepared in the A4F Laboratory to supplement the culture with micronutrients that are limited in the effluent. This culture is also supplemented with injection of carbon dioxide to control the pH of the culture and to work as a source of CO₂ for microalgae growth.
The visits to this RW were previously planned and also performed two times a week. Instead of eviction tank, there are three intermediate bulk containers (IBC). One for evictions, other for tap water and another that contains the effluent rich in nitrogen.
For each visit, it is added effluent and medium to replace the consumed nitrogen from the last two visits. After renewals it is also added effluent and nutritive medium for a final concentration of 1,5 mM in nitrates (set point stablished to avoid nitrate accumulation).
13
3.3 Analytical methods
After the visits, the samples were brought to the A4F Laboratory to do analytical methods such as dry weight, nitrate concentration and microscopic observation. These analysis are performed to evaluate the culture growth, the nitrate consumption and the culture microscopic composition in terms of microalgae and contaminants content.
Some analysis were performed by external laboratories due to their higher precision to identify and measure different compounds.
3.3.1 Biomass Dry Weight
Biomass growth was evaluated by dry weight determination using a fraction from the collected sample (usually 60 mL). Using filtration ramps and 0,7 μm porosity filters, after biomass drying at 180 ºC, biomass dry weight (DW) was estimated by equation (3).
(Equation 3) 𝐷𝑊 (𝑔
𝐿) =
𝐷𝑟𝑦 𝑤𝑒𝑖𝑔ℎ𝑡−𝐼𝑛𝑖𝑡𝑖𝑎𝑙 𝑊𝑒𝑖𝑔ℎ𝑡
𝐹𝑖𝑙𝑡𝑟𝑎𝑡𝑒𝑑 𝑉𝑜𝑙𝑢𝑚𝑒 ∗ 1000
3.3.2 Nitrate Concentration
Nitrate concentrations of the different collected samples were determined from the supernatant of 1 mL of centrifuged sample (10 min at 14500 rpm, MiniSpin Plus, Eppendorf®) by a photo spectrometric method based on (Carvalho, Meireles, & Malcata, 1998).
3.3.3 Ammonia Concentration
To analyze ammonia content it was necessary the definition of new protocol for the use of commercial ammonia kit. This kit consists the addiction of three different reagents by a specific order to the analyzed sample. The reaction will lead to different coloration, according to ammonia concentration in the sample.
The calibration curve was obtained through known concentrations of ammonia and the measurement of the different concentration in a microplate reader at 690 nm.
14
3.3.4 Microscopic Observation
In order to see the composition of the culture, microscopic observations were performed. The culture is evaluated in terms of the microalgae specie, the presence of agglomerates, bacteria content and contaminants.
3.4 Flocculation
To obtain particles with enough diameter to be collected by a separator, Iron Chloride (III) was used. A falcon with 50 mL of culture from raceway at A4F Experimental Unit was prepared with a 20 g/ L FeCl₃.6H₂O concentration.
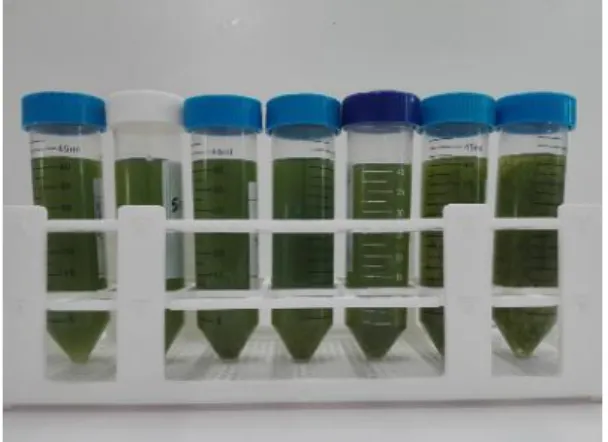
Seven falcons of 50mL were prepared with cultures from a raceway at A4F Experimental Unit. The first falcon was used as a monitoring sample where there was no addiction of flocculant. The following falcons were prepared with 30 mg/L, 60 mg/L, 90 mg/L, 120 mg/L, 150 mg/L and 180 mg/L of FeCl₃ (Fig.7).
All the falcons were incubated in orbital incubators at 80 rpm for 2 min and, in a second step, incubated at 25 rpm for 15 min.
Figure 7 – Falcons with microalgae culture for flocculation process with different FeCl₃ concentrations.
The image above represents falcons with the different concentrations of FeCl₃.
It was performed microscopic observation from the supernatant from each falcon and from the flocculated microalgae at falcon with 180mg/L of FeCl₃.
For a second experiment it was tested a biopolymer given by WRRF with 3 g/ L concentration to use with previous prepared FeCl₃.
Five falcons were prepared. The first falcon was the monitoring sample and the following had a concentration of 50 ppm WRRF biopolymer and 20 ppm of FeCl₃ (standard concentrations used by
15
WRRF), 100 ppm WRRF biopolymer and 40 ppm of FeCl₃, 250 ppm WRRF biopolymer and 100 ppm of FeCl₃ and 500 ppm WRRF biopolymer and 200 ppm of FeCl₃ (Fig.8).
Figure 8 – Falcons with microalgae culture for flocculation test with biopolymer and FeCl3 different concentrations.
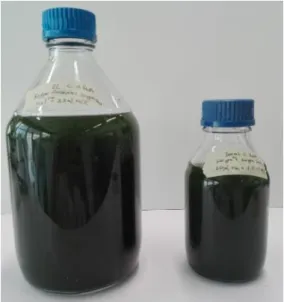
In order to obtain larger quantity of flocculated culture to apply in the separator, 2 L and 500 mL schott were prepared. First schott with 50 ppm WRRF biopolymer and 20 ppm of FeCl₃ and 500 mL schott with 500 ppm WRRF biopolymer and 200 ppm of FeCl₃ (Fig.9).
Figure 9 – Microalgae culture from A4F raceway for biopolymer and FeCl3 flocculation test.
Culture from STRW and FIPRW were sent to external company for flocculation optimization. After external experiments, cationic flocculant 1 and cationic flocculant 2 were suggested. Due to confidentiality agreement the provided flocculants were not identified.
At A4F laboratory, the culture used was from FIPRW due to higher biomass concentration. 5 L sample was collected and divided into two 2 L round balloons, one with cationic flocculant 1 and another with cationic flocculant 2. The flocculants were in liquid form with a concentration of 2 g/ L.
16
Different concentrations were tested:
Cationic Flocculant 1 (2 g/ L) with 2 L of FIPRW culture. - 10 ppm (10 mL of cationic flocculant for 2L FIPRW culture) - 20 ppm (10 mL added to previous concentration)
- 50 ppm (30mL added to previous concentration) Cationic Flocculant 2 (2 g/ L) with 2 L of FIPRW culture: - 10 ppm (10 mL of cationic flocculant for 2L FIPRW culture) - 20 ppm (10 mL added to previous concentration)
- 50 ppm (30mL added to previous concentration)
3.5 Separator operation
Both previous tests had the main goal to agglomerate the biomass in order to be applied in a separator.
The separator contains “screws” with a rotating movement that push the biomass and separated it from the liquid part. At the end the goal is to obtain a dewatered biomass to be used in different applications.
Under the separator there is a tray to collect the water and in the end there is another tray to collect biomass.
17
3.6 Effluent and culture analysis
In order to analyze the effluent and culture composition, it was necessary to send samples to external laboratories.
The following chart represents the different analyzed parameters from the different implemented systems.
Table 3 - Analyzed parameters on the collected samples from secondary treatment effluent and culture; tertiary treatment effluent and culture and fertilizer industrial plant raceway effluent and culture
Secondary treatment Raceway Tertiary Treatment Raceway Fertilizer Industrial Plant Raceway Parameters Effluent Culture Effluent Culture Effluent Culture
Total N Yes Yes Yes Yes No No
Ammoniacal N Yes Yes Yes Yes Yes Yes
Kjeldhal N Yes Yes Yes Yes No No
BOD₅ Yes Yes Yes Yes No No
COD Yes Yes Yes Yes No No
TSS Yes Yes Yes Yes No No
E. coli Yes Yes Yes Yes No No
Thermotolerant coliforms Yes Yes Yes Yes No No
Fecal coliforms Yes Yes Yes Yes No No
Salmonella (Detection) Yes Yes Yes Yes No No
Intestinal parasite Eggs (Detection)
18
The following chart presents the used material and respective manufacturer – model.
Table 4 - Equipment used and respective Manufacturer - Model
Equipment Manufacturer - Model
Optical Microscope Microscope Olympus BX53 Analytical scale (±0,0002g) Ohaus - PA114C
Moisture Analyser (±0,0005g) AND - MS 70 Bottle Centrifuge Hermle - Z 400k
Spectrophotometer UV-Vis (±0,005 AU) Thermo Scientific - Genesys 10S UV-Vis Vacuum Pump Comecta - 5900620
Power drill DEXTER IV 650W
Submersible pump -
Magnetic stirrer VWR Advanced – VMS – C7 Ammonia kit Sera – Ammonia/ammoniac test Microplate reader SPECTROstar Nano – BMG Labtech Vortex Scientific industries Vortex Genie 2 Glass Microfiber Discs AHLSTROM MUNKSJÖ 0,7μm
19
4 R
ESULTS ANDD
ISCUSSIONThe raceways installed at WRRF and FIP are outdoor systems and, therefore, are exposed to different weather conditions such as rain, wind and solar radiation. Although the set point volume is 700 L, the maximum capacity for both RWs is 900 L with the paddlewheel spinning. Beside this factors, logistic factors were also present such as electricity failures, changes in the effluent composition from primary and secondary treatment and availability from both facilities to correspond with the required needs. All these factors can affect the culture conditions such as volume, pH and microorganisms, culture composition and previously planned operations.
4.1 WRRF culture analysis
For STRW the culture were followed since assay day 82 to day 393. The graphic bellow presents as black line, biomass concentration (g/ m²) during the time and as green line nitrate concentration adjusted to set point volume (mg/ L). For better understanding of the results, the main graphic is divided in three stages: September to December, January to April and May to July.
Figure 11 - Secondary treatment raceway (STRW) biomass concentration (DW g/m²) (x) and nitrate content (mg / L) (o) along a 311 days period.
Each drop present in the graphic represent a renewal. The purpose of the renewals were to discard produced biomass and replace it for fresh nutrients provided by the primary treatment sedimentation tank. 80% renewals were to remove the majority of biomass and start a new cycle. However, 40% renewals were only to remove part of biomass and the main concern was to add nutrients to the culture. This procedure was also performed to prepare the culture for sample collection for external analysis.
Another occasional procedures performed was the removal of volume due to rainfall. In these cases it was necessary to remove volume and add nutrients to the culture.
20
This period started at day 82 (10th September of 2018) and finished at day 190 (27th December
of 2018), day of the first collect sample and day of the last sample before January.
During this period, it started with a renewal on day 85 which is represented by the first drop in (fig.12). After this renewal it’s presented a microalgae growth cycle where it is possible to identify the exponential growth phase and stabilization phase. Exponential phase occurred since day 85 with an initial biomass concentration of 42.0 g /m² and reaching biomass concentration of 159.24 g /m² at day 120.
During this cycle, it is important to refer that at day 89, 96, 103 and 110 was added volume to reset the set point volume of the raceway. When added volume the culture suffers an addition of total suspended solids corresponding to the effluent composition, changing biomass concentration. These concentration are theoretical and were obtained through the sum of measured concentration with the total suspended solids concentration measured by WRRF times the added volume and dividing by the photosynthetic area.
When refer to nitrate concentration, in the beginning of the cycle the biomass increase lead to a nitrate consumption in the culture. After the added nutrients it is possible to identify a nitrate accumulation in a first stage and then, with microalgae growth, nitrate concentration decreased. When the culture start stabilize, a renewal was performed.
The second cycle started with 40.46 g/ m² biomass concentration at day 120 and finished with 76.50 g/ m² on day 152. The maximum concentration reached in this cycle was 83.28 g/ m² on day 145. For this cycle it was necessary to remove culture volume on days 141, 145 and 148 due to rainfall. When removed volume, effluent with nutrients was added to the cultures.
Nitrate concentration decreased in the beginning of the cycle possibly due to microalgae uptake resulting in microalgae growth.
Another cycle started at day 152 with 27.3 g/ m² and finished on day 180 with a biomass concentration of 46.9 g/ m². As previous cycle, the maximum biomass concentration reached was higher than the end of cycle. In this case, the maximum concentration was 66.61 g/ m² on day 162. Although nitrate accumulation in the beginning of the cycle, with biomass increase nitrate concentration was reduced. In this cycle was necessary to remove volume due to rainfall and add effluent with nutrients to the culture. This operations were performed at day 159, 166, 169, 173 and 176.
The cycles from day 180 to 183 and 183 to 190 had a short duration due to low nitrate concentration in the culture. Biomass was removed and nutrients were added after 3 and 7 days cycle, respectively.
21
For the respective cycles mentioned, the culture reached a maximum biomass productivity of 8.36 x 10ˉ² g/ (L.day) and a nitrate consumption of 1.7 x 10ˉ³ g/ (L.day) or the first cycle; second cycle reached a maximum biomass productivity of 5.18 x 10ˉ² g/ (L.day) however, no nitrates were consumed; in the third cycle culture started to receive less solar radiation due to winter season and, therefore, the biomass productivity were lower than the previous cycles, 2.55x10ˉ² g/ (L.day) and also with a nitrate accumulation; the cycles from day 180 to 183 and 183 to 190 presented productivities of 3.69 x 10ˉ² g/ (L.day) and 0.56 x 10ˉ² g/ (L.day) respectively. Both of the cycles registered nitrate accumulation.
Figure 12 – Secondary treatment raceway (STRW) biomass concentration (DW g/m²) (x) and nitrate content (mg / L) (o) from September to December.
The next period (fig.13) started in January, day 190 of the assay and finished in April, day 308 of the assay. In the beginning of this period it was made 7 day cycles to better understand the behavior of the culture and calculate the necessary flowrate to operate the culture in continuous mode.
During January, four cycles were performed where the highest productivity achieved were 1.7 x 10ˉ² g/ (L.day) and the higher nitrate consumption was 0.62 x 10ˉ³ g/ (L.day).
On day 218 started another cycle that only finished on day 236. Although the cycle started with a nitrate concentration of 5.58 mg/ L and finished with 19.84 mg/ L, there was a period where nitrate consumption reached 1.44 x 10ˉ³ g/ (L.day) and the highest productivity was 2.45 x 10ˉ² g/ (L.day). The following cycle occurred from day 236 to day 260 and highest productivity was 6.90 x 10ˉ² g/ (L.day) and nitrate consumption of 2.57 x 10ˉ³ g/ (L.day). In terms of biomass concentration, this cycle reached 83.3 g/ m².
After this cycle, a better understanding of the culture behavior lead to a procedure where a 14 days cycles were performed. This procedure also contribute to reducing the logistic costs.
Another parameter that influenced the increasing productivity during the period between January and April was the increase of solar radiation.
22
Figure 13 – Secondary treatment raceway (STRW) biomass concentration (DW g/m²) (x) and nitrate content (mg / L) (o) from January to April.
The final period happened between May and July (fig.14) and with higher solar radiation due to summer season, the culture was able to achieve higher biomass concentrations and better productivities. The highest biomass concentration was 144.01 g/ m² (1.532 g /L) on day 352; for nitrate consumption the best value was 2.79 x 10ˉ³ g/ (L.day) from day 331 to 337 and the higher productivity was 11.69 x 10ˉ² g/ (L.day) from day 379 to 386.
During this period, external analysis were performed for a sample collected from the effluent on day 260 (beginning of a cycle) and, on day 274 representing the end of the cycle, a sample from the culture. Both samples were sent to external laboratories to execute microbiological analysis.
Figure 14 – Secondary treatment raceway (STRW) biomass concentration (DW g/m²) (x) and nitrate content (mg / L) (o) from May to July.
On day 337, ended a seven days cycle to repositioning the RW to become perpendicular to sun path in order to avoiding wall shading during winter season. With this repositioning it is expected to increase solar radiation for the culture.
Also in this cycle, it was necessary to send samples for external laboratories analysis. Therefore, on day 352 occurred sample collection from the effluent and after 7 days (day 359), another sample was collected from the culture. The external analysis allowed to compare the composition in the beginning of the cycle with the end of a cycle in terms of chemical composition.
23
Since the culture was depending on the composition of the effluent and it is not possible to control their composition, the cycle from day 359 to 366 was discarded due to excess of sludge in effluent composition. Dry weight from this cycle was measured after sludge sedimentation to obtain a better representative biomass concentration value. Without sedimentation, biomass concentration in the beginning of the cycle was at 1.075 g/ L and after sludge sedimentation the concentration was 0.183 g/ L.
At day 366 the culture was renew with a “normal” effluent composition.
For ammonia content, only three samples were collected for this analysis. The ammonia consumption for the only evaluated cycle was 0.62 x 10ˉ³ g / (L.day). After the renewal, ammonia concentration was 55.3 mg/ L.
However, it is showed that microalgae prefer ammonia rather than nitrate, since use less energy to obtain aminoacids (Chen, Pan, Hong, & Lee, 2012).
To reach higher productivities it is important to have high solar radiation. As the following graphic shows (fig.15), average solar radiation (red dots) presented a decrease from September to December and start to increase since January. In terms of productivity (blue dots), the values were higher during the periods with higher solar radiation.
24
Similar behavior was register in TTRW where the visits were performed in the same days as STRW. Fig. 16 shows a graphic representation of biomass and nitrate concentration for the same period of 311 days of sample collection.
Figure 16 – Tertiary treatment raceway (TTRW) biomass concentration (DW g/m²) (x) and nitrate content (mg / L) (o) along a 311 days period.
In order to better understand the behavior of biomass and nitrate concentration during the time, the main graphic, once again, was divided in three different periods: September to December, January to April and May to July.
During the first cycles the procedure was based in the addition nutrients to the culture and renew it when the biomass concentration start to stabilize. During the period from September to December, the highest productivity was 9.4 x 10ˉ² g/ (L.day) from day 89 to 92; in terms of biomass concentration on day 138 achieved 97.8g/ m² with 870 L and 0.562 g/ L; for nitrate consumption the best performance occurred from day 99 to 103 with 4.96 x 10ˉ³ g/ (L.day).
Figure 17 - Tertiary treatment raceway (TTRW) biomass concentration (DW g/m²) (x) and nitrate content (mg / L) (o) from September to December.
25
Due to low nitrate concentration in the effluent and, therefore, low concertation available in the culture, 7 days cycle started to be performed. With this procedure the culture start to have nitrate available for microalgae growth and the graphic (fig.18) become simpler to understand and to evaluate. Biomass growth allied to nitrate consumption was verified in the culture. However, some cycles presented increase in nitrate concentration yet biomass still grew.
On day 288, biomass concentration reached 67.99 g/ m². The maximum nitrate consumption was 1.55 x 10ˉ³ g/ (L.day) from day 302 to 308 and the highest productivity occur on from day 281 to 288 with 6.79 x 10ˉ² g/ (L.day).
Figure 18 -Tertiary treatment raceway (TTRW) biomass concentration (DW g/m²) (x) and nitrate content (mg / L) (o) from January to April.
Average solar radiation start to increase for summer season, however, excess of solar radiation lead to culture stress and might inflicted photo inhibition. The green culture started to turn yellowish and formed agglomerates. pH also increased to 10 possibly leading to biomass auto flocculation (Barros et al., 2015)(Vandamme et al., 2013).
Beside 7 days cycle, during this period it was necessary to do another visit to add nutrients to the culture to prevent total nutrient depletion.
Since the cycle ended after 7 days period, it was not possible to see the maximum biomass concentration achievable for this culture.
In terms of ammonia content, it was measured at the beginning of the final cycle, after nutrient addiction and at the end of the same cycle. The cycle started with 8.61 mg/ L of NH₄ and after 4 days, the concentration decreased to 0.07 mg/ L NH₄, representing 2.13 x 10ˉ³ g/ (L.day) of ammonia consumption. After nutrient addiction in the middle of the cycle, ammonia was reestablish to 5.22 mg/L and reach the end of the cycle with 0.49 mg/ L. The culture during the entire cycle consumed an average of 1.89 x 10ˉ³ g/ (L.day) of ammonia.
26
Figure 19 -Tertiary treatment raceway (TTRW) biomass concentration (DW g/m²) (x) and nitrate content (mg / L) (o) from May to July.
For TTRW productivity values were constant even with the increase of average solar radiation. Since the systems worked in semi continuous mode being dependent on effluent composition, most of the cycles presented low nitrate concentrations at the beginning of the cycle, and therefore, even with the increase of solar radiation, productivities kept constant due to nutrient limitation.
Figure 20 -Secondary treatment raceway (STRW) productivity (o)vs Average Solar radiation (o) from September to July.
Average nitrogen consumption was calculated from three different periods based on biomass production from each cycle, times the estimated nitrogen percentage in microalgae composition (Peccia, Haznedaroglu, Gutierrez, & Zimmerman, 2013). STRW presented similar nitrogen consumption from September to December and January to April, however, during the months with higher radiation and biomass growth, the nitrogen consumption increased to 0.68 g / L.day.
27
Table 5 - Secondary treatment raceway (STRW) and Tertiary treatment raceway (TTRW) average removal of nitrogen (g / L.day) during evaluation period microalgae cultures.
STRW N removal (g / (L.day)) TTRW N removal (g / (L.day)) Sep - Dec 0.22 0.16 Jan - Apr 0.32 0.48 May - Jul 0.68 0.50
4.2 External Laboratory Results
Several samples were collected in order to send to external laboratories to performed more specific analysis. The main objective was to compare a sample from the effluent, representing the beginning of a cycle, and a sample from the culture before a renewal, representing the end of that cycle. Samples were stored in refrigerated conditions and the container was previously washed for a more representative sample (‘Water and Wastewater Sample’, 2011)(WHO - World Health Organization, 1997) In terms of elemental analysis (Total N, Ammoniacal N, Kjeldahl N, BOD₅, COD) , STRW effluent and culture, together with TTRW effluent and culture were evaluated. As the following figure (fig.21) shows, there is a decrease from STRW effluent (light blue column) to TTRW effluent (orange column) achieving the imposed limit discharge values (yellow column) as expected.
For ammonia, Kjeldahl nitrogen and total nitrogen content, microalgae culture performing as secondary treatment started with 68 mg / L, 66 mg/ L and 65 mg/ L respectively. After microalgae activity, it decreased to 3.36 mg / L, 40.29 mg/ L and 17 mg/ L, representing a 95%, 39% and 73 % removal (table 6). Only ammonia was under the 10 mg/ L discharge limit value. However, total nitrogen appears in lower concentration compared with Kjeldhal nitrogen. This result is not reliable or conclusive since total nitrogen is the sum of nitrite, nitrate and Kjeldahl nitrogen. The error might be associated to the different methods to analyze the different compounds.
Total phosphorus was 23 mg/ L at the beginning of the cycle and the obtained measure after microalgae activity was 31.56 mg/ L.
When compared the same parameters from the TTRW effluent with TTRW after microalgae activity, for ammonia content there was a 48% reduction and only 3% reduction for total nitrogen. Kjeldahl nitrogen accumulated after microalgae activity.
28
BOD₅ and COD were both over discharge limit values after microalgae treatment, however, the analyzed sample contained biomass. Microalgae fix CO₂ from the culture and produce O₂ for bacteria growth. Once the depletion on CO₂, microalgae stop producing O₂ and bacteria uptake the remained dissolved oxygen increasing levels of BOD₅ and COD. For further analysis, biomass should be discarded from end of cycle samples.
COD values are above chart limit for STRW effluent (420 mg/ L O₂), STRW culture (1208.6 mg/ L O₂) and TTRW culture (436.4 mg/ L O₂).
The discharge limit values were present in files provided from the external laboratory.
Figure 21 – Ammoniacal nitrogen (NH4 – N), Kjeldhal nitrogen (Kjeldhal – N), Total nitrogen (Total – N), Biochemical oxygen demand (BOD5), Chemical oxygen demand (COD) and Total phosphorus (Total – P) from Secondary treatment raceway effluent (o) and culture (o) ;Tertiary treatment raceway effluent (o) and culture (o);Discharge Limit Values (o).
Table 6 – Comparison between Secondary treatment and Tertiary treatment raceway microalgae content removal with Wastewater resource recovery facility content removal.
STRW microalgae content removal (%) TTRW microalgae content removal (%) WRRF content removal (%) NH₄- N 95 48 91 Kjeldahl - N 39 Accumulated 90 Total - N 73 3 69 BOD₅ 45 Accumulated 96
COD Accumulated Accumulated 95
29
Total suspended solids were measured at A4F laboratory and also measured by external laboratory. The microalgae biomass concentration was similar in both analysis. The difference might be associated to the used determination method. While A4F used 0.7μm filter and dries biomass at 180ºC, external laboratory method uses 0.45 filter and dries biomass at 105ºC. Only STRW effluent presented a major difference when compared with remaining results.
Table 7 – Secondary treatment raceway (STRW) and Tertiary treatment raceway (TTRW) total suspended solids (g / m²) determined at A4F and external lab.
STRW effluent STRW culture TTRW effluent TTRW culture
A4F measurement 19.6 115.2 1.8 37.7
External Lab
measurement 103.6 103.4 0.32 39.5
Microbiological analysis were performed by an external laboratory for enumeration of Escherichia coli, fecal coliforms, thermotolerant coliforms, detection of Salmonella and intestinal parasite eggs.
After samples collection, they were preserved in a refrigerated container at 4º C (‘Water and Wastewater Sample’, 2011)(Unknown, n.d.).
As table 3 shows, comparing the sample collected from secondary treatment the beginning of the cycle with the sample collected at the end of the cycle, the enumeration of E.coli was above detection limit and decrease to zero. Also fecal coliforms had the same behavior. For enumeration of thermotolerant coliforms, initial concentration was above detection limit and at the end of the cycle suffered a decrease, but this time under the detection limit. The results for intestinal parasite eggs were zero for beginning and end of cycle as well as undetected for detection of Salmonella.
When it comes to tertiary treatment, beginning and end of cycle presented values above detection limit for enumeration of E.coli and fecal coliforms not being possible to affirm if there was progress ,or not, after the treatment. Once again, thermotolerant coliforms decrease from the beginning of cycle to the end of cycle, passing from above detection limit to under detection limit. Similar to secondary treatment, tertiary treatment presented undetected for detection of salmonella and zero for intestinal parasite eggs.
30
Table 8 – Enumeration of Microbiological parameters content comparison between secondary treatment raceway (STRW) beginning of cycle and end of cycle and tertiary treatment raceway (TTRW) beginning of cycle and end of cycle
Secondary treatment Tertiary treatment Units
Beginning of
cycle End of cycle
Beginning of
cycle End of cycle
Escherichia coli >100 0 >100 >100 ufc/100ml Fecal coliforms >100 0 >100 >100 ufc/100ml Thermotolerants coliforms >1,5x10⁴ <1,0x10⁰ >1,5x10⁴ <1,0x10⁰ ufc/mL
Detection of Salmonella Undetected Undetected Undetected Undetected 25mL Intestinal Parasites Eggs 0 0 0 0 N/l
4.3 FIP culture analysis
FIPRW culture started to be followed on day 167 (10th September 2018), day of the first collected
sample, for a 316 day (fig. 22). For this raceway, effluent rich in nitrogen originated from FIP was inoculated with the purpose to achieve microalgae growth. The composition of the effluent turned to be toxic for microalgae development. For a second attempt, the effluent was diluted with tap water and supplemented with bottled CO₂. After approximately seven day period microalgae started to grow.
Raceway dimensions are the same as WRRF raceways, 5 m² of photosynthetic area and one paddlewheel with the same rotor frequency for culture homogenization. The differences are the set point volume of 750 L, presence of pH probe, temperature reader and artificial CO₂ injection.
CO₂ injection is controlled by an eletrovalve that injects CO₂ into the culture when culture pH reaches the pH set point. Since the effluent does not possess dissolved CO₂ and atmospheric CO₂ is insufficient, it was necessary to set a frequent achievable pH set point of 7.50 - 8.
Once again, for better understanding of the graphic, it was divided in three periods: September to December, January to April and May to July. Each drop in the graphic represents a culture renewal.
31
Figure 22 – Fertilizer Industrial Plant Raceway (FIPRW) biomass concentration (DW g/m²) (x) and nitrate content (mg / L) (o) along a 316 days period.
Stablished procedure, for the beginning was to replace evaporated water to 750 L set point and add effluent for a final concentration of 248 mg/ L in nitrate and A4F complementary medium. Renewal were also performed when culture start to reach stationary phase.
For the first period (Sep-Dec) (fig. 23), the addiction of effluent lead to a nitrate accumulation reaching a nitrate concentration of 1201 mg/ L on day 181.
In terms of biomass concentration, the maximum achieved was on day 191 with 102.7 g/ m². To reach this concentration, the calculated productivity was 19.33 x 10ˉ² g/ L.day for a three day period. The maximum nitrate consumption was 57.8 x 10ˉ³ g/ (L.day) from day 184 to day 188.
Figure 23 – Fertilizer Industrial Plant Raceway (FIPRW) biomass concentration (DW g/m²) (x) and nitrate content (mg / L) (o) from September to December.
With the purpose to avoid stationary phase and take advantage of the increasing solar radiation, 14 day cycles start to be performed. Another procedure taken, was the reduction of added effluent to prevent nitrate accumulation. Therefore, the nitrate set point on the culture passed from 248 mg/ L to 93 mg/ L since culture only consumed approximately 62 mg/ L per week.
The composition of the initial effluent was approximately 40 g/ L of nitrate and on day 212 it was replaced. The new measured concentration was 125 g/ L.
32
The addiction of effluent to the culture was only made in renewal days, however, each visit it was added effluent and complementary medium to replaced consumed nitrogen from previous two visits. Since the percentage of nitrogen in produced biomass is around 11%, it was calculated using biomass produced dividing by nitrogen molecular weight. The obtained concentration was once again divided by nitrogen concentration in the effluent and multiplied to obtain mL units.
With lower addictions of nitrate into the culture and the addiction of CO₂ the culture start present more steady cycles.
During this period, the maximum biomass concentration was achieved on day 398 with 121.2 g/ m² corresponding to 1.01 g/ L with 600 L culture volume.
Maximum productivity occurred from day 391 to 391 with 13.86 x 10ˉ² g/ (L.day), while highest nitrate consumption was 45.1 x 10ˉ³ g/ (L.day) from day 199 to 202.
Figure 24 -Fertilizer Industrial Plant Raceway (FIPRW) biomass concentration (DW g/m²) (x) and nitrate content (mg / L) (o) from January to April.
The procedure was maintained from May to July (fig.25), however, on day 433 and 442 the renewals were made in terms of biomass concentration and not on culture volume. These renewals were made to prepare the culture for biomass harvesting. Renewal on day 433 aimed to lower the biomass concentration and coupled with renewal on day 442, the culture would present a microalgae in better conditions for external biomass analysis from planed harvesting on day 447. Due to logistic issues harvesting did not occurred on this day, in contrast with day 426 where 1.3 kg of biomass was harvested from 180 L of culture, 250 g for external analysis and 1.1 kg stored.
The renewal on day 468 was also to prepared culture for biomass harvesting but, due to logistic issues did not occurred.