182
Residual Effect Of Organic Fertilizer And Addition
Inorganik Fertilizer To Nutrient Uptake, Growth
And Productions Of Black Soy Bean ( Glycine Max
L. Merr) At Rainfed Areas.
Elli Afrida, Abdul Rauf, Hamidah Hanum, Didik HarnowoAbstract: Research that have theme Residual Effect of Organic Fertilizer and Addition Anorganik Fertilizer to Nutrient Uptake, Growth and pruductions of Black Soy Bean (Glycine max L. Merr) at Rainfed Wetland. Research was conducted at Suka Makmur village sub-distric Binjai, Distric Langkat. Research was arranged in split plot design, main plot is applications of phonska fertilizerwith 4 level i.e: 0 t ha-1 (A0), 0.20 t ha
-1
(A1), 0.25 t ha -1
(A2) dan 0.30 t ha-1 (A3) and sub plot is residual effect from first research with 16 combinations. Research was replicated 3 times. Result of research was showed application organic fertilizer that was combinated with anorganic fertilizer can increased N and K uptake. Application organic and anorganic fertilizer as single factor showed significantly effect of number of pods and soy bean productions but at interaction treatment not significantly effect however generally occurs increased production at O3,3A3 tratment until 80% comparison with control.
Keywords: organik fertilizer, inorganic fertilizer, residual effect, black soybean.
————————————————————
1.
Introductions
North Sumatra has a land area larger rainfed than irrigated rice. According to BPS data (2012), that the area of 135 872 ha of irrigated land and rainfed rice area 149 547 ha. So rainfed a physical resource potential for agricultural development. Generally rainfed areas planted with rice once a year and then left fallow. Thus, in conditions of the fallow rainfed forward into the development of alternative crops other than a group of crops including black soy because demand for food is increasing due to the growing number of people. Given the major constraint in the rainfed areas is the availability of water is highly dependent on rainfall, so that the land affected by drought in the dry season, it requires the right technology to cultivate rainfed areas. The use of technology in rainfed areas related to the major issues in the field such as the availability of water and land degradation due to the use of technology. Availability of water besides depending on the rainfall also depends on the ability of land to hold water for a longer period of time. The addition of organic matter is expected to improve the ability of the soil store water.
The use of technology is not appropriate for the purpose of clearance can maximum production in rainfed areas such as excessive fertilization resulted in land degradation such as loss of organic matter and nutrient deficiency. Yellow soybean seed varieties with larger grain size suitable for raw materials tempeh whereas black seeds of soybean varieties with higher protein content (37-42% dw), like Merapi, Cikuray, and Mallika according to the raw material of soy sauce, but the relatively small size of the seeds. Soy sauce prepared from varieties / strains of black soybean seed large, including Detam-1 and Detam-2 showed a slightly higher protein content than yellow soybeans, while the weight and volume of soy sauce and sensory properties are relatively the same. The two new varieties are also superior in terms of yield potential of around 3 to 3.50 t / ha (Ginting et al, 2009). With high production reasons, the use of black soybean varieties is one of the strategies to increase soybean productivity on a national scale. While the use of rainfed areas and the use of high yielding varieties to increase productivity, the use of technologies such as fertilization cultivation is that which can not be released to increase productivity. The addition of organic matter combined with inorganic fertilizer impartial deemed appropriate to address the problems in paddy fields rain. In relation to the requirement of N, P and K for soybean crop, generally nutrient N can be absorbed by plants in the form of ammonium (NH4
+
). The results of the study of Liang (1987) in Sugianta (2007) showed that ammonium in paddy fields 25-29% is absorbed by the rice plant, 17-25% embedded ground and 50-54% lost because of washed, evavorated and have denitrifikation. Nutrients P, in general during this time filled with TSP with P content of about 45% P2O5 and recently replaced with the SP-36 with a P2O5 content of 36%. mplementation of the intensification of agriculture over the years has led to the accumulation of most of the elements of P in paddy fields. Results from Syan and Herman (1995) showed that 1.7 ha of rice fields in Indonesia status accumulation of P2O5 is moderately (20-40 mg P2O5 / 100 g soil), 1.5 million ha is high (>49 mg P2O5 / 100 g soil) and only 0.54 million ha that the accumulation rate is low (<20 mg P2O5 / 100 g soil). With _________________________
Elli Afrida worked as a lecturer at the Faculty of
Agriculture University Al Wasliyah, Medan,
Indonesia.
Abdur Rauf and Hamidah Hanum worked as a
lecturer at the Faculty of Agriculture University of Sumatera Utara, Medan 20155. Indonesia.
Didik Harnowo worked in Balai Penelitian Tanaman
Pangan, Malang. Indonesia
Coresponding author: Elli Aprida, Faculty of
Agriculture University Al Wasliya, Medan,
183 such a condition of the land, then the land improvement is
absolutely necessary to support sustainable agriculture. Organic fertilizers are not a substitute for inorganic fertilizer but as complementary. Organic fertilizers can supply the majority of plant nutrients. Thus organic fertilizers should be used in an integrated manner with inorganic fertilizers to improve soil and crop productivity in a sustainable and environmentally friendly. Therefore, the use of artificial chemical fertilizers are not matched by the provision of organic fertilizer can damage soil structure and reduce soil biological activity. The growth of soybean plants is influenced in part by a combination of good application of fertilizer derived from organic fertilizers and inorganic fertilizers. Combination treatment optimal fertilizer application in accordance with the growth black soybean will provide improved results on growth and yield parameters of soybean were cultivated. Therefore, the study of organic residues with the addition of inorganic fertilizers is considered appropriate to increase the productivity of black soybean plants in the rainfed areas.
2.
Materials and Methods
The materials used in this recearch are the seeds of black soybean verietas Detam-1, herbicides, insecticides, fungicides and chemicals used for laboratory analysis in this recearch. Planting site was previously mined land applied manufacturing organic matter and natural compost. The tools used in this study were analytical balance, oven, meter, hoes, drill ground, sfektrofotometer, and other tools that support this research. Research was conducted with Split Plot Design with the main plot are: Phonska fertilizer application with 4 levels each 0t ha-1 (A0), 0.2 t ha-1 (A1), 0.25 t ha-1 (A2) and 0.3 t ha-1 (A3). While the subplot is the residual effect of application of organic materials research as much as 16 combinations are: O0,0: residual from treatment 0 t ha-1 compost+0 t ha-1 petroganik; O0,1: residual from treatment 0 t ha-1 compost+0.5 t ha-1 petroganik; O0,2:
residual from treatment 0 t ha-1 compost+1.0 t ha-1 petroganik; O0,3: residual from treatment 0 t ha-1 compost+1.5 t ha-1 petroganik; O1,0: residual from treatment 2 t ha-1 compost+0 t ha-1 petroganik; O1,1: residual from treatment 2 t ha-1 compost +0.5 t ha-1 petroganik; O1,2: residual from treatment 2 t ha-1 compost +1.0 t ha-1 petroganik; O1,3: residual from treatment 2 t ha-1 compost +1.5 t ha-1 petroganik; O2,0 residual from treatment 4 t ha-1 compost +0 t ha-1 petroganik; O2,1: 4 t ha-1 compost +0.5t ha-1 petroganik; O2,2: 4 t ha-1 compost +1.0 t ha-1 petroganik; O2,3: 4 t ha-1 compost +1.5 t ha-1 petroganik; O3,0: 6 t ha-1 compost +0 t ha-1 petroganik; O3,1: 6 t ha
-1
compost +0.5 t ha-1 petroganik; O3,2: residual from treatment 6 t ha-1 compost +1.0 t ha-1 petroganik; O3,3: residual from treatment 6 t ha-1 compost +1.5 t ha-1 petroganik; thus obtained 64 treatment combinations. The study was replicated 3 times. If treatment have significant effect, the analysis continued with Duncan’s multiple range test (DMRT)at α=5%. Parameters observed are nutrient Uptake of N, P and K, plant height, stem diameter, number of branches, number of pods per plants, seed production per plants and production per plot (2x3m). Nutrient uptake were analyzed with composite, leaf samples were observed trifoliate leaf unfolded emerging from the primary branch on the fourth book which is calculated from the shoots. Plant samples were dried in an oven at a temperature of 600C diving 3 days or weight has been constant. Samples were dried crushed with grinders. N content was determined by the method Kjedhal (by tool of titration) and P by dry ashing method (defined by sfektrofotometer). For K uptake is determined by the method of HClO4 + HNO3 by means of atomic absorbtion spectrometer. Uptake of each element is the percent of each of the dry weight of each biomass or average of the uptake of each piece of biomass to the total uptake. Observations was doing at the age 50 days after planting.
Results and Discussion
Leaf N Content (%)
Observational data of N uptake on the treatment of organic and inorganic fertilizers can be seen in Table 1.
Table1. Data observations N uptake in the treatment of organic fertilizer residues and inorganic fertilizer
Organic Fertilizer
Anorganic Fertilizer
average
A0 A1 A2 A3
………..kg ha-1...
O0,0 105.89 152.69 115.77 98.50 118.21c
O0,1 105.32 130.16 232.83 124.53 148.21bc
O0,2 121.74 138.98 172.31 122.64 138.92bc
O0,3 121.99 115.26 138.21 194.83 142.57bc
O1,0 138.59 121.24 209.92 215.94 171.42a
O1,1 109.72 145.51 153.78 138.67 136.92bc
O1,2 117.26 167.09 183.46 184.69 163.13b
O1,3 124.34 137.95 205.69 156.12 156.03b
184
O2,1 152.57 133.41 173.29 196.26 163.88b
O2,2 170.04 159.60 156.67 180.78 166.77ab
O2,3 198.13 150.71 168.33 202.35 179.88a
O3,0 97.76 148.32 199.56 185.58 157.80b
O3,1 144.06 169.89 155.99 229.18 174.78a
O3,2 180.70 167.14 221.58 217.16 196.64a
O3,3 148.82 237.43 208.24 229.84 206.08a
Average 136.76 148.34 179.51 175.60 160.05
Note: The numbers are followed by the same letter in the same row are not significantly different according to Duncans multiple
range test / DMRT at α=5%.
Highest N uptake organic fertilizer residues and inorganic fertilizer treatment contained in the averaging 206.08 kg ha -1
at O3,3 treatment and was lowest for treatment impositions O0,0 (118.21 kg ha
-1
). These results indicate that treatment of inorganic fertilizers has not shown influence on nutrient availability to plants whereas N organic fertilizer can increase the uptake of N for plants.
Leaf P Content (%)
Analysis of variance parameter P uptake showed that the residual organic fertilizer and organic fertilizer as a single
factor and organic fertilizer treatment interactions with inorganic fertilizers not significanly effect. Highest P uptake in the treatment O2,2A3 with the average 9.21 kg ha-1 and lowest for the treatment O0,2A3 with the average 6.27 kg ha
-1
. In line with the N uptake, organic fertilizer residues showed that P uptake highest at treatment O3,3 and lower at treatment O0,0.Observational data from P uptake on the treatment of organic fertilizer residues and inorganic fertilizers can be seen in Table 2.
Table 2. P uptake in the treatment of organic fertilizers residues and inorganic fertilizers.
Organic Fertilizer
Inorganik Fertilizer Average
A0 A1 A2 A3
………kg ha-1...
O0,0 7.03 6.18 6.85 5.00 6.27
O0,1 5.20 7.96 8.98 8.04 7.54
O0,2 5.42 6.88 7.83 6.50 6.66
O0,3 6.13 8.29 7.75 9.86 8.01
O1,0 6.28 8.52 9.45 8.49 8.18
O1,1 5.72 6.68 9.33 5.87 6.90
O1,2 4.94 8.01 8.67 6.76 7.09
O1,3 6.60 8.03 8.26 8.26 7.79
O2,0 7.00 5.31 7.64 7.55 6.88
O2,1 8.21 7.43 9.10 7.34 8.02
O2,2 7.93 8.90 8.62 8.84 8.57
O2,3 8.51 8.63 8.39 8.03 8.39
O3,0 4.75 8.37 8.04 10.00 7.79
O3,1 7.09 7.80 4.91 10.72 7.63
O3,2 7.98 8.28 9.22 7.81 8.32
O3,3 6.72 8.58 8.26 13.28 9.21
Average 6.59 7.74 8.21 8.27 7.70
Leaf K Content (%)
Analysis of variance from parameter K uptake at organic fertilizer residues treatment showed a significantly effect and the addition of inorganic fertilizers are not significantly to the K uptake parameters. In the treatment of organic fertilizers, K uptake is highest in O3,3 treatment with 34.88
185
Table 3. K uptake in the treatment of organic fertilizer residues and inorganic fertilizer additions.
Organic Fertilizer Resudues
Inorganik Fertilizer Average
A0 A1 A2 A3
………g...
O0,0 11.40 7.79 11.08 11.67 10.48f
O0,1 19.47 29.89 41.62 21.93 28.23d
O0,2 22.27 27.93 24.33 48.94 30.87b
O0,3 22.14 40.27 26.26 38.79 31.86b
O1,0 21.99 34.32 49.52 28.04 33.47a
O1,1 18.04 31.39 36.52 25.35 27.83d
O1,2 19.44 26.85 31.28 29.56 26.78de
O1,3 22.86 24.84 26.73 35.10 27.38d
O2,0 16.24 22.99 31.73 28.18 24.78e
O2,1 25.61 25.18 29.02 38.70 29.63cd
O2,2 24.04 35.16 29.70 44.28 33.30ab
O2,3 30.83 33.69 27.36 28.22 30.02b
O3,0 23.49 28.61 48.18 31.43 32.93ab
O3,1 30.12 28.47 25.64 39.14 30.84bc
O3,2 19.96 25.20 37.94 30.26 28.34c
O3,3 24.06 33.53 37.77 44.17 34.88a
Average 22.00 28.51 32.17 32.74 28.85
Note: The numbers are followed by the same letter in the same row are not significantly different according to Duncans multiple
range test / DMRT at α=5%.
Plant Height (cm)
Table 4. plant height from the treatment of rorganic fertilizer esidues and inorganic fertilizer additions.
Weeks After Planting (WAP)
2 4 6
Organic Fertilizer Residues ……….cm……..
O0,0 10.75 22.00 40.53b
O0,1 10.79 21.04 39.93bc
O0,2 10.95 21.68 40.49b
O0,3 10.38 21.11 40.90b
O1,0 10.67 21.72 37.39d
O1,1 10.79 21.17 39.50c
O1,2 10.79 21.57 40.58b
O1,3 11.36 23.75 44.92a
O2,0 10.74 21.00 40.57b
O2,1 10.52 20.94 38.61c
O2,2 11.30 22.29 42.13ab
O2,3 10.83 22.40 42.24ab
O3,0 10.88 21.21 39.74c
O3,1 10.80 21.61 40.67b
O3,2 10.75 21.79 39.79c
O3,3 10.91 22.18 41.08b
Inorganic Fertilizer
A0 11.23 22.10 40.07
A1 10.85 22.66 42.40
A2 10.74 21.41 39.93
A3 10.49 20.69 39.86
Note: The numbers are followed by the same letter in the same row are not significantly different according to Duncans multiple
186 Analysis of variance showed that the treatment of organic
fertilizer residues significantly affect the parameters of plant height at 6 WAP observations while inorganic fertilizer treatment and the interaction between the residual organic material with the addition of inorganic fertilizers showed not significantly effect. At 6 WAP observation shows that the highest plant height found in treatment O1,3 are significantly different with other treatments and was lowest treatment found in O1,1 with the average 37.39.
Stem Diameter (mm)
Analysis of variance showed that the treatment of organic fertilizer residues and addition of inorganic fertilizers and the interaction of the two does not significantly affect the parameters of a trunk diameter of 2-6 MST. Observational data stem diameter 2-6 MST can be seen in Table 5.
Table 5. Stem diameter of residual organic fertilizer and the addition of inorganic fertilizers.
Weeks After Planting (WAP)
2 4 6
Organic Fertilizer Residues
……..mm……….
O0,0 2.16 3.72 6.13
O0,1 2.25 3.70 6.22
O0,2 2.17 3.80 6.27
O0,3 2.21 3.91 6.38
O1,0 2.15 3.76 5.89
O1,1 2.21 3.90 6.32
O1,2 2.17 3.76 6.17
O1,3 2.23 4.06 6.48
O2,0 2.13 3.75 6.28
O2,1 2.12 3.71 6.20
O2,2 2.20 3.88 6.13
O2,3 2.19 3.90 6.46
O3,0 2.17 3.76 6.17
O3,1 2.20 3.83 6.33
O3,2 2.10 3.65 5.97
O3,3 2.26 3.87 6.53
Inorganic Fertilizer
A0 2.18 3.74 5.94
A1 2.13 3.74 6.23
A2 2.20 3.87 6.32
A3 2.21 3.89 6.49
Number of Branches
Analysis of variance showed that the treatment of organic fertilizer residues significantly affect the number of branches on the observation 5, 6 and 11 MST. Inorganic fertilizer treatment significantly affected the number of branches on the observation parameters 6 and 11 MST
while the observations at 5 MST have not significanly effect while the interaction between the residual organic fertilizer with the addition of inorganic fertilizers showed not significanly effect on the observation 5, 6 and 11 MST. Observational data 5-11 MST number of branches can be seen in Table 6.
Table 6. Number of branches of the treatment of organic fertilizer residues and inorganic fertilizer additions.
Weeks After Planting (WAP)
5 6 11
Organic Fertilizer Residues
O0,0 2.57c 3.79bc 3.63e
O0,1 2.89ab 3.96b 3.99cd
O0,2 2.72bc 3.99b 3.97d
O0,3 2.81b 3.89b 4.13bc
O1,0 2.36d 3.75c 4.03c
O1,1 2.76b 3.83b 4.15b
O1,2 2.79b 3.74c 4.21ab
O1,3 3.06a 4.03b 4.15b
187
O2,1 2.72bc 3.85b 3.90d
O2,2 2.78b 3.83b 3.96d
O2,3 2.99a 4.07b 4.19b
O3,0 2.63c 3.96b 3.97d
O3,1 2.61c 4.03b 4.00c
O3,2 2.60c 4.25a 4.25a
O3,3 3.04a 4.39a 4.40a
Inorganic Fertilizer
A0 2.68 3.79 3.92
A1 2.72 3.94 4.13
A2 2.85 4.05 4.09
A3 2.78 4.01 4.10
Note: The numbers are followed by the same letter in the same row are not significantly different according to Duncans multiple
range test / DMRT at α=5%.
Table 6 shows that treatment of organic fertilizer residues significantly in the parameter number of branches in all observations. In general, it appears that the highest number of branches present in O3,3 treatment and lowest for the treatment of organic fertilizer is not applied in previous studies. This indicated that the residual organic matter can increase the number of branches in the next crop season, while in the growing season when the applied organic materials have not significanly effect
Number of pods
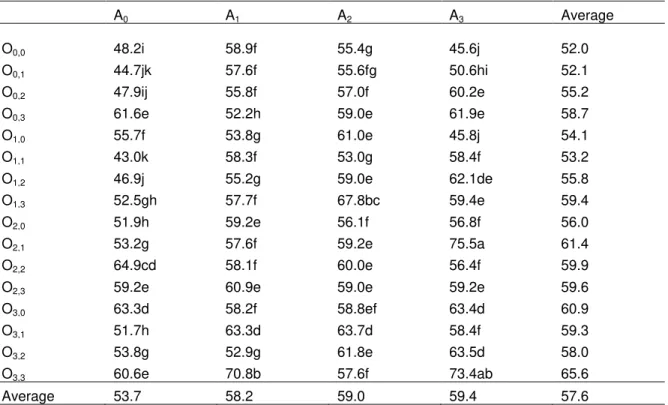
Analysis of variance showed that the treatment of organic fertilizer residues, addition of inorganic fertilizers and fertilizer residue interactions between organic and inorganic fertilizer additions significant effect on the parameters number of pods. Data observation number of pods of organic fertilizer residues and inorganik fertilizer additions can seen in Table 7.
Table 7. Number pods of organic fertilizer residues treatment and the addition of inorganic fertilizers.
A0 A1 A2 A3 Average
O0,0 48.2i 58.9f 55.4g 45.6j 52.0
O0,1 44.7jk 57.6f 55.6fg 50.6hi 52.1
O0,2 47.9ij 55.8f 57.0f 60.2e 55.2
O0,3 61.6e 52.2h 59.0e 61.9e 58.7
O1,0 55.7f 53.8g 61.0e 45.8j 54.1
O1,1 43.0k 58.3f 53.0g 58.4f 53.2
O1,2 46.9j 55.2g 59.0e 62.1de 55.8
O1,3 52.5gh 57.7f 67.8bc 59.4e 59.4
O2,0 51.9h 59.2e 56.1f 56.8f 56.0
O2,1 53.2g 57.6f 59.2e 75.5a 61.4
O2,2 64.9cd 58.1f 60.0e 56.4f 59.9
O2,3 59.2e 60.9e 59.0e 59.2e 59.6
O3,0 63.3d 58.2f 58.8ef 63.4d 60.9
O3,1 51.7h 63.3d 63.7d 58.4f 59.3
O3,2 53.8g 52.9g 61.8e 63.5d 58.0
O3,3 60.6e 70.8b 57.6f 73.4ab 65.6
Average 53.7 58.2 59.0 59.4 57.6
Note: Figures followed by the same letter in the same row or colum are not significantly different according to Duncan’s multiple
range test / DMRT at α =%.
Table 7 shows that the interaction between the residual organic material with the addition of inorganic fertilizer significantly affected the number of pods. The highest number of pods contained on O2,1A3 treatment (75.5) were not significantly different with treatment O3,3A3 (73.4). And
188 was not significantly different from that of inorganic fertilizer
applied only example in the treatment O0,0A3 (45.6) with O1,2A0 (46.9), even in some of the treatments that only organic fertilizer applied in previous crop appeared to have a higher number of pods than the inorganic fertilizers were applied only example in the treatment O2,2A0 (64.9) with O0,0A2 treatment (55.4) or O0, 0A1 (58.9). This indicated that the poorer the application of organic fertilizers can replace the role of inorganic fertilizers on the next crop.
Productions (kg)
Analysis of variance showed that the treatment of organic fertilizer residues significantly affect of parameters production per plot and production per plant. Treatment of the addition of inorganic fertilizer and interactions between organic fertilizer residues and the addition of inorganic fertilizer had not significantly effect on production per plot and production per plant.
Table 8. Production per plant and produktion per plot of residual organic fertilizer treatments and the addition of inorganic fertilizers.
Production per plant Production per plot (2x3m)
Residu Pupuk Organik
…….kg……
O0,0 0.0112c 0.6348ef
O0,1 0.0137b 0.7733c
O0,2 0.0126 0.7051de
O0,3 0.0153b 0.8641b
O1,0 0.0117c 0.6628e
O1,1 0.0140b 0.789.2c
O1,2 0.0118c 0.6707e
O1,3 0.0138b 0.7831c
O2,0 0.0109c 0.6068f
O2,1 0.0131bc 0.7168d
O2,2 0.0141b 0.7992bc
O2,3 0.0137b 0.7773c
O3,0 0.0134b 0.7114d
O3,1 0.0152b 0.7621cd
O3,2 0.0187a 0.9057a
O3,3 0.0187a 0.9275a
Pupuk Anorganik
A0 0.0139 0.7452
A1 0.0133 0.7276
A2 0.0131 0.7136
A3 0.0151 0.8360
Note: The numbers are followed by the same letter in the same row are not significantly different according to Duncans multiple
range test / DMRT at α=5%.
Table 8 showed that treatment of residual organic fertilizer can increase production per plant and production per plot. Production is highest in treatment O3,3 (927,5g) and O3,2 (905.7). The interaction between organic fertilizer residues with inorganic fertilizer application showed not significanly effect on production parameters. Production on the treatment of organic fertilizer alone is not much different than any inorganic fertilizer treatment, but when compared to the production data on the interaction of treatment, the
189 ha of manure or litter plants are partially embedded and
partially mulched can produce soybean production 2 times higher than that of the control equivalent to results obtained with urea, TSP and KCl each with a rate of 50 kg / ha. In the parameter of K total leaf showed a marked influence on the treatment of organic residues. Total K leaf in the treatment O3,3 looks almost 2X than on O0,0 treatment. K total was also seen lowest at the A0 treatment. This indicates that the residual organic fertilizer and the addition
of inorganic fertilizers can be an important source of K elements for plants. Dobermann and Fairhust (2000) stated that the straw contains about 1.2 to 1.7% K. Eagle et al (2000) in his research on rice plant stated that in the third year, the treatment without inorganic fertilizer application but added straw with embedded give grain or her higher when compared to treatment without the application of inorganic fertilizers and without the provision of hay or straw burned.
Table 9. Production per plot of residual organic fertilizer treatments and the addition of inorganic fertilizers.
Treatment A0 A1 A2 A3
…………kg………..
O0,0 0.59780 0.54507 0.68133 0.71493
O0,1 0.77117 0.80440 0.65333 0.86427
O0,2 0.61273 0.55387 0.72427 0.92960
O0,3 0.89717 0.74107 0.90347 0.91467
O1,0 0.70443 0.71867 0.61040 0.61787
O1,1 0.75507 0.71307 0.77227 0.91653
O1,2 0.76087 0.61720 0.65333 0.65147
O1,3 0.76930 0.76160 0.92960 0.67200
O2,0 0.59267 0.59307 0.56373 0.67760
O2,1 0.66253 0.72800 0.57493 0.90160
O2,2 0.84303 0.72800 0.74667 0.87920
O2,3 0.82250 0.79147 0.64773 0.84767
O3,0 0.63000 0.75413 0.57120 0.89040
O3,1 0.90603 0.71680 0.53013 0.89547
O3,2 0.83837 0.98080 0.87627 0.92720
O3,3 0.76020 0.89493 0.97867 1.07627
The results of the production parameters showed that an increase in production per sample and production per plot in each treatment organic fertilizer residues. This increase of 80% when compared to the control treatment (Table 10). Many theories that support the increase in soybean production in the treatment of residual organic material. Including a role in the binding of heavy metals such as Na, Fe, Al, Cr, Pb, Cd and others, so that some of the nutrients that are bound to the element can be absorbed by plants. In besides, organic matter in the soil will be transformed into humus compounds. Humus compounds have several groups such as carboxyl, phenol, carbonyl and others that humus compounds have negative and positive charge. The existence of the charge will affect nutrient retention capacity of the soil. Increasing negative charge by increasing humus soil as a result of organic matter/residual organic material will affect the chemical properties of the soil, namely increasing nutrient retention with increasing soil buffering capacity against environmental changes or manipulation by humans. Nutrients in the form of cations such as K +, NH4+, Ca2+ and Mg2+ bound by elekrtostatik negatively charged. Negatively charged nutrients such as NO3 and Cl will be bound by electrostatic negative charge. Thus the nutrients that have been tied not much is lost through leaching.
Conclutions
Application of organic and inorganic fertilizers singly showed significant effect on the increase in the number of
pods and soybean production but but the treatment interaction effect was not evident though is generally found to improve production in O3,3A3 treatment reached 80% (which is not much different from the production O3,3A2 treatment) compared with controls. It shows that the best dose for soybean crop fertilization in rainfed areas is O3,3A2 namely 6 tones ha-1 straw + 1.5 tones ha-1 fertilizer petroganik + 0.25 tonnes ha-1 fertilizer Phonska.
References
[1] [BPS] Badan Pusat Statistik. 2011. Produktivitas dan Produksi Tanaman Kedelai Berdasarkan Luas Panen di Indonesia. http://www.bps.go.id/. [25 Januari 2012].
[2] Dobermann, A and T. Fairhurst. 2000. Rice. Nutrient Disorders & Nutrient Management. International Rice Research Institute (IRRI). Potash & Phophate Institute/Potash & Phosphate Institute of Canada. p: 139-144.
[3] Ginting. E., S. S. Antarlina, and S. Widowati. 2009. Varietas unggul kedelai Untuk bahan baku industri pangan. Journal Litbang Pertanian, 28(3), 2009
190 Alternative Straw Management Practices. Agron.J.
92:1096-1103.
[5] Mulyadi, Sukristyonubowo,Heryadi and D. Santoso. 1995. Pengaruh Bahan Organik dan Pupuk N, P dan K Terhadap Produktivitas Lahan Kering Berikim Kering. Risalah Seminar Hasil Penelitian Tanah dan Agroklimat. Pusat Penelitian Tanah dan Agroklimat. Bogor. 2:63-66.
[6] Sugiyanta. 2007. Peran Jerami dan Pupuk Hijau Crotalaria juncea Terhadap Efisiensi dan Kecukupan Hara Lima Varietas Padi Sawah. Disertation. Sekolah Pascasarjana. IPB, Bogor.