MESTRADO
FINANÇAS E FISCALIDADE
Capital Origin and Financial
Determinants of Effective Tax Rate
Pedro Sousa Topa
M
I
CAPITAL ORIGIN AND FINANCIAL DETERMINANTS OF THE
EFFECTIVE TAX RATE
Pedro Sousa Topa
Master Thesis
Master in Finance and Tax
Supervised by:
Professor Doutor Francisco Vitorino da Silva Martins Professor Doutor Elísio Fernando Moreira Brandão
II
Acknowledgements
The accomplishment of this master thesis took longer than expected and required the collaboration from more people than expected, thus I would like commence by candidly express my gratitude for all those people.
Firstly I would like to sincerely thank my master thesis supervisors, Professor Francsico Vitorino and Professor Elísio Brandão, for their constant interest, involvement and valuable insights. Without them this endeavor could not be completed.
Furthermore, I would like to dedicate this work to my family. Without their support, motivation and interest the completion of this endeavor would be meaningless.
I also want to praise all my friends for their help and patience with a special reference to Patrícia, whose advice was vital.
Finally, I thank Isabel for the constant support and company, especially on the most crucial moments.
III
Abstract
The most diverse economic agents take interest on the factors that determine corporate effective tax rates (ETR). From the shareholders perspective, ETR determinants might mean significant tax savings; conversely, for Governments, they define a country’s income and influence its State’s Budget.
In this context, this investigation contributes to the extant literature on the matter by presenting evidence of how ETR are determined by companies’ characteristics. For that purpose a sample of 38.371 Portuguese companies was used over 9 years (2008-2016). The econometric model was estimated through two ETR measures by using Generalized Least Squares (GLS) with cross-section weights.
The results obtained indicate that companies with higher profitability (measured by ROA), size and inventory intensity show higher ETR. Contrarily, companies with higher leverage, and fixed assets intensity show lower ETR. These findings are as foreseen in extant literature. Finally, companies whose shareholders are foreign show a lower ETR.
The research archived significant and relevant results, combining companies’ ETR and its characteristics.
JEL Codes: G30, H22
IV
Index of contents
1. Introduction... 1
2. Literature review ... 4
2.1. Firms’ specific characteristics and ETR ... 4
2.2. Capital Origin and ETR ... 6
3. Research hypothesis ... 7
3.1. Profitability and ETR ... 7
3.2. Size and ETR ... 7
3.3. Leverage and ETR... 8
3.4. Fixed Assets Intensity and ETR ... 8
3.5. Inventory Intensity and ETR ... 8
3.6. Capital Origin and ETR ... 8
4. Variables ... 10
4.1. Variables Definition ... 10
4.1.1. Dependent Variables ... 10
4.1.2. Independent Variables ... 11
4.2. Sample Selection ... 12
5. Methodology and Univariate Analysis ... 14
5.1. Methodology ... 14
5.2. Univariate Results ... 15
6. Results ... 18
1
1. Introduction
The purpose of this document is to contribute to the extant literature on the determinants of effective tax rates (ETR) focusing specifically on the importance of the companies’ financial, operational, other related characteristics and the origin of its share capital on ETR.
Corporate tax, as any other tax, is primarily an instrument of a country’s or region fiscal policy. As commonly known, a country’s political choices and program depends greatly on its capacity to finance those choices. Moreover, the adopted fiscal policy is, per se, a political choice. In recent years, most developed countries have chosen to reduce their nominal corporate tax, either to improve their competitiveness on the race of luring investment, either as a result from political ideology or social claim. Notwithstanding, corporate tax remains one of the most important income source in developed countries.
In this context, investigations addressing the analysis of which corporate characteristics weight on the State’s Budget’s revenue should be particularly useful for governments, international institutions, regulatory offices and other governmental bodies.
As it is easy perceivable, being important at a macroeconomics level, ETR are vital and sometimes decisive for corporate governance at a microeconomics level. In fact, it is hard to argue for the neutrality of taxes when it comes to corporate decisions. As a matter of fact Robinson et al. (2010) showed that considering a company’s tax department as a “profit center” results in lower ETR. Moreover, as per Graham (2003), ETR can affect corporate governance, risk management, capital structure, payout policy, among others. Thus, taxes are growingly perceived as the final component affecting a company’s profitability, as a reduction on the ETR results on a direct increase of its net profits, therefore, contributing directly to a company’s main goal – to create value to its shareholders. Bearing this in mind, this paper analyses the impact on ETR of the companies’ characteristics.
There were many studies addressing the impact of companies’ characteristics impact on its ETR: Kraft (2014); Richardson and Lanis, 2007; Hanlon et al., 2010; Minick and Noga, 2010; Armstrong et al., 2012; Gupta and Newberry (1997); Desai and Dharmapala (2006); Dyreng et al., 2008; among others. Based on the cited literature, this paper expects that size, profitability, capital structure, fixed assets intensity and inventory intensity to have an appreciable impact on ETR. ETR is measured dually: as the quotient between the total tax expense and the pre-tax income and, also, as the quotient between the total tax expense
2
and the total operational income. Tax expense is defined in the IAS 12 (IASB, 2010) as “the
aggregate amount included in the determination of profit or loss for the period in respect of current tax and deferred tax.”.
In addition to measure the impact of the companies’ financial indicators and characteristics on their ETR, this paper also aims at determining if the capital origin of a company influences its ETR. Precisely, this paper tests if there is a considerable effect on a company’s ETR resulting from the fact that it is owned by foreign investors.
In recent years there have been cases of high-profile and high-profitability international companies with low ETR, with special reference to technological and related companies originary from the USA and with operations in European countries. Thus, there is a growing concern regarding the fairness of the ETR of high-profile companies and its comparison with the ETR registered in its domestic counterparts.
Although there is a vast literature on directly or indirectly related issues, there is not much empirical work comparing the tax expenditure between foreign owned companies and domestically owned companies. Shackelford and Slemrod, 1998; Egger et al., 2010b; and Markle and Shackelford, 2009, 2012, are some of the authors who performed research work on this matter. Shackelford and Slemrod (1998), studying companies based in the U.S., suggest find evidences of some tax shifting from domestic corporations to its subsidiaries overseas. For Markle and Shackelford (2009, 2012), there is no a global pattern about the ETR faced by foreign owned companies and their domestic counterparts. Finding evidence that neither foreign owned companies regularly pay lower taxes, nor that domestically owned companies consistently operate at a tax disadvantage. Finally, Egger et al. (2010b) finds evidence supporting that that ETR of foreign owned enterprises are higher than those of domestically owned companies in high-tax countries though higher in low tax countries.
In order to analyze the determinants of the ETR based on the above, particularly related to companies’ characteristics and its capital origin, a sample of companies based in Portugal was selected. The sample is constituted by 38.371 companies analyzed over the 2008-2016 period. Furthermore, using the model by Richardson and Lanis (2007) and Kraft (2014) an estimation of two regressions was performed. The regressions use Generalized Least Squares (GLS) with cross-section weights and time fixed effects through the inclusion of year dummy variables.
3
The results of the regressions performed display that companies’ financial characteristics have an impact on its ETR. Thus, more profitable, larger and relatively more inventory intense companies show greater ETR. On the contrary, companies with relatively higher leverage and fixed assets intensity show smaller ETR. Finally, our tests display that capital origin is also a determinant of a company’s ETR, showing that its effective tax rate would be smaller if a company is owned by foreign investors.
The contribution of this paper to the extant literature related to ETR and, more broadly, to Taxation is perceivable on both theoretical and empirical levels. Considering that most of the investigations about ETR focus on USA-based companies and that most use public companies, the sample is innovative by using all available companies based in Portugal. Moreover, most studies focus on a shorter analyzes period. Additionally, there was no other investigation addressing ETR of Portuguese companies as widely as it is done in this paper. Finally, this paper innovates by testing an additional determinant relating to the capital origin, which had never directly been included on an ETR determinants research. The Section 2 of this paper presents a brief review of the extant literature related with the influence of companies’ characteristics and capital origin on ETR. Section 3 presents our set of hypothesis. Section 4 describes the sample selected and the variables utilized. Section 5 addresses the methodology of the regressions performed. Results are exhibited on Section 6. And Section 7 presents summary of the conclusions reached on this paper.
4
2. Literature review
Undoubtedly, taxation importance as core determinant of a company’s performance is growing. In addition, in recent years, corporate tax expenditure is becoming a center issue on the public opinion, related precisely to the low ETR paid by some, apparently profitable, large companies. Therefore, it is increasingly difficult to advocate for corporate tax neutrality as there is growing evidence that it influences significantly corporate governance. As, ultimately, taxes represent a cost to a company, they invariably affect its profits. Graham (2003) presents a set of corporate decisions that are conditioned by taxation. Additionally, a large contingent of literature has investigated ETR (Dyreng et al., 2008; Minick and Noga, 2010; Armstrong et al., 2012; Kraft, 2014).
When studying tax expenditure, looking at the nominal tax rates is virtually useless. In fact, in most developed countries’ tax systems, the taxable profit is considerably diverse from the profit resulting from the company’s profit and loss accounts. As most tax systems foresee several corrections on the computation of the taxable profit, to which are then commonly applied tax benefits reducing, differing or deducting the tax due.
Bearing in mind the above, ETR commonly diverge significantly from the nominal tax rate, being determined by several other economic and legal factors and companies’ individual characteristics.
2.1. Companies’ specific characteristics and ETR
It is fairly easy to assume that a company’s specific characteristics influence considerably the tax it pays. An intuitive indicator with capacity to influence effective tax rate is a company’s profitability measured based on its pre-tax income, as it is expected that more profitable companies have higher taxable profits and, consequently, pay more taxes. This perspective is often depicted on extant literature. Gupta and Newberry (1997), Richardson and Lanis (2007), Minick and Noga (2010) and Armstrong et al. (2012) found a positive relation between a company's ETR and its profitability. Contrarily, Manzon and Plesko, (2002) argue that profitable companies are, probably, more able to capitalize on tax benefits or exemptions, resulting in the fact that these companies show a greater book-tax differences. Additionally, Rego (2003) argued that more profitable companies benefit relatively lower costs from maintaining an active and capable tax department. Moreover more profitable companies tend to have a greater maneuverability to engage in activities
5
and projects that allow them to benefit from tax credits which normally are deducted to their tax due. These latter perspectives link with recent tax scandals associating low tax expenditures to large, global and profitable companies.
Another specific characteristic that is usually associated with a companies’ ETR is its size. This feature is commonly included on research about effective tax rates. As it happened with profitability, there is literature arguing for the positive effect of size on a company’s ETR, and literature defending the contrary. According to Zimmerman (1983) larger companies are associated to higher ETR. The author explains this finding by linking the companies’ size with their political cost. Thus, ETR is an indicator of a company’s profitability and more broadly, success, and more profitable and successful companies tend to be under bigger scrutiny from both Tax Authorities and the community. Consequently, larger companies tend to have higher tax expenditure, since taxes paid represent political costs, which shall be accommodated by larger companies. This theory is consistent with the findings of Rego, 2003; and Kraft, 2014. The alternative theory states that, since larger companies have more power and more resources to manage taxes, it is expected that they have lower ETR. This is consistent with the findings of Richardson and Lanis, (2007) who compute a negative relation between size and ETR. In summary, previous literature is not consensual regarding the impact of a company’s size on its ETR.
Another factor oftentimes included in the ETR determinants literature relates to the companies’ structure, more specifically its capital structure. A company may decide to finance its activity, basically, choosing between debt and equity. Although there is no direct cost to the company resulting from financing its activity with equity, in most developed countries, the eventual dividends distributed will not be considered a cost for taxable profit computation purposes. On the other hand, financing its activity with debt will allow a company to deduct the interest expenses as costs on the taxable profit computation. Although there are thin-capitalization regulations and, recently, some tax benefits to equity financing and some tax limitations to the deductibility of interest expenses, there is still a tendency for companies to finance their activity through debt associated with what is commonly called the tax shield. Hence, it is expected that more leveraged companies exhibit lower ETR. The previous literature finds a consistent negative relationship between leverage and ETR as per Richardson and Lanis (2007) and Kraft (2014).
As an unfolding from the financing choices between debt and equity, where the company chooses to investment those funds is also regularly included as indicators of its ETR. More
6
specifically, on most accounting and tax systems, the acquisition of fixed assets results on a yearly deductible cost related to depreciations and amortizations of those assets. Typically depreciations and amortizations are an important slice of companies’ costs. Therefore, companies that are relatively more fixed assets intensive tend to register relatively higher costs related to depreciations. This is heighten by the fact that fixed assets tend to have a longer economic life than the useful life predicted by the depreciation rates. Thus, relative fixed assets intensity is correlated with lower ETR. This is argued by Richardson and Lanis (2007). Correspondently, the authors also include a relative inventory intensity variable on ETR. As an antonym of the fixed assets intensity, companies with higher inventory intensity are expected to have higher ETR. Concordantly, Gupta and Newberry (1997) conclude that a positive relation between higher proportion of inventory and higher ETR. Kraft (2014), contrarily to these findings, sustains that the fiscal benefits associated to capital intensity which result in differences between book and tax accounts will be captured by the deferred component of ETR, therefore this author does not include these variables in his model.
2.2. Capital Origin and ETR
One of the contributions of this paper is including a new variable related to capital origin on the model to determine if it influences companies’ ETR. Although there is vast literature comparing the taxation of multinational companies to their domestic counterparts, not much have been researched considering the effects of capital origin on ETR using wide and empirical data. According to Markle and Shackelford (2009) and (2012), favorable tax treatment for foreign companies invariably results on concerns from their domestic companies. However, for these authors, foreign companies and their domestic counterparts face similar ETR. According to these authors there is no a global pattern about the tax expenditure faced by foreign companies and their domestic counterparts, as in some countries are foreign owned companies that faced higher ETR, and in other the reverse is true. Egger et al. (2010b) states that there is a significant difference between foreign and domestic companies’ ETR, however, the direction of such difference varies whether the foreign company is located on developed or developing countries, as foreign companies located in developed countries tend to show lower ETR when comparing to domestically owned companies, and the contrary is true for foreign companies located in developing countries.
7
3. Research hypothesis
Further to what was previously mentioned and taking it into account, the research hypotheses for this paper are formulated below.
In the ETR related literature, the majority of the authors mention that, size, profitability, leverage, inventory and fixed assets relative intensities are the most relevant companies’ characteristics that affect its tax expenditure. Thus, these five characteristics were used to analyze the determinants of the ETR. Moreover, this paper includes an additional determinant related with the capital origin.
It is important to mention that, when formulating the research hypotheses, when the extant literature was discordant, the direction to the effect was not predicted.
3.1. Profitability and ETR
As per Gupta and Newberry (1997), Richardson and Lanis (2007), Minick and Noga (2010) and Armstrong et al. (2012), it would be expected to find a positive relation between a company's ETR and its profitability. However, Manzon and Plesko, (2002) and Rego (2003) argue that profitable companies would be more capable of using tax credits, manage book to tax differences more advantageously and use larger tax credits, resulting in lower ETR.
Thus, it is assumed that profitability has an effect on a company’s ETR, although no prediction is made regarding its direction:
H1: Profitability has a significant relationship with ETR.
3.2. Size and ETR
Zimmerman (1983), Rego, 2003; and Kraft, 2014 advocate that ETR would increase with a company’s size. However, Richardson and Lanis, (2007) find a negative relation between size and ETR.
In summary, as it happened with profitability, previous literature is not consensual regarding the impact of a company’s size on its ETR, therefore it is assumed that size has an effect on a company’s ETR, although no prediction is made regarding its direction:
8
H2: Size has a significant relationship with ETR.
3.3. Leverage and ETR
As it is almost consensual on the extant literature, if a company’s financing is more intensive on debt, the company shall exhibit a lower ETR, benefiting from the so-called tax shield.
As the previous literature finds a consistent negative relationship between leverage and ETR, it is predicted that:
H3: There is a negative relationship between leverage and ETR.
3.4. Fixed Assets Intensity and ETR
As per Richardson and Lanis (2007), more fixed assets intensive companies tend to register relatively higher costs with depreciations and amortizations. As these costs tend to represent an important part of a company’s expenditure, more fixed assets intensive companies tend to register lower ETR.
As the extant literature is fairly concordant on this matter, it is predicted that:
H4: There is a negative relationship between fixed assets intensity and ETR.
3.5. Inventory Intensity and ETR
Reciprocally, companies with higher inventory intensity are expected to have higher ETR. This perspective is shared with Gupta and Newberry (1997). Although Kraft (2014) finds that on the long term these effects would be eliminated, we predict that:
H5: There is a positive relationship between inventory intensity and ETR.
3.6. Capital Origin and ETR
On the last hypothesis formulated on this paper, given that it is practically and uncharted territory, especially when analyzing Portuguese companies, and that the extant literature is
9
not concordant on the matter, as Markle and Shackelford (2009) and (2012), foreign companies and their domestic counterparts face similar ETR and for Egger et al. (2010b) there is a significant difference between foreign and domestic companies’ ETR, however, the direction of such difference varies according to its location.
Thus, it is assumed that the capital origin of a company will have a significant impact on its ETR, however its direction is not predicted:
10
4. Variables
4.1. Variables Definition
4.1.1. Dependent Variables
As this paper aims at analyzing the determinants of effective tax rates, ETR is imperatively the dependent variable. As previously stated, each of the ETR measures will result from the quotient between the tax expenditure and the pre-tax income or the total operational income, respectively. Given that the different tax systems on most developed countries result on book-tax differences, the tax expenditure will be result of the sum between the current tax paid and the deferred tax expenditure, as per the IAS 12.5 (IASB, 2010) “(…)
tax expense (tax income) is the aggregate amount included in the determination of profit or loss for the period in respect of current tax and deferred tax.”. Deferred tax expenses consist on the positive differences that resulted on the current year’s computation of taxable profit, which will, probably, be reverted in the future.
The measures for ETR considered in this paper are consistent with those used by Richardson and Lanis (2007), Chen et al. (2010), Minick and Noga (2010), Armstrong et al. (2012) and Kraft (2014) and differ from the ones considered by Gupta and Newberry (1997) and Rego (2003) because they considered that the tax expenditure would result only from the current tax expense. As per the above, it is considered that taking into account the deferred tax expense shall result on more exact and factual results, as deferred taxes also affect a company’s tax expenditure. For the denominator, and again in line with Richardson and Lanis, 2007, it was considered the pre-tax income and the cash-flow from operations. As stated by Richardson and Lanis, 2007, taxable income would not be a good denominator for tax expense because one would not be able to observe the impact of tax preferences on ETR if both measures are considered after the tax adjustments. The operational cash flow consists on the operational profit summed by the depreciations and amortizations expenses. This paper included a second measure of ETR, because, by using the operational cash flow as denominator the differences resulting from alternative accounting methods can be controlled (Zimmerman, 1983). Thus, on this paper, ETR is defined as below, where “i” represents the company and “t” represents the year:
11
2 = / ℎ " #
In line with the corrections made by Gupta and Newberry (1997) and Kraft (2014), some restrictions were performed to the ETR data. A control was performed in order to transform all the negative ETR values to 0% (0 corrections) and to limit all the ETR values greater that 100% to that value (7.259 corrections). Concurrently, when the denominators, pre-tax income or operational cash flow, were negative, a control was performed in order to transform the ETR measure to 100% (56.633 corrections).
Recently more authors have chosen to use long-run ETR measures arguing that analyzing tax avoidance with yearly ETR results in some limitations (Dyreng et al., 2008; Minick and Noga, 2010; Vieira, 2013). However, this paper does not aim directly at analyzing tax avoidance phenomena, as it is endeavor on the study of ETR’s determinants. Additionally, given the large analysis period used (2008-2016), we consider that these limitations shall be surpassed. Thus, it is believed that a yearly measure of ETR will fulfill this paper’s ambitions.
4.1.2. Independent Variables
As briefly described on Section 3, in order to compute the model, the companies’ financial variables used are: profitability, size, leverage, fixed assets intensity and inventory intensity. In line with Vieira (2013) and Kraft (2014), profitability was defined as the Return on Assets Ratio (ROA), resulting from the quotient between pre-tax income and total assets. Size, as broadly defined on the extant literature, was defined as the logarithm of the total assets (Gupta and Newberry, 1997; Richardson and Lanis, 2007; Vieira, 2013).
Leverage, in order to test the existence and effectiveness of the so-called debt tax shield, was defined as the ratio between long-term debt and equity, as was performed by Chen et al. (2010) and Huang et al. (2010).
Accordingly to the works of Gupta and Newberry, 1997 and Richardson and Lanis, 2007, fixed assets intensity was included as the ratio between fixed assets and total assets. Additionally, inventory intensity was defined as the quotient between stocks and total assets.
12
Finally, it was included one dummy variable - capital origin - equaling one if a company has at least 50% of its share capital held by a non-Portuguese entity or person, and zero if a company has at least 50% of its share capital held by a Portuguese entity or person.
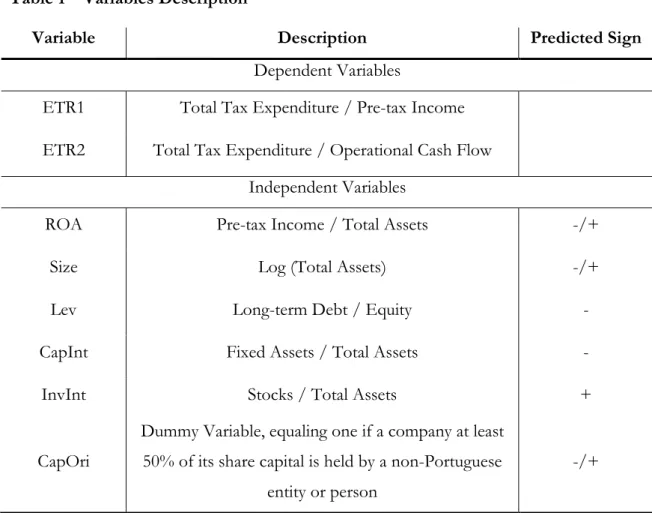
Table 1 – Variables Description
Variable Description Predicted Sign
Dependent Variables
ETR1 Total Tax Expenditure / Pre-tax Income ETR2 Total Tax Expenditure / Operational Cash Flow
Independent Variables
ROA Pre-tax Income / Total Assets -/+
Size Log (Total Assets) -/+
Lev Long-term Debt / Equity -
CapInt Fixed Assets / Total Assets -
InvInt Stocks / Total Assets +
CapOri
Dummy Variable, equaling one if a company at least 50% of its share capital is held by a non-Portuguese
entity or person
-/+
4.2. Sample Selection
All the information available on the Amadeus Database regarding companies based in Portugal for all the years available was used. Thus, initially, the sample was compounded by 53.461 active companies over the period of 2008 to 2016, totaling 481.149 observations. However, observations with no available value for ETR1 and ETR2 were excluded (resulting on the exclusion of 146.827 observations). Finally, due to the correction above described or to the fact that there are companies in our data that were only incorporated on 2016, some companies were left with information available for one of the years of the analyses’ period. These companies were excluded from the database as they would not suit
13
a data panel analysis, which will be applied (resulting on the exclusion of 2.726 observations/companies).
Table 2 - Sample selection process
No. of observations
Available Portuguese Companies on Amadeus Database 481.149
Companies with unavailable ETR1 and ETR2 -146.827
Companies with data for only one year -2.726
Total observations included 331.596
From these corrections the total number of companies included on this investigation was reduced to 38.371, totaling 331.596 observations.
14
5. Methodology and Univariate Analysis
5.1. Methodology
This section will explain the strategy used to test the hypothesis formulated on section 3 of this paper.
As described on the previous section, the sample has a panel structure, thus, was considered that the application of a panel data model would optimize the results obtained in this investigation. As per Baltagi (2003), the panel data models have the advantage of controlling for individual heterogeneity. In its turn, this allows for the identification and measurement of impacts that would, otherwise, be undetectable. Additionally, data panel models tend to be more efficient by allowing for more degrees of freedom and reducing collinearity. Bearing the above in mind, by using a panel data model, this paper also controls for cross-section and time effects.
In order to test if the data panel model should be used with fixed or random effects, a Hausman test was previously performed, resulting on the rejection of the possibility of equal coefficients, therefore, fixed effects model suits this investigation better. The fixed effects models allows the control of the effect of time-invariant differences between the individuals. Moreover, we assumed that there was no correlation between the error term and the observed variables. Finally, considering the data used, a White test was performed in order to test for heteroscedasticity.
From the tests above performed and the intrinsic characteristics of the data used, the regressions performed under this investigation used Generalized Least Squares (GLS) with cross-section weights and the inclusion of year dummy variables in order to fix the effect for time. These year dummies also enable the control for special phenomena occurred during the period of analyses that may impact on the ETR, which would otherwise be included on the error term. This strategy results on more efficient results given the disparate individual variances resulting from companies’ individual heterogeneity.
Each independent variable was windsorized at 0,5% and 99,5% levels in order to reduce the effect of outliers.
Concluded the preparatory procedures, then followed the testing of the formulated hypothesis. The estimation of the determinants of the ETR was performed by using two
15
different regression models. These two models vary only on the defined dependent variable, the first uses ETR1 and the second uses ETR2:
1 = $%+ $' ( + $)* + + $,- . + $/ + $0 . + $1 + +2 3 + 4 (5.1) 2 = $%+ $' ( + $)* + + $,- . + $/ + $0 . + $1 + +2 3 + 4 (5.2)
where i relates to each company (i = 1, …, 38.371) and t relates to each year (t = 2008, …, 2016), the error term is represented by ε. In addition to the independent variables already described, the model includes the year dummies in order to control for time effects.
5.2. Univariate Results
Table 3 – Descriptive Statistics
Variable Mean Median Maximum Minimum Standard
Deviation ETR1 0,424610 0,285166 1,000000 0,000011 0,322710 ETR2 0,347574 0,217530 1.000000 0,000000 0,060934 ROA 0,037379 0,022244 0,585089 -0,582559 0,080859 Size 15,17604 15,034300 19,44608 10,434690 1,541634 Lev 1,823772 0,489904 48,89686 0,002644 5,531886 CapInt 0,372481 0,325298 0,994566 0,000245 0,265472 InvInt 0,200462 0,129009 0,986608 0,000296 0,217859 CapOri 0,150793 0,000000 1,000000 0,00000 0,357851
16
As per the table above, comprising the main descriptive statistics of the variables used, the average of ETR1 is approximately 42,46%, a considerably high effective tax rate, specially taking into consideration that the Portuguese nominal tax rate for the period ranged between 25% and 21%. Once again, it is possible to empirically observe nominal tax rates tell little about the ETR. This statistic is in line with the values registered on ETR2. Additionally, it is relevant to point that the median value for the ROA variable is approximately 2,22%, meaning that at least 50% of the companies included on the sample registered a ROA above that threshold. Finally, regarding the three capital structure variables, it is relevant to point out that the Portuguese companies analyzed register, on average, a long-term debt and equity ratio of 1,85, meaning that, on average, equity represents 54,05% of the analyzed companies long term debt. However, the median for this value totals 0,49, meaning that at least 50% of the companies included on the sample have an equity representing 208,33% of its long-term debts. At a first glance this might seem a fairly conservative and sober corporate structure, however, this paper attributes this phenomena to the probable tendency for Portuguese companies to rely on short-term debt, unbalancing the LEV ratio. CapOri’s, the dummy variable controlling for the Portuguese or foreign ownership of the share capital, average of approximately 15,01%, shows approximately 15% of the companies included on the analyses are held by non-Portuguese entities or persons.
The Pearson’s correlations matrix included on the Table 5 below, shows that ETR1 and ETR2 are positively correlated, which is expected as both measures of ETR only differ by the denominator of the ratio. ETR1 has, in fact, a positive correlation with ROA, Size and Stock Intensity. On the other hand it has negative correlation with Leverage, Capital Intensity and Capital Origin. The results obtained with ETR1 are consistent with the ones obtained with ETR2. Regarding the correlations among independent variables, as expected, leverage and fixed assets intensity are positively correlated between them and negatively correlated with inventory intensity. Larger companies tend to be more profitable as Size and ROA are positively correlated. Moreover more fixed assets intensity companies tend to be larger companies, as CapInt and Size are positively correlated. Finally, companies in which, at least, 50% of the shares are held by a non-Portuguese entity or person tend to be more profitable, larger, with greater leverage and more capital intensive.
17
Table 4 – Pearson’s Correlation Matrix
Variable (1) (2) (3) (4) (5) (6) (7) (8) ETR1 (1) 1,000 ETR2 (2) 0,486 1,000 ROA (3) 0,137 0,067 1,000 Size (4) 0,028 0,075 0,068 1,000 Lev (5) -0,141 -0,160 -0,016 -0,045 1,000 CapInt (6) -0,074 -0,053 -0,137 0,252 0,082 1,000 InvInt (7) 0,059 0,046 0,120 -0,052 -0,106 -0,462 1,000 CapOri (8) -0,038 -0,031 0,031 0,202 0,031 0,023 -0,053 1,000
18
6. Results
Using the equations (5.1) and (5.2) defined in the methodology section, two regressions were performed using Generalized Least Squares (GLS) cross-section weights, in order to mitigate the heteroscedasticity, and with year dummies, in order to control for time effects. On the Table 6 are presented the results of the regressions performed.
Table 6 – Regression Results – ETR1 (1)
Variable ETR1 (1) C -0,0496** (-2,0156) ROA 0,0136*** (2,6313) Size 0,0297*** (2,6058) Lev -0,0420* (-1,7334) CapInt -0,0617** (-1,9755) InvInt 0,1691*** (2,6255) CapOri -0,0311* (-1,8631)
Year Dummies YES
R-Squared 0,610142
Adjusted R-Squared 0,609720
F-Statistic 1.449,312
19
Regression Results – ETR2 (2)
Variable ETR2 (2) C -0,03411* (-1,8813) ROA 0,0413*** (2,6397) Size 0,0364*** (2,9339) Lev -0,0139** (-2,0052) CapInt -0,0925** (-2,3347) InvInt 0,0616* (1,7595) CapOri -0,0621* (-1,8031)
Year Dummies YES
R-Squared 0,478460
Adjusted R-Squared 0,462540
F-Statistic 1.032,21
Prob (F-statistic) 0,0000
Note that, as described, ETR1 and ETR2 only differ from the denominator, as ETR1 is divided by the pre-tax income and ETR2 by the operational cash flow. As per Zimmerman, 1983, ETR2 is probably more reliable because it controls for different accounting methods. The first hypothesis formulated on section 3 relates to companies’ profitability. ROA was used as a measure of profitability. With accordance with the findings of Richardson and Lanis (2007), Minick and Noga (2010) and Armstrong et al. (2012), the results obtained
20
show that profitability has a positive and significate impact on both ETR1 (β = 0,0136; t = 2,6313) and ETR2 (β = 0,0413; t = -1,8813). This result can be justified by the fact that more profitable companies, due to their higher profits, tend to have higher taxable profits and, consequently, tend to have higher tax expenditure. The estimation executed on this paper shows that profitability has a significate impact on ETR, confirming H1. Moreover, it shows that its impact is positive. This finding goes against the argument defended by Manzon and Plesko, (2002) and Rego (2003) that more profitable companies have a higher capacity of tax planning or that they have a relatively lower cost of maintaining a capable tax department, resulting on lower ETR.
As with profitability, the variable size shows a positive and significant impact on both ETR1 (β = 0,0297; t = 2,6058) and ETR2 (β = 0,0364; t = 2,6397). These results, besides confirming the H2, showing that Size, measured by the logarithm of total assets, has a significate impact on ETR, align with the results obtained by previous authors, such as Zimmerman (1983), Rego (2003) and Kraft (2014). Thus, larger companies tend to have a higher ETR, sustaining the taxes’ political cost theory, in which taxes work as an indicator to a companies’ success.
In order to ascertain if the so-called tax shield was confirmed for the sample used, the regression performed included the variable Lev, consisting on the ratio between long-term debt and total equity. The results show that, as hypothesized on H3, higher leverage has a negative and significant impact on both ETR1 (0,0420; t = 1,7334) and ETR2 (β = -0,0139; t = -2,0052). This result would help justifying companies’ preference to use debt as the main financing method due to its tax-shield effect, as defended Richardson and Lanis, 2007.
In order to confirm if a company’s investment choices have an impact on its ETR, H4 and H5 were included. H4 suggested that, companies with higher fixed assets intensity, measured as the quotient of the total fixed assets and the total assets, show a lower ETR. This is due to the fact that companies with higher fixed assets intensity tend to have relatively higher depreciation and amortization costs. These costs are usually a significant part of a company’s expenditure and eligible for taxable profit computation, resulting on lower taxable profits. The results obtained confirm H4, showing that fixed assets intensity measured by CapInt has a negative and significant impact on both ETR1 (β = -0,0617; t = -1,9755) and ETR2 (β = -0,0925; -2,3347). These results are consistent with the extant literature, such as Gupta and Newberry (1997) and Richardson and Lanis (2007).
21
Concurrently, the H5 theorized that companies with relatively higher inventory intensity, measured as the value of stocks divided by total assets, would register a higher ETR. This hypothesis is confirmed by the results obtained on both ETR1 (β = 0,1691; t = 2,6255) and ETR2 (β = 0,0616; t = 1,7595). These findings are in accordance with those of Gupta and Newberry (1997) and Richardson and Lanis (2007).
Finally, regarding the most ambitious hypothesis formulated, due to the lack previous empiric analyzes performed on the matter on the extant literature, the results show that companies in which at least 50% of the share capital is held by a non-Portuguese entity or person tend to display a smaller ETR. The results obtained regarding the variable CapOri, a dummy variable equaling 1 if at least 50% of a company’s shares are held by a non-Portuguese entity or person and 0 if not, show that this variable has a negative and significant effect on both ETR1 (β = 0,0311; t = 1,8631) and ETR2 (β = 0,0621; t = -1,8031). These findings back the ones from Egger et al. (2010b), in which a significant difference between foreign and domestic companies’ ETR is found. Moreover, as the companies included in the model are all based in Portugal, a developed country, the results obtained are in line with the argued by the author, on which foreign companies located in developed countries tend to show lower ETR when comparing to domestically owned companies.
Globally, the results obtained are satisfactory, corroborating the hypothesis formulated, which in their turn, were based on the extant literature. Additionally, the adjusted R-squared of both regressions performed is considerably high, at approximately 60,97% for ETR1 and 46,25% for ETR2 and the value for prob F-statistic is 0.000, showing that the independent variables are jointly significant.
It is fair to say that a company’s main financial characteristics have a significant impact on its ETR.
22
7. Conclusions
Taxes are increasingly more at center of both taxpayers’ and the State’s concerns. Effective tax rates and, particularly, corporate income effective tax rate is an undoubtedly central matter on most corporate investments and decisions. In parallel, taxes represent the main source of income for State’s Budgets on most developed countries. In this framework, by addressing the Corporate Income Effective Tax Rate’s determinants using extensive empirical data, this paper constitutes an important contribution to the existing literature on the matter.
So that the ETR determinants were estimated, a sample of 38.371 companies based in Portugal, comprising 331.596 observations over the period from 2008 to 2016 was structured in data panel. ETR was measured through two different variables, differenced only by the denominator, as the first results from the quotient between the tax expenditure and the pre-tax income, and on the second, operational cash flow substitutes the latter. As both variables, profitability and size, have a positive impact on ETR, Richardson and Lanis (2007), Minick and Noga (2010) and Armstrong et al. (2012) findings were confirmed, as were the political cost theory defended by Zimmerman (1983), respectively. Additionally, the so-called tax shield was confirmed by the regressions performed, as more leveraged companies show a lower ETR. Concurrently, companies relatively more fixed assets intensive and less inventory intensity showed lower ETR, as the depreciation and amortization costs tend to be deductible for taxable profit computation purposes and represent a significant part of a company’s expenditure, which is in line with the findings of Gupta and Newberry, (1997). Finally, the tests performed show that companies whose share capital is owned by foreign entities or individuals have a lower ETR. Given that Portugal is a developed country this finding is in line with the one from Egger et al. (2010b), that stated that, contrary to what happened in developing countries, foreign held companies based in developed countries registered lower ETR.
This paper contributes significantly to the extant literature related to ETR. First, due to the fact that the empirical studies performed regarding ETR determinants are often focused on public USA-based companies. Contrarily, this paper uses all the available data regarding any kind of company based in Portugal, making it as the most extensive empirical analyzes found regarding Portuguese-based companies. Additionally, most studies regarding ETR and/or tax avoidance focus on a shorter analyzes period. Contrarily, this paper uses a 9
23
year analyses period. Finally, this paper innovates by successfully testing capital origin as an additional ETR determinant, which had never directly performed. The results obtained by this investigation shall be useful for political planners, as taxes represent the main source of income for its political programs and measures, corporate managers and directors, as taxes represent an additional and final cost which might be optimized or mitigated, and to other tax related investigators. Notwithstanding the above described contributions of this paper results, the investigation had some limitations that might be diminished with further investigation. Firstly, this paper uses a yearly measure of ETR, it would be interesting to redo this analysis with long-run ETR measures as defended by Dyreng et al. (2008). Moreover, it could be interesting to include in this analyzes corporate governance variables in order to ascertain its importance on ETR. Finally, it could also be interesting to associate corporate ETR with tax avoidance activities measures in order to associate the two phenomena.
24
8. References
Armstrong, C.S., Blouin, J. L., and Larcker, D. F. (2012), "The incentives for tax planning", Journal of Accounting and Economics, 53: 391-411.
Baltagi, Badi H., (2003), Econometric Analysis of Panel Data, Fifth edition, Wiley.
Chen, S., Chen, X., Cheng, Q., and Shevlin, T. (2010), "Are family firms more tax aggressive than non-family firms?", Journal of Financial Economics, 95: 41-61.
Desai, M. and Dharmapala, D. (2009), “Corporate tax avoidance and firm value”, The Review of Economics and Statistics, 91 (3): 537-546.
Desai, M., and Dharmapala, D. (2006), "Corporate tax avoidance and high-powered incentives", Journal of Financial Economics, 79: 145-179.
Dyreng, S., Hanlon, M. and Maydew, E. (2008), “Long-run corporate tax avoidance”, The Accounting Review, 83 (1): 61-82.
Egger, P., Eggert, W. and Winner, H. (2010b). "Saving taxes through foreign plant ownerships", Journal of International Economics, Vol. 81, Nº 1, pp. 99-108.
Graham, J. R. (2003), "Taxes and Corporate Finance: A review", Review of Financial Studies, 16: 1075-1129.
Gupta, S., and Newberry, K. (1997), "Determinants of the Variability of Corporate Effective Tax Rates: Evidence from Longitudinal Data", Journal of Accounting and Public Policy, 16: 1-34.
Hanlon, M., and Heitzman, S. (2010), "A review of tax research", Journal of Accounting and Economics, 50: 127-178.
Huang, H., Wang, W. and Zhou, J. (2010), “The Effect of Shareholder Rights and Insider Ownership on Earnings Management”, Abacus, Forthcoming.
International Reporting Standards Board (1996) IAS 12: Income Taxes
[Online]. Available at:
http://ec.europa.eu/internal_market/accounting/docs/consolidated/ias12_en.pdf (Accessed July 2018).
Kraft, A. (2014), "What really affects German firms' effective tax rate?", International Journal of Financial Research, 5(3).
25
Lanis, R., and Richardson, G. (2011), “The effect of board of directors composition on corporate tax aggressiveness”, Journal of Accounting and Public Policy, 30: 50-70.
Manzon, G., and Plesko, G. (2002), "The Relation between Financial and Tax Reporting Measures of Income", Tax Law Review, forthcoming.
Markle, K. and Shackelford, D. (2009). "Do multinationals or domestic firms face higher effective tax rates?", NBER working paper, Nº 15091, National Bureau of Economic Research.
Markle, K. and Shackelford, D. (2012). "Cross-country comparisons of corporate income taxes", National Tax Journal, Vol. 65, Nº 3, pp. 493-528.
Minnick, K. and Noga, T. (2010), “Do corporate governance characteristics influence tax management?”, Journal of Corporate Finance, 16 (5): 703-718.
Rego, S. O. (2003), "Tax-avoidance Activities of U.S. Multinational Corporations", Contemporary Accounting Research, 20: 805-833.
Richardson, G. and Lanis, R. (2007), "Determinants of the Variability in Corporate Effective Tax Rates and Tax Reform: Evidence from Australia", Journal of Accounting and Public Policy, 26: 689-704.
Robinson, J. R., Sikes, S. A., and Weaver, C.D. (2010), "The impact of evaluating the tax function as a profit center on effective tax rates", The Accounting Review, 85 (3): 1035- 1064.
Shackelford, D. and Slemrod, J. (1998). "The revenue consequences of using formula apportionment to calculate U.S. and foreign-source income: A firm-level analysis", International Tax and Public Finance, Vol. 5, Nº 1, pp. 41-59.
Vieira, A. (2013), “Corporate Governance and Taxes”, Dissertation, School of Economics and Management, University of Porto.
Zimmerman, J. L. (1983), "Taxes and Firm Size", Journal of Accounting and Economics, 5: 119-149.
F A C U LD A D E D E E C O N O M IA