A Work Project, presented as part of the requirements for the Award of a Masters Degree in Finance from the NOVA – School of Business and Economics
Empirical evidence on the difference between the effective and the statutory tax rates
for listed groups in Germany
Andreas Felix Jan #778
A project carried out in Finance and Accounting Area, with the supervision of: Professor Leonor Ferreira
1 Abstract
The difference between the statutory and effective tax rate for listed groups is a complex variable influenced by a variety of factors. This paper aims to analyze whether this difference exists for listed groups in the German market and tests which factors have an impact on it. Thus the sample consists of 130 corporations listed in the three major German stock indices. The findings suggest that the companies that pay less than the statutory rate clearly outweigh the ones that pay more, and that the income earned from associated companies has a significant impact on this difference.
2 1. Introduction
“This could explain why we do not know of any German companies with comparable tax
arrangements” (Handelsblatt, 2013, September 30th) wrote the German Minister of Finance,
Wolfgang Schäuble, to his US colleague Timothy Geithner. With this statement he referred to the German tax system which, according to him, makes it much more complicated to shift taxable income from Germany to low tax countries, like it was the case in America in his opinion. Thus, the main motivation behind this working paper is to find evidence to not reject this bold statement by the German Minister of Finance in order to know if German groups do actually pay their share of taxes, required by the state, and if this is not the case, analyze possible deviations.
Corporate tax avoidance is receiving more and more attention recently. This can be observed for instance by the huge outcry in the media regarding tax inversions by US companies. According to the Financial Times there have been 13 tax-driven takeover deals announced since the beginning of 2013 with a combined value of US$ 178 billion (Financial Times, 2014, September 14th). In Germany however, there has been little attention paid to the corporate side of tax avoidance, and much more on mostly prominent individuals instead, such as the famous case of Bayern Munich football official Ulrich Hoeness, who was sentenced to jail for three and a half years for substantial tax evasion (Handelsblatt, 2014, March 13th). A reason for this lack of focus on tax issues regarding corporations could be that tax evasion by individuals is much easier to understand for the broad public, in comparison to much more complicated group taxation issues.
3
other hand, tax avoidance is, as long as it is not practiced at extreme or illegal levels, seen as value maximizing, since it transfers part of the wealth from the government to the shareholders. This has, for instance, been displayed by the studies of Lee et al. (2013), who show that certain forms of tax avoidance, as long as they are not too aggressive, have a positive impact on the cost of equity since they lower them. Shevlin et al. (2013) contribute to this debate by showing that tax avoidance can lead to higher costs of public debt.1 Regulators, to name another party involved, have positive incentives to set the barriers for tax avoidance as well as tax evasion, as high as possible of course, in order to fulfill their obligations towards their employer, the state.
Regardless of this question of conflicts of interest between the different parties involved in
a country’s tax system, the issue this paper addresses is not about the effects of tax
avoidance themselves, but how persistent it is actually among German groups. To this end, information from the annual reports of German groups in the period of 2008-2013 is gathered. Subsequently a comparison between the tax rate imposed by the government and the actual taxes paid follows. In a second step the results are analyzed towards possible reasons, such as a high debt ratio, high ratio of dividends earned by associated companies, and possible advantages for certain industries, namely companies in the technology sector. The reason the technology sector is chosen is that there seems to be the perception in German public that it is especially easy for technology companies to shift their earnings to other countries by using licensing models.2
1
Note however, that the findings of Lee et al. (2013) and Shevlin et al. (2013) do not necessarily contradict each other that much, since Lee et al. (2013) show the lower cost of equity of to be a result of a not too aggressive tax avoidance, whereas as the higher costs of debt shown by Shevlin et al. (2013) are for companies where “the probability of a tax audit is high”. Thus they probably engaged in more aggressive forms of tax avoidance. Nonetheless, the impact of tax policy on the cost of capital shall not be further discussed.
2
4
Thus this paper contributes to the existing literature in the following ways. First, it provides an insight in the world of German corporate tax avoidance, by showing to which extent the individual groups in Germany would be subject to taxation by law and how much they effectively pay. Second, it shows which factors do actually have a significant impact on this difference, and thus rejecting certain assumptions often made in this context.
Hence the remainder of this paper proceeds as follows. Section 2 defines the key concepts and provides insight on the German tax system. After the overview prior empirical literature on the matter is summarized in Section 3. Section 4 describes data on the current situation of taxes for German corporations and outlines the Research Questions and the research methodology to answer them. Section 5 presents the results and suggests how to interpret the results on the example of individual cases. Finally, Section 6 concludes with main contributions of the work project, its limitations and suggestions for future research.
2. Key concepts and regulatory framework
2.1. Tax avoidance versus tax evasion
From an economist’s perspective, the difference between tax avoidance and tax evasion is marginal to practically non-existent –both aim at reducing the taxpayer’s burden (Kirchler, Maciejovsky and Schneider, 2001). For the purpose of this paper however, it is important to distinguish between these different concepts.
Slemrod and Yitzhaki (2002) point out that the original distinction between avoidance and evasion comes from Oliver Wendell Holmes who cites the verdict between Bullen v. Wisconsin:
“When the law draws a line, a case is on one side of it or the other, and if on the
5
Hence, the criterion of distinction here is illegality. Another definition comes from Kay (1980) who concludes that evasion deals with misrepresenting the nature of the transaction, whereas avoidance is concerned with presenting the actual facts but arranging them in such a way that the tax treatment differs from that intended by the relevant legislation.3
To come back to the statement at the beginning of this paper, the question to be analyzed is
whether German companies make use of certain loopholes or “arrangements” as Mr.
Schäuble calls them, in order to avoid paying taxes. As a result the analysis will focus on tax avoidance defined as the difference between effective and marginal tax rate and not on tax evasion.
2.2. Consolidated versus individual accounts
Given that the purpose of the paper is to analyze listed groups that present consolidated accounts it is important to highlight the difference between consolidated and individual accounting as a basis for taxation and the effect of bilateral treaties/agreements regarding double taxation on these.
Consolidated accounting consists of combining the financial statements of the parent company and its subsidiaries as well as associated companies and other participations in order to present an aggregated look on the financial position of the entire group (Hove, 2006). Taxation on the other side is based on individual accounts, unless the group opts for paying on the group basis for which certain requirements need to be fulfilled (see Section 2.4.2 for Germany). Since this is a right of choice for every single subsidiary, the consolidated annual reports are likely to mingle taxes paid on a group basis and taxes paid
3
6
on an individual basis.4 Hence when analyzing the figures one always need to be aware that one is looking at aggregate accounts from numerous companies.
When considering foreign participations, the question is whether the company’s home country imposes a system of worldwide taxation which leads to the risk of double taxation, or if foreign-source income is exempted from domestic taxation (Huizinga/Voget, 2009). The reason is that. in the second case, companies have the possibility to shift their earnings abroad. This question is however very dependent on each country’s tax regulation, and thus, will be answered for the part of Germany in the chapter 2.4.2. For domestic participations on the other side this question is of less importance off course, given that these participations are already subject to the tax system in Germany.
2.3. Marginal effective and statutory tax rates
For the sake of this paper the interest lies in finding the difference between the statutory tax rate, as in the percentage of income that the regulatory system wants the company to pay as taxes, and the effective tax rate as in what the company really pays. But what does this mean?
Graham (1996) for instance, does not make this separation and defines the marginal tax rate as“…the present value of current and expected future taxes paid on an additional dollar of
income earned today.”[Graham (1996), p. 44]. This definition comes close to what can be
seen as an effective tax rate. Fullerton (1983) concretizes this further by saying that the effective tax rate is the wedge that separates the pre-tax return on an investment from the post-tax return to the saver.
4
7
In order to provide a basis for the analysis in this paper, this definition by Fullerton (1983) is adapted. Hence the pre-tax profits in the annual reports are taken and compared to the ones post-tax.
The second important definition to make is the one of the statutory tax rate. However, given that this is the tax rate intended by the regulator, it is very country-specific. Hence a definition of the statutory tax rate is given in the following chapter, for the German system.
2.4. Legal framework in Germany
2.4.1 Business taxation
From a normative perspective the question is why people actually do obey the law. Great work has been delivered on this question by the articles of Tyler (2006) and Parisi (2004). This social perspective extends however the scope of this paper, so that the following paragraph provides an overview on the literature that comprises the law.
The main two taxes corporations pay, the Körperschaftssteuer (income corporate tax) and the Gewerbesteuer (trade tax), are set in two different tax codes, namely the Körperschaftssteuergesetz (income corporate tax law) and the Gewerbesteuergesetz (trade tax law). The foundation for these two codes is then the so-called Abgabenordnung (fiscal code of Germany), which can be seen as the constitution for German tax codes. This is stated in § 1-§§1 Fiscal code of Germany, where it says that this law is applicable for all taxes that are regulated by the German or the European Union authorities.5 Another important source of literature is the OECD model convention with respect to taxes on income and capital.6 This classical model convention sets out guidelines between two states
5
Of course these tax codes are entangled with a vast amount of other tax codes, as well as other legal codes, such as the German civil code.
8
in order to help them treat the issues of taxation between two countries (OECD-MA Chapter V).
As Kraft/Kraft (2009) explain, the first tax for corporations is the income corporate tax. As a legally independent entity, this is the tax that a corporation has to pay on its income. Surprisingly simple, the tax rate is here assessed at 15 percent of the profit in the year the profit has been earned. In addition to this tax all German individuals and corporations – as long as they exceed certain thresholds – are subject to the Solidaritätszuschlag, which amounts to another 5.5 percent on the amount of the income corporate tax.7
Given that the second tax, the trade tax, is being received by the communities the corporation operates in, the calculation is more difficult. There is principally a basis percentage of 3.5 percent which is then combined with a certain multiplier over which the community decides itself. The legal minimum for this multiplier is 200 percent8, but there is no upper limit, which enhances some sort of competition between the communities. Among most cities though, the multipliers vary in the range of 300-490 percent. Thus the trade tax typically varies between 10.5 and 17.15 percent and the whole tax burden between 26 and 33 percent.9(Kraft/Kraft, 2009).
Additionally both of these taxes are increased due to certain non-deductibility rules of interests paid for debt, which lead to interest add-backs. The Income corporate tax law sets an interest barrier which states that interest expense exceeding interest income is just 30 percent deductible for interest expenses exceeding a threshold of €3 million (Income corporate tax law, §8a). As for the trade tax the interest expense is just 75 percent
7The “Solidaritätszuschlag”, which means literally solidarity surcharge, was initially brought up in order to fund the reconstruction of Eastern Germany. It is however a fixed part of the German tax system now and shall not be further discussed here.
8
Thus 200 is multiplied with 3.5percent which leads to a legal minimum of trade tax of 7percent. 9
9
deductible if certain thresholds are exceeded, also for other figures than interest, such as rent (Trade law, §8 Number 1a).10
2.4.2 Taxation for groups in Germany
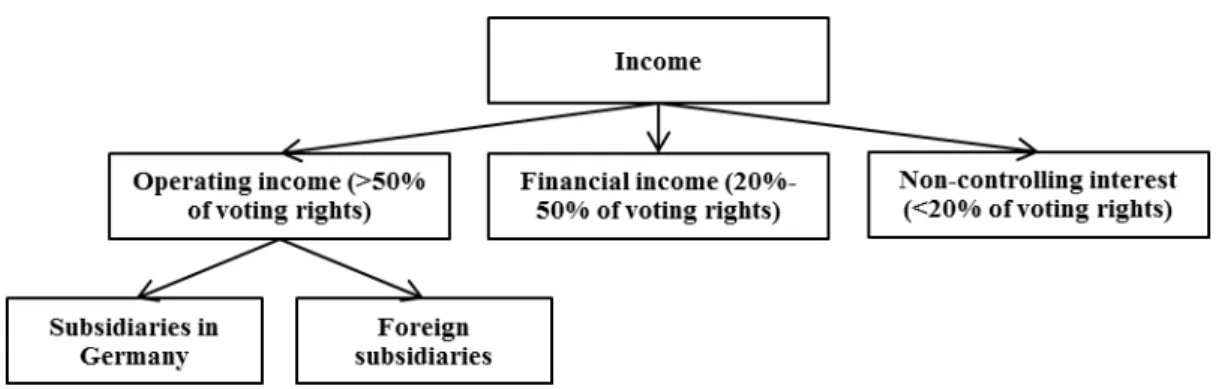
As Figure 1 shows there are three different types of participation according to the level of control: Operating income, which includes more than 50 percent of the voting rights in the subsidiary and is consolidated, financial income which includes voting rights between 20 and 50 percent in the associated company and is not consolidated, and last but not least income of non-controlling interest.11 This is important for tax purposes as the following explains.
Figure 1 – Income categories according to level of control
Parent companies in Germany can opt for paying taxes on a group basis for its German subsidiaries, if the subsidiary is contractually obliged to transfer all profits to the mother and if the mother company has more than 50 percent of the voting rights in the subsidiary (§14 Income corporate tax law). Given that the annual reports used as a basis for the analysis are all consolidated income statements and IFRS 10 has a similar definition for
10
This might impose a small limitation since it is not possible to calculate the impact of debt on the statutory tax rate because some figures needed are not published.
11
10
control12 the taxes paid by such subsidiaries, whether in a group basis or not, are always included in the consolidated income statement. Thus for the analysis the question of group taxation makes no difference and we can conclude that profits from subsidiaries in Germany are never subject to double-taxation.13
In the case of foreign subsidiaries the foundation for taxation and for the double taxation agreements in general, is built on the “OECD Model for Tax Convention on Income and on
Capital”. Principally it says that if the mother company has business premises in another
country in order to conduct its operations (OECD-MA Art. 7, § 1, Sentence 1) these profits earned by the business premises in the foreign country are primarily subject to the taxes in this country. Thus the foreign income is as well exempted from double taxation.
Income from associated companies (IAS 28) that are part of the financial income shown in the income statement are treated differently however. Here the company that holds the participation receives already taxed dividends from a company where it holds a minimum of 20 percent of voting rights but does not control it (IAS28(2011).5).14 Hence we do not know how much tax has been paid by the associated company. For companies that receive dividends the German corporation law states that they are exempt from taxation and thus usually do not lower the effective tax rate paid by the company (Income corporate tax law, § 8b, §§1).15
12
IFRS 10 adresses the power of the mother company to affect the returns by the subsidiary, which is usually also the case if it has 50percent in the voting stock.
13
It might be interesting to see however if the holding companies do have certain tax advantages by choosing to opt for paying taxes on a group base. For this it would be needed to compare the individual accounts of the mother company with the consolidated group accounts. This goes beyond the scope of this paper however.
14
It is stated in IAS 28 that a mother company can also have control over another company in case it has less than 50 percent of voting stock. In this case the income is treated as operating income.
15
11 3. Empirical literature review
Most literature focuses on the question of how companies use their tax accounts to conduct earnings management – the use of accounting techniques in order to brighten the
company’s results (Graham et al., 2011). On the question if corporations actually do pay
the percentage intended by regulators on their pre-tax profits in general there has been done less research however and this is especially true for the German market. Nevertheless, the aim of the following Section is to summarize work conducted on this area to date.
One important study on this matter comes from Graham and Tucker (2006). Their analysis revolves around the statement that many firms seem to be under-levered, regarding the potential benefits in terms of tax savings that would result in case a higher leverage was approached. Graham and Tucker (2006) explain this however, by showing that for many companies the engagement in tax sheltering, i.e. tax avoidance, results in tax deductions three times as large as interest deductions (tax shields) for comparable companies. To exemplify this statement they analyze Compaq Computer Corporation and show that Compaq used cross-border dividend capture and transfer pricing in order to produce a minimum of US $115 million in annual tax deductions in the years of 1991 and 1992. These studies receive further support by various papers that examine companies in the US market with financial statement income that is substantially higher than the income reported to tax authorities (Murray, 2002; Gross, 2003; Drucker 2006). Thus, they support the findings of Graham and Tucker (2006) by proving that the incentives for tax avoidance or sheltering still seem to be high. Further backing comes from Frank et al. (2008) who take these studies one step further by analyzing the question of whether US companies with
12
aggressive financial reporting habits tend to engage in aggressive tax reporting as well. Aggressive financial reporting is then defined as an upward earnings management whereas aggressive tax reporting is defined as downward manipulation (legally or not) of taxable income. Their results suggest a strong correlation between the two.
To sum up, prior literature has shown especially for the American market that there exists a substantial degree of tax avoidance in the corporate sector. A comprehensive explanation on how this avoidance is conducted comes from the already cited Graham and Tucker (2009) who give a qualitative explanation based on a sample of 44 corporations for the US market. For the German market however, there has been less research done. One interesting study is that of Zinn and Spengel (2012) who had access to a dataset of actual tax returns rather than just estimated taxable income, for 135 companies. They find a considerable divergence between corporate taxable income and annual net income reported to shareholders. However, their analysis just focuses on the year of 2009, and thus is imposed to certain limits, since the time frame is quite short. Hence the following intends to provide some additional insights here, by including more years and therefore providing a bigger and more recent dataset.
4. Methodology and sample
4.1. Sample
13
the SDAX, which are categorized by market capitalization of the companies they include.16 This amounts to a total initial sample of 130 companies from different industries, although it is important to mention that MDAX and SDAX do not include companies in the technology industries. The reason for choosing this sample is that these are listed companies. As a result the foundation of the analyzed is the most relevant, and given that they the reports are all audited, also the most trustworthy.
From all of these 130 companies the consolidated the data for the analysis, hence EBIT, EBT, taxes incurred, dividends earned from associated companies, and debt ratio, was hand collected through the investor relations section of each company’s website. The analysis covers a period of six years, from 2008 to 2013, given that the annual reports for 2014 are not yet available. The reason for this choice is that in 2008 there was a reformation of the German corporate law, which in substance intended to change certain rights of choice as well as restraints, regarding in particular the formation of hidden assets (Bilanzrechtsmodernisierungsgesetz-Referentenentwurf, 2007).17
To sum up, the sample comprises all German industries as well as different classes in terms of size, with companies having a market capitalization as low as €148.5 thousand such as Villeroy and Boch up to companies having a market capitalization as high as €84.3 billion such as Bayer.18 Also in terms of leverage the sample comprises a wide variety ranging from a debt ratio of 23.58 % (Fielmann in 2010) up to 98.65 % (Deutsche Börse in 2011). This variety also accounts for the industries included in the sample which do not have a specific focus and include the automotive, pharmaceutical and construction industries, to
16
Thus the DAX includes the 30 largest and most actively traded corporations in the prime standard segment. It is followed by the MDAX which comprises the 50 subsequent companies in terms of market capitalization. Lastly there follow another 50 companies in the SDAX (Deutsche Börse, 2014).
17
According to Sassen et al. (2008) the German law had in an international comparison rather unusual laws regarding the formation of hidden assets.
18
14
name just a few. Last but not least, the sample also includes all different types of dividends earned from associated companies since it comprises losses and profits, and companies that earn no dividends at all. Therefore it should provide a representative overview of the German corporate landscape (see Appendix 10 for the raw data).
4.2. So do they correspond or not?
4.2.1 Obstacles
As it was stated at the beginning, the aim of this paper is to answer the question of whether the effective tax rate for groups in Germany corresponds to the statutory tax rate intended by the regulators. The basis for the statutory rate has already been established in Section 2.3. However the comparison with the effective tax rate is subject to certain obstacles. First it has already been shown, that there does not exist one statutory rate for all German companies, due to the competitive tax system among the communities in which they are embedded. Thus the range goes from approximately from 25 to 33 percent. As a result the community in which a company is located needs to be taken into consideration.
A second problem consists of how to treat for tax losses carried forward produced by companies, since they can be deducted from future earnings (Income corporate tax law, § 10d). Thus they skew the sample since the resulting “tax rate” cannot be compared with the rigid percentage of how much a company should pay according to the law. In order to avoid this problem the companies that reported losses within one or more of the last five years, were excluded from the final sample.19
19
15
In addition it is necessary to clarify which values are actually to be compared to build a first foundation for further analysis. As it was explained in 4.1, the final sample includes the annual reports of 130 German corporations from 2008-2013. When calculating the effective tax rates by the definition made in 2.3, there are principally two possibilities regarding the average: first, to compute the arithmetic average of the effective tax rates that are expressed in percentage for each of the five year; second, to compute all taxes paid over five years as percentage of the sum of all earnings for five years. Although the former method might be more intuitive, it builds the average for percentage numbers with different basis. Therefore, the resulting figures are skewed since they do not account for the appropriate weight.20 Hence the second method is applied.
Last but not least there remains the questions of the extent to which the dividends earned from associated companies have been taxed and where, as it is explained in Section 2.4.2. Given that this information is not published in the annual reports there is no possibility of overcoming this obstacle. However, one can draw the conclusion that a high proportion of dividends earned should in theory lead to a lower effective tax rate in the consolidated income statement, and thus serve as a basis for further analysis.
4.2.2 Correspondence of statutory and effective tax rate
As Chart 1 shows, for the DAX there are 19 companies that are left, after omitting those that produced losses within the last five years.
20
16
Chart 1 – Correspondence on an individual basis DAX
Out of these 19 companies, eleven have a lower effective tax rates than the statutory one. Since among the other eight there are some that actually pay substantially more than they would be required to, this does not give a sufficient overview on the big picture. Hence Chart 2 provides deeper insight on the difference in terms of impact on a cumulated basis, since it sums up the differences between statutory and effective tax rate. Chart 2 shows the effective tax rate minus the statutory one for each of the 19 companies.
17
Beneath, at a value of -56.25 % it shows the sum of these values, indicating that the companies that pay less than the statutory rate, clearly outweigh the ones that pay more. The taxes saved in total by the companies in the DAX amount to 15,240 billion €.21
So is there a difference for smaller companies? Charts 3 and 4 provide some information on the MDAX and SDAX, using again a cumulated basis of the difference between effective and statutory tax rate
.
Chart 3 – Correspondence on a cumulated basis MDAX
Chart 4 – Correspondence on a cumulated basis SDAX
21
18
As one can see, also for the two samples of smaller companies in terms of market capitalization there is no difference, showing that there is no effect in terms of size.22 In euro terms the taxes saved by the companies of the MDAX amount to €166.46 million and in the SDAX to €100.45 million.23
4.3. Research Questions
Now that the correspondence between the statutory and the effective tax rate has been examined, possible reasons for the deviations are analyzed. Hence, the following tests the impact of certain variables on the dependent variable α:
α = effective – statutory tax rate [1]
α serves as the proxy for tax avoidance (see Section 2.1).24
When it comes to the factors that influence the effective tax rate one of the first questions to ask regards the leverage a group takes on given the partial deductibility of interests paid. Thus the influence of leverage in form of the variable of a debt ratio (=defined as total debt/total assets) is tested. Hence the Research Question (RQ) is the following:
RQ 1: Does the Debt ratio impact α?
𝐻0: 𝛽𝐷𝑒𝑏𝑡 𝑟𝑎𝑡𝑖𝑜 = 0 𝐻1: 𝛽𝐷𝑒𝑏𝑡 𝑟𝑎𝑡𝑖𝑜 ≠ 0
Regression: 𝛼 = 𝑎 + 𝛽𝐷𝑒𝑏𝑡 𝑟𝑎𝑡𝑖𝑜 𝑥1 [2] With: 𝛽𝐷𝑒𝑏𝑡 𝑟𝑎𝑡𝑖𝑜 = debt ratio coefficient
𝑥1= total debt/total assets
In line with the RQ 1, a positive difference between EBIT and EBT, meaning financial expenses exceed financial income, should lead to a lower tax rate. Research Question 2 intends to measure this impact by isolating this difference from the dividends earned:
RQ 2: Does I impact α?
22
Interestingly there seems to be no effect in terms of evolution (Appendix 9). 23
These figures include the taxes paid above the average. 24
19
𝐻0: 𝛽𝐼 = 0 𝐻1: 𝛽𝐼 ≠ 0
Regression: 𝛼 = 𝑎 + 𝛽𝐼 𝑥2 [3]
With: 𝛽𝐼 = Interest coefficient
𝑥2= Isolated interest
As it has already been discussed, dividends earned from another entity are of importance when it comes to the analysis of tax payments, since these profits have already been subject to taxes (see Section 2.4.2). Thus the higher dividend earned are as a percentage of total earnings before taxes, the lower the effective tax rate should be. Subsequently the third Research Question is:
RQ 3: Do dividends earned from associated companies impact α?
𝐻0: 𝛽𝐷𝑖𝑣𝑖𝑑𝑒𝑛𝑑𝑠 = 0 𝐻1: 𝛽𝐷𝑖𝑣𝑖𝑑𝑒𝑛𝑑𝑠 ≠ 0
Regression: 𝛼 = 𝑎 + 𝛽𝐷𝑖𝑣𝑖𝑑𝑒𝑛𝑑𝑠 𝑥3 [4]
With: 𝛽𝐷𝑖𝑣𝑖𝑑𝑒𝑛𝑑𝑠 = dividend coefficient
𝑥3 = income from associated companies/EBT
Similarly to the analysis of the debt ratio the variable here is a ratio between the dividends earned from participations between 20 and 50 percent (and no significant control) and the pre-tax profits.25
Last but not least, it is of interest, whether certain industries have an advantage when it comes to lowering the tax rate. This is especially interesting for the IT industry, since it is a knowledge-based industry, which makes it hard to identify where the costs actually occurred. Thus the question is:
RQ 4: Does the IT industry have a lower effective tax rate than the average of the whole
sample?
Ω > 𝜀
Ω = effective tax rate for the DAX, MDAX and SDAX
25
20
ε = effective tax rate in the IT industry
In order to answer RQ 4, the sample will be compared to a new indices of 30 companies (TecDax) not included so far, that come specifically from the technology sector.26
5. Results
5.1. Debt ratio and α (Research Question 1)
As Table 1 (Appendix 5) indicates the leverage a corporation takes on just explains a very small part of the deviations between effective and statutory tax rate, as can be seen in the low R Square of 0.57%. Also the influence is with a p-value of 0.11 not even significant at the 10% confidence interval. All in all, it can be said that the Debt ratio variable, defined as total debt divided by total assets does not explain the difference between the effective and the statutory tax rates.
These findings are interesting given the high emphasis put on debt when it comes to taxation. In order to draw a conclusion here, Research Question 2 needs to be analyzed first however, to see if the isolated interest is just a more accurate variable when it comes to measuring the impact of how much debt a company takes on.
5.2. Isolated interest and α (Research Question 2)
Table 2 (Appendix 6) shows the regression on the in Section 4.3 defined variable 𝑥2. With an R Square of 1.1% the validity of the model is again very low. Although the significance level is now reached, being significant at the 5% confidence interval with a P-value of 0.03, the algebraic sign before the coefficient (1.67%) is positive. This means that the higher the interest expenses are, the more the effective exceeds the statutory tax rate. This might seem surprising at first glance, but corresponds however to the described legal framework in
26
21
2.4.1 because the higher the interest paid are, the higher the effective compared to the statutory tax rate is, since the statutory rate does not incorporate the effect of interest add-backs here. This is also consistent with the findings of Zinn and Spengler (2012) who identify interest add-backs as a major source of divergence between accounting and taxable income.
For this work project however, the model confirms the findings of RQ 1 by saying that the interests paid (and thus indirectly the leverage) do not explain why the groups that effectively incur in less taxation clearly outweigh the ones that suffer more (Section 4.2.2).
5.3. Dividends earned and α (Research Question 3)
Table 4 (Appendix 8) shows that the coefficient for income from participations has with a value of -0.060 a negative impact. Hence an increase in the dividends earned by 1 % leads to a decrease of -0.06% in taxes. This effect is clearly significant even at the 1% confidence level. The R Square (2.27%) is still low, but higher than that for RQ 1 or 2. As a result one can conclude that the response caused by the variable is significant, but there are lots of other influences hidden in the intercept that explain the difference between the effective and the statutory tax rate.
When it comes to internal validity problem in time series is often that of autocorrelation, meaning that the assumption of zero covariance in the error terms over time is violated (Brooks, 2008). Given the Durbin-Watson (DW) test-statistic of 2.04,27 one can conclude, that autocorrelation is not the case, meaning that the residuals are uncorrelated. There is to say however that the DW test is usually used in time-series, which is not really the case in the sample at hand, given the focus of one variable for 130 companies over just five years.
27
DW = ∑𝑛𝑡=2(û𝑡−û𝑡−1)²
22
Interestingly, this seems to back the findings of Graham and Tucker (2006) discussed in Section 3, who found out that the impact of dividends on the tax burden is much more significant than the impact of leverage. Hence, this seems to hold also for the German market.
5.4. The technology industry in comparison - Ω versus ε (Research Question 4)
As chart 7 shows the companies in the TecDAX do actually pay on more on average than they would be required to by the law with Ω being lower than ε.
Chart 7 – Average between effective and statutory tax rate for different indices
This result is very surprising and contradicts the perception in the German public displayed in Section 1, showing that companies in the technology sector are a positive exception from the rule.
5.4. Discussion of the results
23
tax rate after all, whereas taxes received from foreign associated companies, are subject to the system there. Hence if the companies do pay fewer taxes in the countries where the associated companies are located, they manage to effectively lower their tax rate. This is however very difficult to analyze, because it depends how much value is actually created in the other country, and how much of the profit is being taxed there. Off course, most companies are reticent when it comes to providing detailed information on this, and where such information is available, as it is the case in BASF, who provides a very detailed overview on its taxation payments (BASF annual report 2013), then they usually have
nothing to hide, as BASF’s almost exact correspondence between marginal and effective
tax rate shows (α=0.004 percent) What can be done however is to compare companies with
a high difference in effective and marginal tax rate, and compare them with known cases of tax avoidance.
One taxation loophole that has been discovered by journalists in 2013 is to shift earnings from Germany to certain communities in Belgium such as Antwerp, where the marginal tax rate is very low, by charging fictitious interest on the equity provided to the companies. These fictitious interests are then tax deductible and lead effectively to a lower tax rate. Two companies that have been using this loophole are Volkswagen and Bayer (Spiegel 2013) – both of them who pay up to 10% less in taxes than they would be required to (see Chart 2). In the case of Volkswagen the share of dividends earned is with a range of 11.5 up to 55.6 percent also unusually high, which shows that the company is putting an effort into not displaying where a major share of its income comes from.
24 6. Conclusion
As was stated in the beginning of this paper, the purpose of this work project was to verify the statement by the German minister of finance, Mr. Schäuble, if German companies pay their required share of tax by the law, and analyze possible deviations.
From the final sample of the publicly listed German companies the following conclusions were drawn:
First, corporations when observed as a group in Germany do on average have a lower effective than statutory tax rate.
Second, in contradiction to the average, the technology sector does have a higher effective than statutory tax rate.
Third, unlike the debt ratio and the isolated interest, the impact of dividends earned is significant on the effective minus statutory tax rates’ explanation.
The major limitations to this work project were that tax payments are based on different tax legislation rooted in the German GAAP thus making the figures less comparable. A second limitation was the fact that the figures analyzed in the consolidated annual reports, just present an aggregated overview of numerous associated companies and subsidiaries.
25 7. References
[1]. Bergin Tom. 2013. “Das irische Model. Wie SAP Steuern spart.“ [online], available: http://www.n-tv.de/wirtschaft/Das-Geld-der-gruenen-Insel-Das-Steuersparmodell-von-SAP-article11456186.html
[2]. Bilanzrechtsmodernisierungsgesetz-Referententwurf. 2007. “Referentenentwurf eines
Gesetzes zur Modernisierung des Bilanzrechts.“ German Ministery of Law
[3]. Brooks, Chris. 2008. Introductory Econometrics for Finance. Cambride: Cambridge University Press.
[4]. Cobham, Alex. 2005. “Tax evasion, tax avoidance and development finance.” University of Oxford Working Paper 129.
[5]. Deusche Böse. 2014. “The index world: DAX Family”. [online], available:
http://deutsche-boerse.com/dbg/dispatch/en/kihr/dbg_nav/about_us/10_Deutsche_Boerse_Group/32_Br ands/05_DAX-family.
[6]. Drucker, Jesse. 2006. “Minding the gap: IRS looks closer to profit disparity.” The Wall Street Journal. November 27, C1.
[7]. Fama, Eugene, and Kenneth French. 1998. “Taxes, financing costs and firm value” Journal of Finance, Vol. 53: 819-843.
[8]. Financial Times. 2014. “Hopes of a bipartisan deal on US tax inversions fade.” [online], available: http://www.ft.com/intl/cms/s/0/b805c178-3bb9-11e4-885d-00144feabdc0.html#axzz3D4iaRvjv.
[9]. Frank, Mary Margaret, Luann J. Lynch, and Sonja Olhoft Rego.2009. Tax Reporting Aggressiveness and Its Relation to Aggressive Financial Reporting. Accounting Review, Vol. 84, No. 2.
[10]. Fullerton, Don. 1983. “Which effective tax rate?” National Buereau of economic research Working Paper 1123.
[11]. Graham, John R. 1996. "Debt and the marginal tax rate." Journal of Financial Economics 41.1: 41-73.
[12]. Graham, John R. 2009. Tax Shelters and Corporate Debt Policy. [online], available: http://taxblog.com/JGraham/tax-shelters-and-corporate-debt-policy/.
[13]. Graham, John R., and Alan L. Tucker. 2006. "Tax shelters and corporate debt policy."Journal of Financial Economics 81.3: 563-594.
[14]. Graham, John R., Jana S. Raedy, and Douglas A. Shackelford. 2012. "Research in accounting for income taxes." Journal of Accounting and Economics 53.1: 412-434. [15]. Gross, Daniel. 2003. “Higher profits, lower taxes. It’s not just Enron that’s been
dodging corporate income taxes.” (Posted February 14, on
http://slate.msn.com/id/2078581/).
[16]. Handelsblatt. 2013. Die Steuertricks von SAP, [online], available: http://www.handelsblatt.com/unternehmen/it-medien/ableger-in-irland-die-steuertricks-von-sap/8858772.html .
[17]. Handelsblatt (2014) Letzte Hoffnung Bundesgerichtshof, [online], available: http://www.handelsblatt.com/finanzen/recht-steuern/steuern/urteil-gegen-uli-hoeness-letzte-hoffnung-bundesgerichtshof/9613938.html.
26
[19]. Kay, J.A. .1980. "The anatomy of tax avoidance", in: Income Distribution: The Limits to Redistribution; Proceedings of the 31st Symposium of the Colston Research Society, University of Bristol.
[20]. Kirchler, Erich, Boris Maciejovsky, and Friedrich Schneider. 2001. “Everyday representations of tax avoidance, tax evasion, and tax flight: Do legal difference
matter?” Humboldt University of Berlin Discussion Paper 2001,43.
[21]. Kraft, Cornelia, Gerhard Kraft. 2009. Grundlagen der Unternehmensbesteuerung. Wiesbaden: GWV Fachverlage GmbH.
[22]. Lee, Kiat Bee Jimmy, Beng Wee Goh, Chee Yeow Lim and Terry Shevlin. 2013. “The
effect of corporate tax avoidance on the cost of equity.” Research collection school of
Accountancy. Available at: http://ink.library.smu.edu.sg/soa_research/1212/
[23]. Murray, Alan. 2002. “Narrowing tax gap should be priority of next congress.” The Wall Street Journal. October 8, A4.
[24]. Parisi, Francesco. 2004. "Positive, normative and functional schools in law and economics." European Journal of Law and Economics, 18.3: 259-272.
[25]. Sassen, Remmer, Patrick Velte, and Stefan Weber. 2008. "Bilanzrechtsmodernisierung: Wandel von einer "offenen" zu einer "stillen" Bilanzpolitik." Zeitschrift für das Gesamte Kreditwesen, Vol. N 61.6: 248.
[26]. Slemrod, Joel, and Shlomo Yitzhaki. 2002. “Tax avoidance, evasion, and
administration” in Handbook of Public Economics. Amsterdam: Elsevier (North Holland Publishing Co.).
[27]. Spiegel. 2013. Fiktive Zinsen: VW und BASF nutzen belgisches Steuerschlupfloch. [online], available: http://www.spiegel.de/wirtschaft/unternehmen/steuern-vw-basf-bayer-und-henkel-druecken-abgaben-in-belgien-a-900415.html.
[28]. Tyler, Tom R. 2006. Why people obey the law. Princeton: Princeton University Press. [29]. Zinn, Benedikt, and Christoph Spengel. 2012. “Book-tax conformity: Empirical
27 8. Appendices
Appendix 1: Company taxation in Germany
Appendix 2: Average of percentages
𝑎+𝑏 𝑐+𝑑 ≠
𝑎 𝑐+𝑏𝑑
2
Appendix 3: Listed companies in the DAX, MDAX, and SDAX
DAX MDAX SDAX
Adidas Aareal Bank Air Berlin
Allianz Airbus Group (former EADS) Alstria office REIT
BASF Aurubis Amadeus Fire
Bayer Axel Springer Balda
Beiersdorf BayWa Bauer
BMW Bilfinger Bertrandt
Commerzbank Brenntag Biotest
Continental Celesio C.A.T. Oil
Daimler Deutsche EuroShop Centrotec Sustainable Deutsche Bank Deutsche Wohnen CeWe Color
Deutsche Börse Dürr comdirect bank
Deutsche Lufthansa ElringKlinger CTS Eventim
Deutsche Post Fielmann Delticom
Deutsche Telekom Fraport Deutz AG
E.ON Fuchs Petrolub Deutsche Beteiligungs
Fresenius GAGFAH DIC Asset
Fresenius Medical Care GEA Group Gesco HeidelbergCement Gerresheimer GfK Henkel Gerry Weber International Grammer Infineon Technologies Gildemeister Grenkeleasing all Numbers in T€
300 350 400 420 490
EBT 100 100 100 100 100
Gewerbesteuer 10,5 12,25 14 14,7 17,15
Körperschaftssteuer 15 15 15 15 15
Solidaritätszuschlag 0,825 0,825 0,825 0,825 0,825
Earnings after Taxes 73,675 71,925 70,175 69,475 67,025
Burden of Taxation 26,325 28,075 29,825 30,525 32,975
28
K+S GSW Immobilien H&R WASAG
Lanxess Hannover Re Hamborner
Linde Hochtief HHLA
Merck Hugo Boss Hawesko Holding
Munich Re Kabel Deutschland Heidelberger Druckmaschinen
RWE Klöckner Highlight Communications
SAP Krones Hornbach Holding
Siemens KUKA Indus Holding
ThyssenKrupp LEG Immobilien Jungheinrich Volkswagen Group Leoni Koenig & Bauer
MAN KWS Saat
Metro MLP
MTU MVV Energie
Norma Group Patrizia Immobilien
ProSiebenSat.1 Media Praktiker
Puma Prime Office
Rational RTL Group
Rheinmetall SAF-Holland
Rhön-Klinikum Schaltbau
SGL Carbon SKW Stahl-Metallurgie Holding
Salzgitter Sixt
Sky Deutschland SMT Scharf
Stada Ströer Out-of-Home Media
Südzucker TAKKT
Symrise Tipp24
TAG Tom Tailor
Talanx Vossloh
TUI VTG
Wacker Chemie Wacker Neuson
Wincor Nixdorf Zooplus
Appendix 4: Listed companies in the TecDAX
Appendix 5 Table 1: Regression statistics for RQ 1 TecDAX
Aixtron Drillisch Nemetscheck SMA Solar Technology
BB Biotech Evotec Nordex Software AG
Bechtle Freenet O2 Stratec Biomedical Systems
Cancom AG Jenoptik Pfeiffer Vacuum United Internet Carl Zeiss Meditec Kontron PSI AG Wirecard CompuGroup Medical LPKF Laser & EQiagen XING Dialog Semiconductor MANZ QSC
29 Appendix 6 Table 2: Regression statistics for RQ 2
Appendix 7 Table 3: Regression statistics for multiple regression on RQ 1 & 2
Appendix 8 Table 4: Regression statistics for RQ 3
Regression statistics
Multiple R 0,07553379
R Square 0,00570535
Adjusted R Square 0,00337133
Standard error 12,1623461
Observations 428
ANOVA
df SS MS F F crit
Regression 1 361,58612 361,58612 2,44442679 0,11868549
Residue 426 63015,0544 147,922663
Total 427 63376,6405
Coefficients Std error t-Stat P-Value Lower 95% Upper 95%
Intercept 2,30791443 2,47678499 0,93181864 0,35195804 -2,5603261 7,17615492
X Variable 1 -0,056861 0,03636856 -1,5634663 0,11868549 -0,1283452 0,01462314
Regression statistics
Multiple R 0,106836638 R Square 0,011414067 Adjusted R Square 0,009093443 Standard error 12,12738097 Observations 428
ANOVA
df SS MS F F crit
Regression 1 723,3852304 723,3852304 4,918533072 0,027096929 Residue 426 62653,25528 147,0733692
Total 427 63376,64051
Coefficients Std error t-Stat P-Value Lower 95% Upper 95%
Intercept -1,962445801 0,629470086 -3,117615665 0,001946776 -3,199699647 -0,725191954 X Variable 1 0,016750316 0,007552752 2,217776606 0,027096929 0,001905018 0,031595615
Regression statistics
Multiple R 0,14093754
R Square 0,01986339
Adjusted R Square 0,01525098
Standard error 12,0896422
Observations 428
ANOVA
df SS MS F F crit
Regression 2 1258,87494 629,437472 4,30651237 0,01407359
Residue 425 62117,7656 146,159448
Total 427 63376,6405
Coefficients Std error t-Stat P-Value Lower 95% Upper 95%
Intercept 2,59994213 2,46479885 1,05482933 0,29210266 -2,2447715 7,44465575
X Variable 1 -0,0699291 0,03653387 -1,914089 0,05628008 -0,1417386 0,00188049
30 Appendix 9: Evolution
Appendix 10
Company Year EBIT EBT Taxes Effective
Tax Rate
Statutory Tax Rate
Diff. Dividends Debt
Ratio
figures in mio € if not marked as %
Aareal Bank 2013 165 198 62 31% 31% 0% 0 96%
Aareal Bank 2012 169 176 52 30% 31% -2% 0 96%
Aareal Bank 2011 144 185 52 28% 31% -3% 1 96%
Aareal Bank 2010 123 134 40 30% 31% -1% 5 97%
Aareal Bank 2009 133 87 20 23% 31% -8% 1 97%
Aareal Bank 2008 149 110 45 41% 31% 10% 7 97%
Adidas 2013 1202 1134 344 30% 27% 3% 102 53%
Adidas 2011 1011 927 257 28% 27% 1% 147 53%
Adidas 2012 994 851 327 38% 27% 11% 86 54%
continue
Regression statistics
Multiple R 0,15060257
R Square 0,02268113
Adjusted R Square 0,02038696
Standard error 12,0580741
Observations 428
ANOVA
df SS MS F F crit
Regression 1 1437,45408 1437,45408 9,88639785 0,00178158
Residue 426 61939,1864 145,397151
Total 427 63376,6405
Coefficients Std error t-Stat P-Value Lower 95% Upper 95%
Intercept -1,1340084 0,59165573 -1,9166693 0,05594868 -2,2969363 0,02891951
31
continued
Adidas 2010 894 806 238 30% 27% 3% 89 57%
Adidas 2009 508 358 113 32% 27% 5% 7 58%
Adidas 2008 1070 904 260 29% 27% 2% 5 64%
Allianz 2012 11259 8719 3161 36% 33% 3% -59 92%
Allianz 2010 8932 7173 1964 27% 33% -6% -102 93%
Allianz 2013 13014 9644 3300 34% 33% 1% -15 93%
Allianz 2011 9926 4846 2042 42% 33% 9% -35 93%
Allianz 2009 9737 5190 540 10% 33% -23% -232 93%
Allianz 2008 6978 5473 1287 24% 33% -9% 79 96%
Amadeus Fire AG 2012 20 20 7 34% 32% 2% 0,39 31%
Amadeus Fire AG 2011 22 23 7 32% 32% 0% -0,76 32%
Amadeus Fire AG 2010 19 19 6 31% 32% -1% -0,93 33%
Amadeus Fire AG 2009 16 16 5 31% 32% -1% -1,04 33%
Amadeus Fire AG 2013 23 23 7 31% 32% -1% -0,88 34%
Amadeus Fire AG 2008 15 16 6 36% 32% 4% -1,04 39%
Aurubis 2008 284 243 72 30% 32% -3% 0,708 86%
Aurubis 2012 586 515 153 30% 32% -3% 6 89%
Aurubis 2011 532 421 98 23% 32% -9% 706 90%
Axel Springer 2010 338 378 104 27% 30% -3% -8,2 57%
Axel Springer 2011 408 421 132 31% 30% 1% 9,5 60%
Axel Springer 2013 269 267 88 33% 30% 3% 25,7 60%
Axel Springer 2012 244 284 93 33% 30% 3% 5,9 61%
Axel Springer 2009 610 398 84 21% 30% -9% 212 61%
Axel Springer 2008 1089 688 117 17% 30% -13% 401 64%
BASF 2013 7723 6713 1540 23% 29% -6% 74 58%
BASF 2011 6742 8970 2367 26% 29% -3% 966 61%
BASF 2012 6742 5977 910 15% 29% -14% 75 62%
BASF 2010 7761 7373 2299 31% 29% 2% 137 64%
BASF 2008 6463 5976 2671 45% 29% 16% 74 65%
BASF 2009 3677 3079 1424 46% 29% 17% 112 66%
Bauer AG 2008 167 147 39 27% 28% -1% 3,12 66%
Bauer AG 2009 84 60 17 29% 28% 1% 3,54 68%
Bauer AG 2010 88 57 18 31% 28% 3% 1,44 69%
Bauer AG 2012 72 39 13 34% 28% 6% 10,30 70%
Bauer AG 2011 82 48 13 28% 28% 0% -0,69 71%
Bayer 2013 4934 4207 1021 24% 32% -8% -16 60%
Bayer 2009 3006 1870 511 27% 32% -5% -48 63%
Bayer 2010 2730 1721 411 24% 32% -9% -56 63%
Bayer 2011 4149 3363 891 26% 32% -6% -45 64%
Bayer 2012 3928 3176 723 23% 32% -10% -18 64%
Bayer 2008 3544 2356 636 27% 32% -5% -62 69%
Baywa AG 2009 102 75 16 21% 33% -12% 13,40 73%
Baywa AG 2010 109 87 20 23% 33% -10% 20,02 74%
32
continued
Baywa AG 2008 150 104 27 26% 33% -7% 11,58 75%
Baywa AG 2011 139 98 28 29% 33% -4% 12,04 78%
Baywa AG 2012 168 123 5 4% 33% -29% 18,56 81%
Baywa AG 2013 190 168 47 28% 33% -5% 32,11 82%
Beiersdorf 2012 698 713 259 36% 32% 4% 249 41%
Beiersdorf 2013 820 815 272 33% 32% 1% 441 41%
Beiersdorf 2009 587 583 203 35% 32% 3% 265 43%
Beiersdorf 2010 583 440 181 41% 32% 9% 270 43%
Beiersdorf 2011 431 553 227 41% 32% 9% 165 43%
Beiersdorf 2008 797 822 255 31% 32% -1% 237 45%
Bertrand AG 2013 81 80 23 29% 27% 1% -138,00 41%
Bertrand AG 2009 33 33 8 26% 27% -2% 35,00 43%
Bertrand AG 2010 44 44 13 29% 27% 2% 14,00 43%
Bertrand AG 2012 75 74 22 30% 27% 3% 38,00 43%
Bertrand AG 2011 60 60 18 30% 27% 3% 6,00 44%
Bertrand AG 2008 51 51 15 30% 27% 2% 89,00 54%
Bilfinger 2013 287 244 72 29% 31% -2% 32,5 67%
Bilfinger 2012 381 347 102 29% 31% -2% 31 70%
Bilfinger 2011 361 331 109 33% 31% 2% 28,7 77%
Bilfinger 2010 341 301 93 31% 31% 0% 22,1 77%
Bilfinger 2009 250 214 71 33% 31% 2% 17,3 81%
Bilfinger 2008 298 284 79 28% 31% -3% 15,1 83%
Biotest AG 2012 45 37 13 37% 29% 8% 1,00 46%
Biotest AG 2013 54 48 16 33% 29% 4% 1,00 48%
Biotest AG 2011 42 29 10 34% 29% 6% 0,54 49%
Biotest AG 2010 43 28 9 31% 29% 2% 0,30 52%
Biotest AG 2008 59 45 13 28% 29% -1% 0,00 58%
Biotest AG 2009 62 49 17 35% 29% 6% 0,30 58%
BMW 2013 7986 7913 2573 33% 33% 0% 398 74%
BMW 2012 8275 7803 2692 34% 33% 2% 271 77%
BMW 2011 8018 7383 2476 34% 33% 1% 162 78%
BMW 2010 5111 4853 1610 33% 33% 0% 98 79%
BMW 2008 921 351 21 6% 33% -27% 26 80%
BMW 2009 289 413 203 49% 33% 16% 36 80%
Brenntag 2013 556 495 156 32% 33% -1% 4,6 63%
Brenntag 2012 574 478 141 29% 33% -4% 3 66%
Brenntag 2010 409 232 85 37% 33% 4% 4,7 68%
Brenntag 2011 546 420 140 33% 33% 0% 4,2 69%
Celesio 2010 566 409 144 35% 31% 5% 6,9 70%
Celesio 2011 237 104 98 94% 31% 64% 4,3 71%
Celesio 2013 407 269 98 36% 31% 6% 11,5 72%
Celesio 2012 370 215 105 49% 31% 18% 8,1 73%
33
continued Centrotec
Sustainable AG 2013 36 31 7 23% 31% -8% 0,51 55%
Centrotec
Sustainable AG 2010 36 35 9 26% 31% -5% 4,29 60%
Centrotec
Sustainable AG 2009 29 13 8 59% 31% 28% -9,82 65%
Centrotec
Sustainable AG 2008 32 26 7 28% 31% -3% 2,20 66%
Cewe Stiftung &
CO KGaA 2008 12 11 3 24% 31% -7% -0,20 57%
Cewe Stiftung &
CO KGaA 2013 29 28 5 20% 31% -11% 0,16 58%
Cewe Stiftung &
CO KGaA 2010 28 26 12 44% 31% 14% -0,30 58%
Cewe Stiftung &
CO KGaA 2011 30 29 10 34% 31% 3% 0,02 58%
Cewe Stiftung &
CO KGaA 2012 29 27 7 27% 31% -4% -0,07 58%
Cewe Stiftung &
CO KGaA 2009 19 17 9 55% 31% 24% -0,26 58%
Comdirekt Bank
AG 2009 85 76 19 25% 27% -2% 0,00 95%
Comdirekt Bank
AG 2012 94 94 19 21% 27% -6% 0,00 95%
Comdirekt Bank
AG 2010 81 81 21 26% 27% -1% 0,00 95%
Comdirekt Bank
AG 2008 78 83 22 26% 27% -1% 0,00 96%
Comdirekt Bank
AG 2013 80 80 19 24% 27% -3% 0,00 96%
Continental 2013 3264 2459 450 18% 32% -14% 37,6 66%
Continental 2012 3186 2687 698 26% 32% -6% 63,4 68%
CTS Inventim AG
& CO KGaA 2009 71 71 23 33% 32% 1% 0,15 69%
CTS Inventim AG
& CO KGaA 2008 50 53 18 33% 32% 1% 0,22 70%
CTS Inventim AG
& CO KGaA 2013 111 105 35 34% 32% 2% -0,89 73%
CTS Inventim AG
& CO KGaA 2012 98 90 27 30% 32% -2% -1,92 75%
CTS Inventim AG
& CO KGaA 2011 72 67 21 31% 32% 0% 0,36 76%
CTS Inventim AG
& CO KGaA 2010 71 69 20 28% 32% -4% -0,48 78%
Daimler 2012 8820 8116 1286 16% 31% -15% 1198 73%
Daimler 2010 7274 6628 1954 29% 31% -1% -148 73%
Daimler 2011 8755 8449 2420 29% 31% -2% 273 73%
Daimler 2013 10815 10139 1419 14% 31% -17% 3345 75%
Daimler 2008 2730 2795 1091 39% 31% 9% -998 76%
Deusche Börse 2010 528 420 25 6% 26% -20% 12,2 98%
Deusche Börse 2008 1508 1469 419 28% 26% 3% 5,8 98%
Deusche Börse 2009 638 558 87 16% 26% -10% -4,8 98%
34
continued
Deusche Börse 2013 739 668 173 26% 26% 0% 9,3 98%
Deusche Börse 2012 969 837 167 20% 26% -6% -4,3 99%
Deusche Börse 2011 1152 1150 279 24% 26% -1% 3,6 99%
Deutsche Bank 2013 4680 1456 775 53% 32% 21% 369 97%
Deutsche Bank 2012 5333 814 498 61% 32% 29% 163 97%
Deutsche Bank 2010 5985 3975 1645 41% 32% 9% -2004 97%
Deutsche Bank 2011 5601 5390 1064 20% 32% -12% -264 98%
Deutsche Euroshop 2009 111 40 6 14% 32% -18% 1,314 57%
Deutsche Euroshop 2008 98 87 18 21% 32% -11% 0,46 57%
Deutsche Euroshop 2013 166 188 17 9% 32% -23% 43,692 58%
Deutsche Euroshop 2012 181 103 -19 -18% 32% -51% 15,746 63%
Deutsche Lufthansa 2008 976 730 178 24% 32% -8% 20 69%
Deutsche Lufthansa 2013 849 545 219 40% 32% 8% 125 79%
Deutsche Post 2012 2665 2209 447 20% 32% -12% 2 65%
Deutsche Post 2011 2436 1659 393 24% 32% -8% 60 71%
Deutsche Post 2013 2861 2572 361 14% 32% -18% 2 72%
Deutsche Post 2010 1835 2824 194 7% 32% -25% 56 73%
Deutsche Telekom 2008 7040 3452 1428 41% 32% 9% -388 68%
Deutsche Telekom 2010 5505 2695 935 35% 32% 3% -57 70%
Deutsche Telekom 2011 5563 3019 2349 78% 32% 46% -73 71%
Deutsche Telekom 2009 6012 2655 1782 67% 32% 35% 24 72%
Deutsche Telekom 2013 4930 2128 924 43% 32% 11% -71 80%
DIC Asset AG 2013 69 18 2 12% 32% -20% 1,56 70%
DIC Asset AG 2010 75 18 2 14% 32% -18% 7,81 71%
DIC Asset AG 2012 69 14 2 14% 32% -18% 1,78 72%
DIC Asset AG 2011 66 13 2 17% 32% -15% 2,39 72%
DIC Asset AG 2008 97 30 5 18% 32% -14% 8,76 76%
DIC Asset AG 2009 80 19 3 17% 32% -15% 7,48 76%
DMG Mori 2013 148 135 42 31% 32% -1% 0,86 47%
DMG Mori 2011 113 67 21 32% 32% 0% 0,47 53%
DMG Mori 2012 133 120 38 31% 32% -1% 0,92 56%
DMG Mori 2009 32 7 2 34% 32% 2% 0,69 67%
DMG Mori 2010 45 7 2 34% 32% 2% -0,40 70%
DMG Mori 2008 158 127 46 36% 32% 4% 0,51 73%
Duerr 2008 73 46 13 27% 28% 0% 3,04 69%
Duerr 2013 203 185 44 24% 28% -4% 0,594 75%
Duerr 2012 177 148 36 25% 28% -3% 0,452 77%
Duerr 2011 106 86 22 25% 28% -2% 0,58 78%
E.ON 2010 11247 8227 1946 24% 31% -8% 782 73%
E.ON 2009 14266 11621 2976 26% 31% -6% 717 74%
E.ON 2013 5165 3213 703 22% 31% -9% -220 74%
E.ON 2008 4934 2455 834 34% 31% 3% 454 78%
ElringKlinger 2010 116 94 25 27% 28% -1% 0 49%
35
continued
ElringKlinger 2013 165 149 38 25% 28% -2% 24,7 51%
ElringKlinger 2012 139 124 34 28% 28% 0% 19,1 52%
ElringKlinger 2011 151 137 39 29% 28% 1% 0,026 52%
ElringKlinger 2009 63 49 15 29% 28% 2% 0,01 60%
ElringKlinger 2008 76 60 17 28% 28% 0% 0,042 64%
Evonic Industries 2013 1021 836 220 26% 33% -6% 453 57%
Evonic Industries 2012 1815 1556 453 29% 33% -4% 365 60%
Evonic Industries 2011 1837 1543 451 29% 33% -3% 101 65%
Evonic Industries 2010 1339 975 175 18% 33% -15% 848 74%
Evonic Industries 2009 815 412 94 23% 33% -10% 620 75%
Evonic Industries 2008 812 362 128 35% 33% 3% 308 77%
Fielmann 2010 172 170 49 29% 32% -3% 0 24%
Fielmann 2012 181 181 51 28% 32% -4% 0 24%
Fielmann 2011 174 173 48 28% 32% -5% 0 24%
Fielmann 2009 165 162 48 30% 32% -3% 0 25%
Fielmann 2013 200 199 57 29% 32% -4% 0 26%
Fielmann 2008 166 162 48 30% 32% -3% 0 29%
Fraport 2008 359 297 101 34% 32% 2% 0,1 62%
Fraport 2013 528 341 105 31% 32% -1% -13,6 68%
Fraport 2011 497 347 97 28% 32% -4% 11,5 69%
Fraport 2012 496 364 113 31% 32% -1% 11,7 70%
Fraport 2010 431 279 7 3% 32% -29% 7 70%
Fraport 2009 290 201 44 22% 32% -10% 0,1 71%
Fuchs Petrolub 2013 312 311 92 30% 31% -1% 13,5 27%
Fuchs Petrolub 2012 293 291 84 29% 31% -2% 14,2 30%
Fuchs Petrolub 2011 264 260 77 30% 31% -1% 3,1 34%
Fuchs Petrolub 2010 250 245 74 30% 31% -1% 8,3 39%
Fuchs Petrolub 2009 180 173 52 30% 31% -1% 7,2 48%
Fuchs Petrolub 2008 172 163 53 32% 31% 1% 2,9 55%
GEA Group 2010 236 171 40 23% 31% -8% 240,9 63%
GEA Group 2013 525 352 70 20% 31% -11% 267,4 64%
GEA Group 2011 455 399 86 22% 31% -10% 221,3 65%
GEA Group 2009 268 209 48 23% 31% -8% 179,6 65%
GEA Group 2012 454 227 13 6% 31% -26% 256,2 66%
GEA Group 2008 504 459 110 24% 31% -7% 327,6 72%
Gerresheimer 2010 95 61 14 23% 31% -8% 16,9 64%
Gerresheimer 2012 131 99 30 31% 31% -1% 55 66%
Gerresheimer 2011 109 73 18 25% 31% -6% -11,3 66%
Gerresheimer 2009 60 20 13 65% 31% 34% 0,036 67%
Gerresheimer 2013 133 99 30 31% 31% -1% 44,5 69%
Gerresheimer 2008 61 17 13 74% 31% 43% 0,329 72%
Gerry Weber
International AG 2011 100 94 31 32% 32% 1% 0 24%
36
continued Gerry Weber
International AG 2012 116 114 35 31% 32% -1% 0 25%
Gerry Weber
International AG 2013 106 103 32 31% 32% -1% 0 26%
Gerry Weber
International AG 2010 83 83 28 33% 32% 2% 0 36%
Gerry Weber
International AG 2008 63 57 18 31% 32% 0% 0 39%
Gerry Weber
International AG 2009 71 66 23 35% 32% 4% 0 46%
Gesco AG 2012 37 34 11 33% 33% 0% 0,06 55%
Gesco AG 2013 32 29 9 32% 33% -1% -0,06 57%
Gesco AG 2011 39 36 11 31% 33% -2% 0,07 58%
Gesco AG 2010 27 24 8 32% 33% -1% 0,06 60%
Gesco AG 2009 16 14 4 32% 33% -1% -0,03 62%
Gesco AG 2008 39 35 11 32% 33% -1% -0,05 64%
GFK SE 2011 139 126 37 30% 31% -2% 3,24 59%
GFK SE 2012 129 108 44 41% 31% 9% 1,85 61%
GFK SE 2010 141 125 41 33% 31% 1% 3,49 61%
GFK SE 2009 89 75 15 20% 31% -12% 3,82 66%
GFK SE 2008 129 113 31 27% 31% -4% 3,61 67%
Grammer AG 2012 49 38 12 30% 29% 1% 8,90 66%
Grammer AG 2013 58 42 13 30% 29% 1% 6,50 71%
Hamburger Hafen
und Logistik AG 2008 355 324 107 33% 32% 1% 0,11 64%
Hamburger Hafen
und Logistik AG 2011 207 175 56 32% 32% 0% 0,34 65%
Hamburger Hafen
und Logistik AG 2009 160 126 37 29% 32% -3% 0,16 66%
Hamburger Hafen
und Logistik AG 2013 158 117 37 31% 32% -1% -0,55 67%
Hamburger Hafen
und Logistik AG 2010 193 159 45 28% 32% -4% 0,21 67%
Hamburger Hafen
und Logistik AG 2012 186 153 42 27% 32% -5% -4,03 68%
Hannover Rueck
SE 2012 1394 1289 364 28% 32% -4% 10,42 88%
Hannover Rueck
SE 2013 1129 1102 163 15% 32% -17% 12,54 89%
Hannover Rueck
SE 2011 841 742 65 9% 32% -23% 3,09 90%
Hannover Rueck
SE 2010 1178 1089 257 24% 32% -8% 3,86 90%
Heidelberg Cement 2012 1239 592 152 26% 30% -4% 44 55%
Heidelberg Cement 2011 1377 794 238 30% 30% 0% 51,5 57%
Heidelberg Cement 2013 1650 1081 233 22% 30% -8% 38,7 57%
Heidelberg Cement 2008 1827 998 327 33% 30% 3% 46,913 71%
Henkel VZ 2013 2285 2172 547 25% 31% -6% 0 48%
Henkel VZ 2012 2199 2018 492 24% 31% -7% 1 52%
37
continued
Henkel VZ 2011 1857 1702 419 25% 31% -7% 0 53%
Henkel VZ 2010 1723 1552 409 26% 31% -5% 1 55%
Henkel VZ 2009 1080 885 257 29% 31% -2% -4 59%
Henkel VZ 2008 779 1627 394 24% 31% -7% 1123 60%
Hochtief 2010 715 757 210 28% 33% -5% 0,222705 80%
Hochtief 2009 525 600 192 32% 33% -1% 0,226215 82%
Hochtief 2008 311 497 173 35% 33% 2% 0,305987 84%
Hochtief 2013 859 800 254 32% 33% -1% 0,210412 85%
Hugo Boss 2013 456 433 100 23% 28% -5% 0,319 52%
Hugo Boss 2012 432 408 98 24% 28% -5% -3,315 61%
Hugo Boss 2011 349 382 91 24% 28% -5% -0,172 66%
Hugo Boss 2010 264 249 60 24% 28% -4% -4,533 75%
Hugo Boss 2009 158 137 33 24% 28% -5% 0,576 81%
Hugo Boss 2008 191 148 36 24% 28% -4% -16,129 83%
Indus Holding AG 2013 114 94 30 32% 32% 0% 0,10 56%
Indus Holding AG 2012 106 85 30 35% 32% 3% 0,20 61%
Indus Holding AG 2011 112 89 33 37% 32% 5% 0,10 63%
Indus Holding AG 2010 101 74 25 34% 32% 2% 0,16 68%
Indus Holding AG 2009 55 27 12 45% 32% 13% 0,34 74%
Indus Holding AG 2008 90 60 27 45% 32% 13% 0,69 74%
Jungheinrich 2013 172 150 43 29% 32% -3% 2,398 70%
Jungheinrich 2012 163 156 44 28% 32% -4% 6,25 71%
Jungheinrich 2008 122 121 45 37% 32% 5% -405 71%
Jungheinrich 2011 146 148 43 29% 32% -3% 2,112 72%
K+S 2012 804 763 197 26% 31% -5% 5,2 48%
K+S 2011 906 887 231 26% 31% -5% 9,6 49%
K+S 2008 1343 1199 328 27% 31% -4% 2,519 51%
K+S 2010 715 599 141 24% 31% -8% 4,1 52%
K+S 2013 656 549 133 24% 31% -7% 6,6 55%
K+S 2009 238 126 30 23% 31% -8% 0,921 60%
Krones 2008 158 156 50 32% 26% 5% 1,564 57%
Krones 2013 173 170 50 30% 26% 3% -3,355 57%
Krones 2012 94 99 31 31% 26% 5% 2,137 60%
Krones 2011 71 75 31 41% 26% 15% 1,422 61%
KWS Saat AG 2011 141 116 37 32% 29% 2% 0,01 44%
KWS Saat AG 2008 78 75 25 33% 29% 4% 0,18 44%
KWS Saat AG 2010 117 110 26 24% 29% -5% -0,10 45%
KWS Saat AG 2009 82 77 25 32% 29% 3% 0,00 45%
KWS Saat AG 2012 152 142 50 35% 29% 6% 0,05 47%
KWS Saat AG 2013 138 126 46 36% 29% 7% 0,01 48%
Lanxess 2010 607 493 112 23% 32% -10% 16 69%
Lanxess 2012 810 660 151 23% 32% -10% 1 69%
Lanxess 2011 776 655 148 23% 32% -10% 7 70%