BRIEF COMMUNICATION
Pollen and spore monitoring in the
world
J. T. M. Buters
1*, C. Antunes
2, A. Galveias
2, K. C. Bergmann
3, M. Thibaudon
4, C. Galán
5, C. Schmidt‑Weber
1and J. Oteros
1Abstract
Background: Ambient air quality monitoring is a governmental duty that is widely carried out in order to detect
non‑biological (“chemical”) components in ambient air, such as particles of < 10 µm (PM10, PM2.5), ozone, sulphur dioxide, and nitrogen oxides. These monitoring networks are publicly funded and air quality data are open to the public. The situation for biological particles that have detrimental effects on health, as is the case of pollen and fungal spores, is however very different. Most pollen and spore monitoring networks are not publicly funded and data are not freely available. The information regarding which biological particle is being monitored, where and by whom, is consequently often not known, even by aerobiologists themselves. This is a considerable problem, as local pollen data are an important tool for the prevention of allergic symptoms.
Objective: The aim of this study was to review pollen monitoring stations throughout the world and to create an
interactive visualization of their distribution.
Methods: The method employed to collect information was based on: (a) a review of the recent and historical
bibliography related to pollen and fungal spore monitoring, and (b) personal surveys of the managers of national and regional monitoring networks. The interactive application was developed using the R programming language.
Results: We have created an inventory of the active pollen and spore monitoring stations in the world. There are at
least 879 active pollen monitoring stations in the world, most of which are in Europe (> 500). The prevalent monitor‑ ing method is based on the Hirst principle (> 600 stations). The inventory is visualised as an interactive and on‑line map. It can be searched, its appearance can be adjusted to the users’ needs and it is updated regularly, as new stations or changes to those that already exist can be submitted online.
Conclusions: The map shows the current situation of pollen and spore monitoring and facilitates collaboration
among those individuals who are interested in pollen and spore counts. It might also help to improve the monitoring of biological particles up to the current level employed for non‑biological components.
Keywords: Allergy, Pollen, Moulds, Spores, Monitoring, Trap, Hirst, Durham, Cour, Automatic, Stations, Map
© The Author(s) 2018. This article is distributed under the terms of the Creative Commons Attribution 4.0 International License (http://creativecommons.org/licenses/by/4.0/), which permits unrestricted use, distribution, and reproduction in any medium, provided you give appropriate credit to the original author(s) and the source, provide a link to the Creative Commons license, and indicate if changes were made. The Creative Commons Public Domain Dedication waiver (http://creativecommons.org/ publicdomain/zero/1.0/) applies to the data made available in this article, unless otherwise stated.
Background
Pollen and fungal spores have detrimental effects on health [1–7] and it is therefore logical that these airborne allergenic particles are monitored throughout the world. Monitoring the air quality of non-biological components
in ambient air is commonplace and is undertaken world-wide, mostly on the basis of legal exposure limits. The airborne components such as PM10, PM2.5, SO2, NOX and
O3 that are monitored, often with standardized methods,
may be different depending on the country that is carry-ing out the monitorcarry-ing. The fact that this monitorcarry-ing is carried out with public financing signifies that most of the data from these networks are available to the pub-lic at no cost and are often published with open access on the internet. Citizens can, therefore, easily assess the
Open Access
*Correspondence: [email protected]
1 Center of Allergy and Environment (ZAUM), Member of the German Center for Lung Research (DZL), Technische Universität München/ Helmholtz Center, Biedersteinerstrasse 29, 80802 Munich, Germany Full list of author information is available at the end of the article
quality of the air that they breathe with a minimal lag time thanks to these online networks.
The situation of biological particles is, however, com-pletely different. Only few countries like MeteoSwiss (Switzerland) and RNSA (France) have state-owned monitoring networks. Biological particles, including pol-len and fungal spores (spores), were first monitored with medical purposes in 1870 by Blackley in the UK [8], and the oldest continuous pollen record dates back to 1943 in Cardiff, the UK, a station that has used a Hirst pollen trap since 1954 [9–11]. The volumetric Hirst-type pollen and spore trap is still one of the instruments most widely used for pollen and spore monitoring [12]. Records for non-biological components are more recent: for example, the CO2 concentrations in ambient air at Mauna Loa, Hawaii,
date back to 1958 [13]. Another difference between bio-logical and non-biobio-logical air quality monitoring is that non-biological particles are collected by law as particles of < 10 µm or smaller (PM10, PM2.5), whereas biological
particles are often > 10 µm [14–16]. Some pollen, such as Urticamembranaceae Poir (Urticaceae) [17], and some fungal spores are < 10 µm in diameter (e.g. Aspergillus or Penicillium [18]), but none are smaller than fine particles of < 2.5 µm. Non-biological air quality parameters are, therefore, either gasses or small particles, while biologi-cal air quality parameters are predominately very large particles.
Despite the large size of pollen, the imperfect capac-ity of common PM10 samplers to separate particles by
size [19] signifies that up to 15% of birch (21 µm, range approx. 15–27 µm) or grass pollen (25–45 µm) falls into the PM10 fraction (particles of between 2.5 and 10 µm)
[15, 20, 21], and the situation is similar for other pol-len and moulds. The reason why very large particles are found in < 10 µm fractions of air is that the instruments used to collect particulate matter from ambient air do not completely separate them. These instruments, which are mostly impactors, have less efficient separation char-acteristics then their names suggest: PM10 implies that
particles > 10 µm are separated from the smaller particles. This is not the case, and approximately 15% of pollen, and even pollen which is larger than 20 µm, can be detected in the fraction of air that should contain only particles of < 10 µm. Pollen and fungal spores are, therefore, col-lected with the existing air-quality monitoring networks, but very poorly and these technical limitations conse-quently signify that networks monitoring non-biological components are not useful for monitoring biological particles.
About 30% of the population suffers from some type of allergy to airborne pollen [6], which may have extreme effects on their health, including death [22]. However,
few governments own pollen monitoring stations or run a monitoring network for pollen and/or fungal spores. Most pollen and spore networks are privately owned and the data they produce are not freely available.
For allergy sufferers, the location of pollen monitor-ing stations is unclear and mostly unknown: many Apps deliver pollen forecasts, but it is unclear how the data are obtained and are of little interest to the users, as they assume that sufficient data support the pollen flight prog-nosis. This is often not the case. For instance, Bavaria in Germany has 12 million inhabitants but only 3 non-public pollen monitoring stations are operating (www. pollenstiftung.de), despite the availability of many Apps. The quality of the pollen flight prognosis is consequently, questionable. Finding the location of pollen monitor-ing stations could, therefore, be useful for stakeholders. The creation of a map of pollen monitoring stations will improve access to local pollen data and will, hopefully, benefit those with allergies, the medical profession and, of course, aerobiologists. Our aim was, therefore, to a review pollen and spore monitoring stations throughout the world and to develop a practical visualisation method to disseminate their data.
Methods
The inventory of active pollen monitoring stations was created by: (1) reviewing the relevant bibliography and (2) contacting authors or the network managers of pollen networks. Information on pollen monitoring stations was obtained by phone, email or post. A small questionnaire was sent, which requested information on what was mon-itored, since when, at which location, using which collec-tion method (Hirst-type, brand type Burkard or Lanzoni, automatic or another sampling system), the availability of quality control, and the station owner’s most recent con-tact data. This questionnaire is also accessible in an inter-active format in the map application. The questionnaire makes it possible to fill in a.csv database which serves as input data for the map.
The map was programmed in “R” [23]. Maps are instan-taneously displayed at https://www.zaum-online.de/ pollen-map.html. Stations that are currently running are displayed by default, but historic sites can also be made visible. New information for the map (changes of owner, a new station etc.) can be submitted to either the App-administrator or the map itself online via the “contact form (Modify info, add station, contact)” button. The information is then reviewed by the App-administrator and, if correct, entered in the database, after which the new information is displayed. It is not possible to make a modification without the App-administrator, thus pre-venting the misuse of the map.
Results and discussion
In order to clarify who is monitoring which biological particle and where, we created an up-dated inventory. We subsequently constructed a map of the pollen moni-toring sites throughout the world. We received feed-back from 1011 sites. Because our old map [24] was already outdated upon publishing, we opted for an interactive on-line map. This map can be accessed at: https://www. zaum-online.de/pollen-map.html; http://www.eaaci.org/ patients/resources/; https://oteros.shinyapps.io/pol-len_map/ (see Fig. 1). Other websites also show informa-tion on pollen monitoring networks in the world (http:// www.worldallergy.org/pollen/, accessed Jan 2018), but most information is incomplete or is limited to one country (https://www.uco.es/rea/infor_rea/estaciones. htm, accessed Jan 2018), or shows only links to certain national websites (https://www.polleninfo.org/country-choose.html, accessed Jan 2018). Access to this map was made open to the public in June 2017, and has already exceeded 250 h/month. The map is constantly updated and individuals who have, or know of, a station that is not
currently on the map may use the contact or submission buttons to make that station visible to all. The map does not show any pollen or spore data, only where a station is located (zoom down to street level), what is monitored (pollen, spores or both) and who to contact in order to obtain information regarding that station (or pollen date). The map allows its users to search for specific sta-tions, and also has a cluster view and filtering options for the monitoring features.
The map makes access to pollen and spore informa-tion freely available. As pollen and spores do not stop at borders, but measuring networks and their dissemination activities do, it was more complicated to obtain data from stations abroad in the past, simply because access was complicated. The new map only shows the contact infor-mation of all the data providers that agreed to be in. The map will foster international cooperation and enable pol-icy makers to compare their local situation with that of the rest of the world. Patients who suffer from hay fever and members of the medical profession who are treating hay fever patients will profit by finding the most suitable
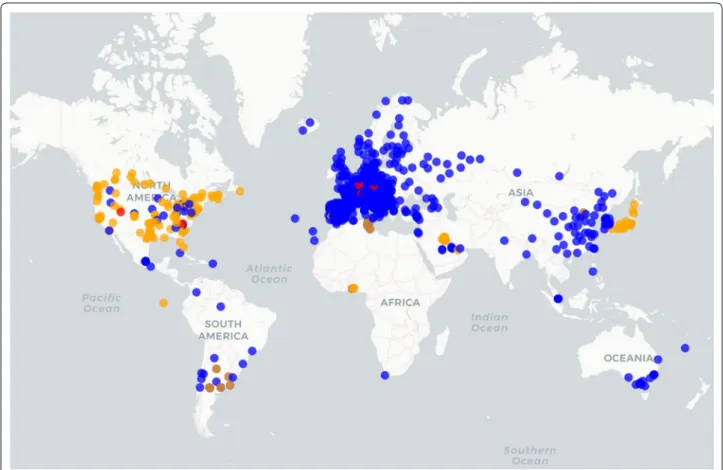
Fig. 1 Screen shot of the interactive map of pollen and fungal spore monitoring stations in the world. The map is web‑based, zoomable down to street level, shows the contact information of each station, and can be searched and displayed according the users’ needs. The map is constantly updated and is available at: https://www.zaum‑online.de/pollen‑map.html; http://www.eaaci.org/patients/resources; https://oteros.shinyapps.io/ pollen_map (accessed 25‑01‑2018). Blue dots (Hirst trap), red (Automatic station), orange (other manual)
monitoring station from which to obtain pollen or spore data for comparison with the patient’s symptoms. This could improve diagnosis.
Our review accounts for at least 879 open running pol-len traps in the world from a total of 1020 records (Fig. 1). As can be observed, most of the traps are distributed in the northern hemisphere, the majority in Europe. The continent with the weakest coverage is Africa. The top six countries by number of active pollen stations are: Japan (143), Italy (88), USA (85), France (85), Spain (77) and Germany (44). The Environmental Agency of Japan owns the biggest network (120 automatic traps), while RNSA of France owns the biggest Hirst-based network (84). The inventory focused on currently operational stations. Some cities are densely monitored by several pollen traps e.g. Milan, Seoul, Tokyo, Toronto, Sydney, Madrid, Mex-ico DC or Paris. Discontinued historical locations were not specifically inventoried, although interested owners can include their stations on the map. Of those stations that are still open, 70% are based on the Hirst method (Table 1) [12]. Hirst is the prevalent method on all conti-nents with the exception of America, where only 28% of the traps are Hirst and most are based on Rotorod tech-nology. We observed a 50–50% equilibrium as regards the abundance of the two main Hirst trap brands: Burk-ard (http://www.burkBurk-ard.co.uk/, http://www.burkardsci-entific.co.uk) and Lanzoni (www.lanzoni.it).
Japan is the pioneer in automatic monitoring, with 120 stations based on the KH technology [25]. Automatic monitoring in Japan is possible because the spectrum of pollen whose identification is of interest is very lim-ited [26]. According to Pollen-Sense (http://pollensense. com/), there are only two automatic stations in the whole of the American continent. Europe is reported to have 8 automatic stations: 2 based on Plair PA-300 Rapid E [27] and 6 based on BAA-500 [28]. However, automation is increasing: a network is being built in Switzerland and a network of 8 BAA-500 is being built in Bavaria (Ger-many). The time resolution provided by automatic sta-tions is between 1 and 3 h. Of the manual methods, Hirst allows the minimal time resolution of 2 h, which is pro-vided by 50% of the stations. The other stations provide average concentrations of 24 h. About 50% of those sta-tions that are open also monitor fungal spores in ambient air; the fungal species monitored depend on the country, but almost always include Alternaria spp. and often Cla-dosporium spp. Further statistics can be obtained from the online map site.
Conclusions
The majority of active monitoring stations are based on the Hirst principle (616 of 879 stations), but technologi-cal developments now allow automatic monitoring.
This map makes it clear where and by whom pollen and fungal spores are monitored in the world. It is similar to the publicly available maps created for non-biological (chemical) pollutants and makes it clear that, in our opin-ion, biological particle monitoring is a neglected aspect of air quality monitoring. We trust that the map will address this discrepancy.
Authors’ contributions
Leading initiative and leading writing: JB; leading data collection: CA and AG; interactive map development and administrator: JO; database inventory and writing: JB, CA, AG, KCB, MT, CG, CS‑W and JO. All authors read and approved the final manuscript.
Author details
1 Center of Allergy and Environment (ZAUM), Member of the German Center for Lung Research (DZL), Technische Universität München/Helmholtz Center, Biedersteinerstrasse 29, 80802 Munich, Germany. 2 ICAAM – Institute of Mediterranean Crop and Environmental Sciences, University of Évora, Évora, Portugal. 3 Allergy‑Center‑Charité, Charité University Hospital, Berlin, Germany. 4 RNSA (Réseau National de Surveillance Aérobiologique), Brussieu, France. 5 Department of Botany, Ecology and Plant Physiology, University of Córdoba, International Campus of Excellence on Agrifood (ceiA3), Córdoba, Spain.
Acknowledgements
We would like to thank the many people who, with their personal contacts, helped us to collect all the necessary information regarding the pollen and spore monitoring stations, along with the EAACI (European Academy of Allergy and Clinical Immunology) for funding Task Force 40108. We also thank all participant who submitted their data to the map. We acknowledge Helmholtz ZentrumMünchen for the Postdoctoral Fellowship Program III 2017–2019.
Competing interests
The authors declare that they have no competing interests.
Availability of data and materials
Data are displayed at https://www.zaum‑online.de/pollen‑map.html.
Consent for publication
Not applicable.
Ethics approval and consent to participate
Not applicable.
Funding
EAACI (European Academy of Allergy and Clinical Immunology) funding for Task Force 40108.
Publisher’s Note
Springer Nature remains neutral with regard to jurisdictional claims in pub‑ lished maps and institutional affiliations.
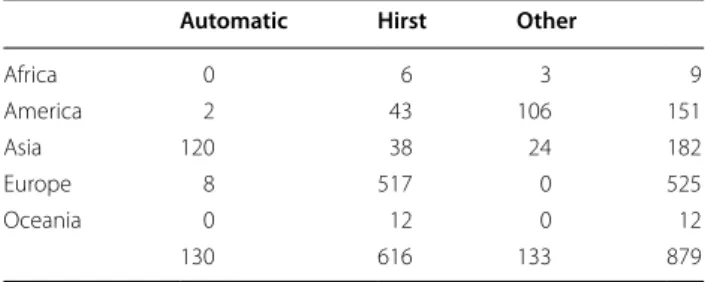
Table 1 Pollen and mould monitoring stations in the world
Only information regarding those stations that were active in 2016 (879 stations) from the total inventory (1020 stations) is displayed
Automatic Hirst Other
Africa 0 6 3 9 America 2 43 106 151 Asia 120 38 24 182 Europe 8 517 0 525 Oceania 0 12 0 12 130 616 133 879
• We accept pre-submission inquiries
• Our selector tool helps you to find the most relevant journal
• We provide round the clock customer support
• Convenient online submission
• Thorough peer review
• Inclusion in PubMed and all major indexing services
• Maximum visibility for your research Submit your manuscript at
www.biomedcentral.com/submit
Submit your next manuscript to BioMed Central
and we will help you at every step:
Received: 2 November 2017 Accepted: 3 March 2018
References
1. Durham SR, Nelson HS, Nolte H, Bernstein DI, Creticos PS, Li Z, et al. Mag‑ nitude of efficacy measurements in grass allergy immunotherapy trials is highly dependent on pollen exposure. Allergy. 2014;69(5):617–23. 2. Ege MJ, Mayer M, Normand AC, Genuneit J, Cookson WO, Braun‑Fahr‑
lander C, et al. Exposure to environmental microorganisms and child‑ hood asthma. N Engl J Med. 2011;364(8):701–9.
3. Eduard W. Fungal spores: a critical review of the toxicological and epide‑ miological evidence as a basis for occupational exposure limit setting. Crit Rev Toxicol. 2009;39(10):799–864.
4. Shin SH, Ye MK, Choi SY, Kim YH. Effect of eosinophils activated with Alternaria on the production of extracellular matrix from nasal fibroblasts. Ann Allergy Asthma Immunol. 2016;116(6):559–64.
5. Sofiev M, Bergmann K. Allergenic pollen: a review of the production, release, distribution and health impacts. Heidelberg: Springer; 2013. 6. Burbach GJ, Heinzerling LM, Edenharter G, Bachert C, Bindslev‑Jensen C,
Bonini S, et al. GA(2)LEN skin test study II: clinical relevance of inhalant allergen sensitizations in Europe. Allergy. 2009;64(10):1507–15. 7. Haftenberger M, Laussmann D, Ellert U, Kalcklosch M, Langen U, Schlaud
M, et al. Prevalence of sensitisation to aeraoallergens and food allergens: results of the German Health Interview and Examination Survey for Adults (DEGS1). Bundesgesundheitsblatt Gesundheitsforschung Gesund‑ heitsschutz. 2013;56(5–6):687–97.
8. Blackley C. Experimental researches on the cause and nature of Catarrhus Aestivus (hay fever, hay asthma). London: Balliere, Tindall & Cox; 1873. 9. Hyde HA. Volumetric counts of pollen grains at Cardiff, 1954–1957. J
Allergy. 1959;30(3):219–34.
10. Hyde H, Williams D. Studies in atmospheric pollen. II: diurnal variation in the incidence of grass pollen. New Phytol. 1945;44:83–94.
11. Hyde H. Studies in atmospheric pollen. IV. Pollen deposition in Great Britain, 1943. Part II. The composition of the pollen catch. New Phytol. 1950;49(3):407–20.
12. Hirst JM. An automatic volumetric spore trap. Ann Appl Biol. 1952;39(2):257–65.
13. IPCC. Climate change: working group I: the physical science basis. In: Solomon S, Qin D, Manning M, Chen Z, Marquis M, Averyt K, et al., editors.
http://www.ipcc.ch/index.htm#.UK‑1xaU7GRg. Cambridge University Press; 2007.
14. Pohl F. Die Pollenkorngewichte einziger Pflanzen und ihre Ökologische Bedeutung. Beiträge zur Morphologie. Botanische Zentralblatt (Phyt). 1937;57:112–72.
15. Brown HM, Irving KR. The size and weight of common allergenic pollens: an investigation of their number per microgram and size distribution. Acta Allergol. 1973;28(2):132–7.
16. Winkler H, Ostrowski R, Wilhelm M. Pollenbestimmungsbuch der Stiftung Deutscher Polleninformationsdienst. Paderborn: Takt Verlag; 2001. 17. Trigo M.M., Jato V., Fernández D., C.G. Atlas Aeropalinológico de España;
2008.
18. Morris G, Kokki M, Anderson K, Richardson M. Sampling of Aspergillus spores in air. J Hosp Infect. 2000;44(2):81–92.
19. Pöttering H, Lenarcic J. Directive 2008/50/EC of the european parliament and of the council. OJ 2008;11-6-20098(L):152/155.
20. Buters JTM, Thibaudon M, Smith M, Kennedy R, Rantio‑Lehtimaaki A, Albertini R, et al. Release of Bet v 1 from birch pollen from 5 Euro‑ pean countries. Results from the HIALINE study. Atmos Environ. 2012;55:496–505.
21. Buters J, Prank M, Sofiev M, Pusch G, Albertini R, Annesi‑Maesano I, et al. Variation of the group 5 grass pollen allergen content of airborne pollen in relation to geographical location and time in season. J Allergy Clin Immunol. 2015;136(1):87–95.
22. Beggs PJ. Allergen aerosol from pollen‑nucleated precipitation: A novel thunderstorm asthma trigger. Atmos Environ. 2017;152:455–7. 23. Chambers J. Programming in R; 2008.
24. Buters JTM. Pollen allergens and geographical factors. In: Akdis C, Agache I, editors. Global atlas of allergy, chapter 31. Zurich: European Academy of Allergy and Clinical Immunology; 2014. p. 36–8.
25. Kawashima S, Thibaudon M, Matsuda S, Fujita T, Lemonis N, Clot B, et al. Automated pollen monitoring system using laser optics for observing seasonal changes in the concentration of total airborne pollen. Aerobio-logia. 2017; 1–12.
26. Kawashima S, Clot B, Fujita T, Takahashi Y, Nakamura K. An algorithm and a device for counting airborne pollen automatically using laser optics. Atmos Environ. 2007;41(36):7987–93.
27. Crouzy B, Stella M, Konzelmann T, Calpini B, Clot B. All‑optical automatic pollen identification: towards an operational system. Atmos Environ. 2016;140:202–12.
28. Oteros J, Pusch G, Weichenmeier I, Heimann U, Moller R, Roseler S, et al. Automatic and online pollen monitoring. Int Arch Allergy Immunol. 2015;167(3):158–66.