October 2019
Diogo Duarte Pacheco Botelho Moniz
Licenciado em Engenharia de Materiais
Piezoelectric ceramics for bone regeneration
Dissertação para obtenção do Grau de Mestre em Engenharia de Materiais
Advisor: M. Carmo Lança, (Assistant Professor), DCM FCT-UNL and CENIMAT
Co-advisor: M. Margarida Lima, (Assistant Professor), DCM FCT-UNL and CENIMAT
Jury:
President: João Paulo Borges, (Associate Professor w/ Habilitation), DCM FCT-UNL and CENIMAT
Examiner: Rui Alberto Garção Barreira do Nascimento Igreja, (Assistant Professor) DCM FCT-UNL and CENIMAT
Advisor: M. Carmo Lança, (Assistant Professor), DCM FCT-UNL and CENIMAT
iii Piezoelectric ceramics for bone regeneration
Copyright © Diogo Duarte Pacheco Botelho Moniz, Faculdade de Ciências e Tecnologia, Universidade Nova de Lisboa.
A Faculdade de Ciências e Tecnologia e a Universidade Nova de Lisboa têm o direito, perpétuo e sem limites geográficos, de arquivar e publicar esta dissertação através de exemplares impressos
reproduzidos em papel ou de forma digital, ou por qualquer outro meio conhecido ou que venha a ser inventado, e de a divulgar através de repositórios científicos e de admitir a sua cópia e
distribuição com objetivos educacionais ou de investigação, não comerciais, desde que seja dado crédito ao autor e editor.
v
vii
Acknowledgments
Gostaria de agradecer muito à minha orientadora Prof. Maria do Carmo Lança e aos co-orientadores Prof. Maria Margarida Lima e Prof. João Paulo Borges por me terem aceitado como seu aluno de dissertação e por todo o apoio profissional e pessoal dado ao longo deste projeto.
Ao DCM e CENIMAT por todas as ferramentas e meios disponibilizados, à FCT-UNL por ter sido a instituição que me formou e me deu as memoráveis recordações do percurso académico que fiz.
À Universidade de Aveiro, em particular ao Pedro Prezas e ao Professor Manuel Graça, pela disponibilidade e ajuda prestada na polarização por corona das amostras.
Agradeço também à Andreia Lopes por toda a ajuda incansável no dia-a-dia durante este projecto, tal como ao Edgar Camacho e à Fernanda Bruno de Carvalho por toda a disponibilidade e boa disposição em todas as horas de almoço e não só.
Aos que “deambulam eternamente”, agradeço terem-me mostrado um exemplo extraordinário de amizade que, por isso mesmo, espero guardar para o resto da vida.
A minha família que, apesar das suas atarefadas vidas e dispersas pelo mundo, nunca se esqueceram de se preocupar e mostrar apoio.
A quem me criou com tudo o que tinha sem me pedir nada em troca, obrigado “Cácá”. O mais humilde agradecimento para os meus pais e avó, por terem sido quem me conduziu enquanto cresci e por me terem educado a partir do exemplo, embutindo valores e princípios que espero conseguir, sempre que possível, aplicar na minha vida.
ix
Resumo
O titanato de bário (BT) é um cerâmico piezoelétrico bastante estudado e neste trabalho será alvo de dopagem com cálcio até ao limite em que a substituição não comprometa a sua fase tetragonal, que lhe confere as aptidões piezoelétricas. Partindo dos reagente analíticos CaCO3, BaCO3 e TiO2, prepararam-se, por reação no estado sólido, misturas de Ba(1-x)CaxTiO3 0 ≤ x ≤ 0,3 (BCT). O material foi sinterizado a temperaturas entre 1150 °C e 1450 °C em atmosferas de ar e N2. Compósitos foram produzidos a partir de Ba(1-x)CaxTiO3 0 ≤ x ≤ 0,15 e hidroxiapatite (HP) em proporções de 90/10 e 80/20 (BCT/HP %) em peso. A caracterização do material foi feita utilizado análises como DTA-TG, granulometria, difração de raios-X, FTIR, Raman e SEM/EDS. As amostras foram polarizadas pelo método de corona a 110 °C durante 1 hora com potencial de ponta de -15kV e -2kV potencial de rede para subsequente análise de bioactividade. A polarização foi analisada por correntes termo estimuladas de depolarização (TSDC).
A substituição de cálcio até 15% molar deformou a estrutura cristalina do BT sem comprometer a sua tetragonalidade, mantendo a temperatura de Curie entre 123 °C e 125 °C. Os materiais produzidos comprovaram ser não-citotóxicos. Polarização por corona foi bem sucedida.
Hidroxiapatite reagiu com BCT quando a sinterização foi feita a 1350 °C formando novas fases como fosfato de bário, mas mantendo parcialmente as estruturas originais.
Um estudo embrionário de bioactividade foi feito emergindo as amostras em SBF (simulated body fluid) durante 7 dias e analisando, por ICP-AES, amostras de meio retiradas em diferentes intervalos de tempo. No mesmo âmbito, fez-se análise da superfície da amostra no final da experiência através de SEM/EDS. Os resultados indicam que as amostras polarizadas não contendo hidroxiapatite têm maior tendência para depositarem iões de fósforo e cálcio na sua superfície.
xi
Abstract
Piezoelectric materials have shown large potential on hard tissue applications due to their ability to stimulate osteogeneses and osseointegration. Barium titanate (BT) is a well-known piezoelectric ceramic. This work reports the consequences of calcium acceptance in BT lattice without compromising the formation of piezoelectric tetragonal phase under physiological conditions. Analytical reagents CaCO3, BaCO3 and TiO2 were used to prepare, via solid state reaction, Ba(1-x)CaxTiO3 (BCT), 0 ≤ x ≤ 0.3 mixtures. Materials were sintered from 1150°C to 1450°C under air and N2 atmospheres. Composites were prepared from Ba(1-x)CaxTiO3 (0 ≤ x ≤ 0.15) and hydroxyapatite (HP) at 10/90 and 20/80 (HP/BCT wt%) proportions. Reagents and produced ceramics were characterized by DTA-TG, granulometry, X-ray diffraction, FTIR, Raman and SEM/EDS. Samples were polarized by corona poling at 110°C, 1 hour, tip potential -15kV and -2kV grid potential for subsequent bioactivity essays. The polarization was analysed by thermally stimulated depolarization currents.
Calcium substitution up to 15 mol% deformed the known BaTiO3 lattice without compromising the tetragonal phase stability, maintaining Curie point between 123 °C and 125 °C. All materials tested were non cytotoxic. Corona poling was successfully done to BCT samples.
Hydroxyapatite reacts with BCT while sintered at 1350 °C forming different phases, but materials original structures are partially maintained.
Early stage bioactivity studies made after both polarized and unpolarized samples were immersed in SBF (simulated body fluid) for 7 days. Results from ICP-AES supported by SEM/EDS point to the materials enhanced ability while polarized to deposit calcium and phosphor ions on its surface.
xiii
Table of Contents
Acknowledgments ... vii
Resumo ... ix
Abstract ... xi
Table of Contents ... xiii
List of Tables ... xv
List of Figures ... xvii
Abbreviations and Symbols ... xxi
1. Motivation and Objectives ... 1
2. Introduction ... 3
2.1. Piezoelectric Barium Titanate ... 3
2.2. Piezoelectricity and biocompatibility compromise ... 4
2.3. Hydroxyapatite ... 5
2.4. Sample preparation and characterization ... 6
2.5. Applications and challenges ... 7
3. Materials and methods ... 9
3.1. Analytical reagents characterization... 9
3.2. Barium titanate and calcium doped BT synthesis ... 9
3.3. Sample characterization ... 10
3.4. Cytotoxicity tests ... 10
3.5. Polarization and TSDC ... 10
3.6. Bioactivity tests ... 10
4. Results and Discussion ... 11
4.1. Analytical reagents CaCO3, BaCO3 and TiO2 ... 11
4.1.1. Differential thermal analysis-Thermogravimetry ... 11
4.1.2. Granulometry and X-Ray diffraction ... 11
4.1.3. FTIR ... 13
4.2. Calcium doped BT mixtures ... 13
4.2.1. DTA-TG and Granulometry... 13
4.2.2. X-Ray Diffraction ... 16
4.2.3. FTIR ... 17
4.2.4. RAMAN ... 18
4.2.5. DSC ... 19
4.2.6. SEM and EDS ... 21
xiv
4.2.8. Thermally stimulated depolarization currents... 23
4.3. Hydroxyapatite and calcium doped BT composite ... 25
4.3.1. X-Ray Diffraction ... 25
4.3.2. SEM and EDS ... 27
4.4. ICP-AES and SEM/EDS accounting for bioactivity essays ... 28
5. Conclusions ... 31
5.1. Future perspectives ... 32
References ... 34
Annexes ... 40
A. Introduction ... 40
B. Sample production method ... 41
C. DTA-TG mixtures analysis ... 42
D. Granulometry ... 44
E. XRD ... 45
E.1. Calcium doped barium titanate ... 45
E.2. Hydroxyapatite composites ... 46
F. FTIR... 48
G. Raman analysis of every mixture ... 49
H. DSC ... 52
I. SEM and EDS ... 53
I.1. Calcium doped barium titanate ... 53
I.2. Hydroxyapatite composites ... 55
J. Cytotoxicity ... 57
K. Thermal stimulated depolarization currents ... 58
xv
List of Tables
Table 3.1 Summary of prepared samples and their sintering conditions ... 9 Table 4.1 Granulometry analysis results for milling time and correspondent average particle size of BT mixture. ... 15 Table 4.2 Average particle size (µm) for every mixture prepared. Results were obtained by granulometry analysis made in water. ... 15 Table 4.3 Depolarization parameters from TSDC analysis. ... 25
xvii
List of Figures
Figure 2.1.1 (a) Perovskite cubic unit cell structure barium titanate presents above Curie temperature. Below Curie temperature it presents tetragonal structure where Ti4+ ion displacement will shift
upward (b) and downward (c) [8]. ... 3
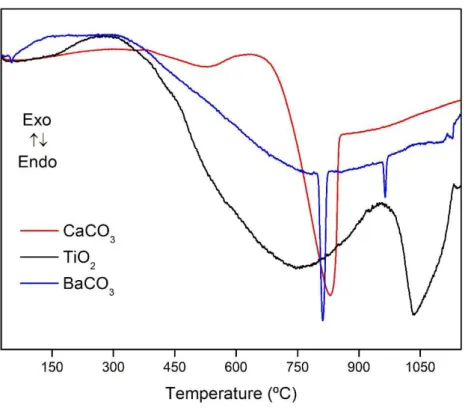
Figure 4.1.1 DTA analysis of the three analytical reagents BaCO3, CaCO3 and TiO2. ... 11
Figure 4.1.2 Granulometry analysis of the three analytical reagents BaCO3, CaCO3 and TiO2. ... 12
Figure 4.1.3 XRD of BaCO3, CaCO3 and TiO2 powder. tetragonal anatase, rhombohedral calcite and l orthorhombic witherite. ... 12
Figure 4.1.4 FTIR analysis of each BaCO3, CaCO3 and TiO2 analytical reagents in powder state. ... 13
Figure 4.2.1 BT and BCT30 differential thermic analysis in order to compare the behaviour of the highest calcium substituted material and no calcium substituted material. ... 14
Figure 4.2.2 Mass loss (%) in function of calcium presence along the calcination process with a 5 °C min-1 heating rate from room temperature up to 1000 °C remaining at the highest temperature for 4 hours. ... 15
Figure 4.2.3 X-Ray diffraction of BT and BCT30 mixtures sintered at 1350 °C in both air and N2 atmospheres. tetragonal Ba(1-x)CaxTiO3, l orthorhombic CaTiO3 and tetragonal BaTiO3. ... 16
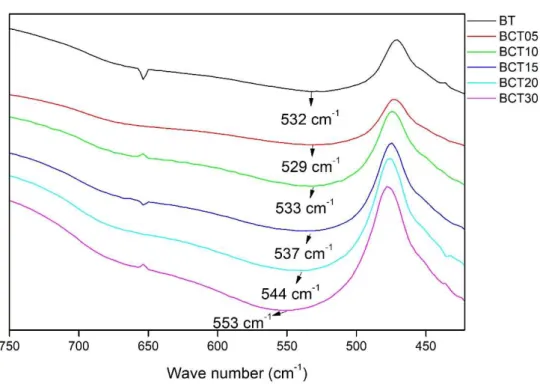
Figure 4.2.4 FTIR analysis of every Ba1-xCaxTiO2 compounds mixed with KBr. ... 17
Figure 4.2.5 Relation between FTIR absorption peaks and calcium substitution. ... 18
Figure 4.2.6 Raman analysis of BCT30, BCT15 and BT samples. ... 19
Figure 4.2.7 Differential scanning calorimetry analysis to all the Ba1-xCaxTiO2 mixtures in order to obtain the Curie point for each one. ... 20
Figure 4.2.8 Evolution of Curie point in function of calcium molar percentage. ... 20
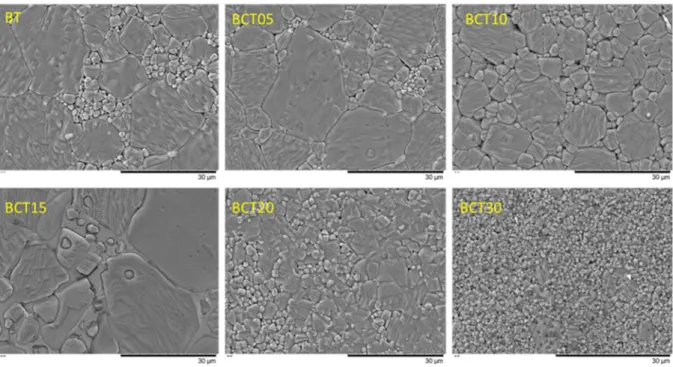
Figure 4.2.9 SEM showing different grain sizes in Ba(1-x)CaxTiO3 0 ≤ x ≤ 0.3 ... 21
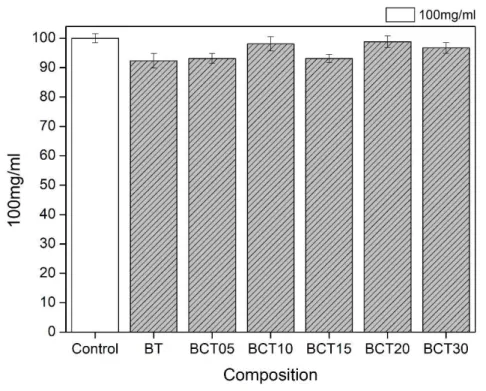
Figure 4.2.10 Cytotoxicity results for all Ba1-xCaxTiO3 mixtures and the control with correspondent error bars. ... 22
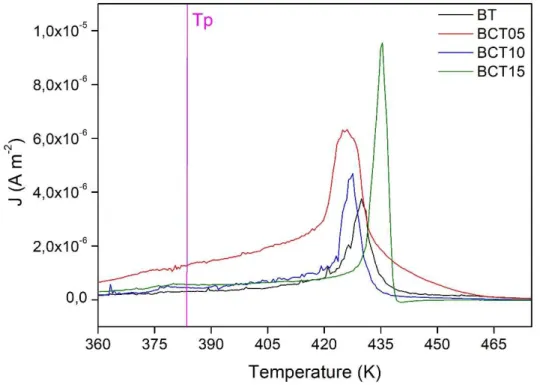
Figure 4.2.11 Thermally stimulated depolarization currents of Ba(1-x)CaxTiO3 0 ≤ x ≤ 0.15 polarized samples and polarization temperature marked as Tp. ... 23
Figure 4.2.12 Linear fit done from equation 4.13 and 1/T combination to calculate the activation energy and τ0 of polarized samples. Dashed lines represent the linear fit done from the original curves. ... 24
Figure 4.3.1 X-ray diffraction of 1350 °C sintered and non-sintered commercial hydroxyapatite. Hydroxyapatite, β-TCP and α-TCP. ... 25
Figure 4.3.2 X-ray diffraction comparison between BCT10 samples containing 10 wt% and 20 wt% hydroxyapatite, BCT10 sample and HP sample all sintered at 1350 °C. Hydroxyapatite, barium phosphate, calcium doped barium titanate and α-TCP. ... 26
Figure 4.3.3 BCT10/HP (90/10) composite under SEM microscopy and EDS quantification on three different points of the sample. ... 27
Figure 4.4.1 SEM microscopy showing BCT05 surface: (a) unpolarized after sintering, (b) unpolarized after immersed in SBF for 7 days (c) polarized after 7 day immersion in SBF. ... 28
xviii
Figure 4.4.2 ICP-AES results for both calcium and phosphor concentration in SBF samples, collected during 7 days, out of a recipient containing one polarized Ba(1-x)CaxTiO3 0 ≤ x ≤ 0.15 ceramic sample
and 250 mL SBF. ... 30
Figure A.1 Electric field application effect on the spontaneous oriented domains formed from cooling in piezoelectric materials [77]. ... 40
Figure A.2 BaTiO3-TiO2 equilibrium phase diagram [45] ... 40
Figure A.3 Phase diagram of BaTiO3 and CaTiO3 [46] ... 41
Figure B.1 Schematic of BT and BCT sample production ... 41
Figure B.2 Apparatus of the corona system used to polarize samples close to the Curie point (left) and corona tip and grid schematic (right). ... 42
Figure C.1 BaCO3 analytical reagent DTA-TG analysis. ... 42
Figure C.2 TiO2 analytical reagent DTA-TG analysis. ... 43
Figure C.3 CaCO3 analytical reagent DTA-TG analysis. ... 43
Figure C.4 Differential thermic analysis of all Ba(1-x)CaxTiO3 mixtures on the range 400 °C to 1100 °C. ... 44
Figure D.1 Granulometry analysis for commercial hydroxyapatite used in composite making. ... 44
Figure E.1 XRD analysis for BT samples sintered at different temperatures from 1150 °C to 1350 °C.45 Figure E.2 XRD analysis for BCT30 samples sintered at different temperatures from 1150 °C to 1350 °C (on top) and zoom on diffractograms in areas with peaks of CaTiO3 (bellow). ... 45
Figure E.3 XRD for Ba(1-x)CaxTiO3 0 ≤ x ≤ 0.15 mixture sintered at 1350 °C. Sample BCT15 is the only sample to present a double peak below 2θ = 40° and it might be due to a different conformation of titanium during sintering. ... 46
Figure E.4 X-ray diffraction of all BT and hydroxyapatite sintered at 1350 °C. ... 46
Figure E.5 X-ray diffraction in order to compare BCT05 composites with HP and solo BCT05, all 1350 °C sintered. ... 47
Figure E.6 X-ray diffraction for all BCT15 composites to be compared with BCT15 solo and HP, all 1350 °C sintered. ... 47
Figure F.1 Barium titanate sintered at 1350 °C FTIR spectrum ... 48
Figure F.2 Ti-O vibration modes: Bending vibration (left), stretching vibration (right) [61]. ... 48
Figure G.1 Raman analysis of all the mixtures Ba1-xCaxTiO3 sintered at 1350 °C. Note along the increase of calcium presence the disappearance of the 309 cm-1 peak visible in BT inside the dashed rectangular. It is also noticeable the progression of a second peak signed with the dot-dash line to higher Raman shift values in function of calcium presence. ... 49
Figure G.2 Raman analysis of the 1350 °C sintered mixtures that qualify to composite making. Up to BCT15 is possible to spot the 309 cm-1 peak that assures tetragonality of the material. The perturbation spotted in 470 cm-1 is also related with tetragonality. ... 49
Figure G.3 Raman analysis of Ba(1-x)CaxTiO3 0 ≤ x 0.3 mixtures sintered at 1450 °C. ... 50
xix
Figure G.5 Raman vibration modes [61] ... 51
Figure H.1 Lattice distortion caused by Ca2+ substitution on B-site of ABO3 perovskite structure [28]. ... 52
Figure H.2 DSC analysis of BT samples sintered at different temperatures 1150 °C, 1250 °C, 1350 °C and 1450 °C. ... 52
Figure H.3 DSC analysis of BCT30 samples sintered at 1150 °C, 1250 °C , 1350 °C and 1450 °C. ... 53
Figure I.1 SEM analysis for diamond paste polished samples of BT, BCT15 and BCT30. ... 53
Figure I.2 SEM and EDS analysis for BCT30 polished sample. ... 54
Figure I.3 BT/HP (90/10) composite under SEM microscopy with EDS quantification on four different points of the sample. ... 55
Figure I.4 EDS quantification of BCT10/HP (90/10) composite. SEM imaging of this same sample is present in section 4.3.2, figure 4.21. ... 56
Figure J.1 Labelled plate used in cytotoxicity assays with the positions of each intervenient in order to account for every mixture cell viability. ... 57
Figure K.1 Results for polarized and depolarized Ba(1-x)CaxTiO3 0 ≤ x ≤ 0.15 samples submitted to thermally stimulated depolarization currents. ... 58
Figure K.2 Never polarized samples TSDC analysis. ... 59
Figure K.3 TSDC spectrum showing a pyroelectric anomalous current on BT sample. ... 59
Figure L.1 SEM/EDS results for polarized BCT05 sample after 7 days SBF immersion. ... 60
Figure L.2 EDS quantification for polarized BCT05 samples immersed in SBF for 7 days. ... 61
Figure L.3 ICP-AES results for Ba(1-x)CaxTiO3 0 ≤ x ≤ 0.15 unpolarized samples 7 days immersion in SBF. Samples were put inside a recipient containing 250 mL when the test starts. Each graph shows the SBF calcium and phosphor concentration varying during the 7 days period. ... 62
Figure L.4 ICP-AES results for polarized composites. ... 63
Figure L.5 ICP-AES results for unpolarized composites. ... 64
Figure L.6 SEM/EDS mapping and quantification of polarized BT sample after 7 days immersion in SBF. ... 65
Figure L.7 SEM/EDS mapping and quantification for polarized BCT10 sample after 7 days immersion in SBF. ... 66
Figure L.8 SEM/EDS mapping and quantification for polarized BCT15 sample after 7 day immersion in SBF. ... 67
xxi
Abbreviations and Symbols
PFM – Piezoelectric Force Microscopy HP – Hydroxyapatite
BT – Barium Titanate
d33 – Piezoelectric coefficient XRD – X-Ray Diffraction
SEM/EDS – Scanning Electron Microscope/ Energy Dispersive Spectroscopy TSDC – Thermally Stimulated Depolarization Currents
DTA-TG – Differential Thermal Analysis-Thermogravimetry FTIR – Fourier Transform Infrared
ICP-AES – Inductively coupled plasma atomic emission spectroscopy BCT – Calcium doped barium titanate
BCT/HP – Calcium doped barium titanate and hydroxyapatite composite BPH – Barium phosphate hydroxide
α-TCP – alpha tricalcium phosphate β-TCP – beta tricalcium phosphate Tc – Curie temperature
χ – Electric susceptibility C – Curie constant
Tθ – Curie temperature in stressed state Q11 and Q12 – Electrostrictive coefficients α – Temperature coefficient p – Hydrostatic stress ɛ0 – Permittivity Qp – Polarization charge β – Heating rate J – Current density τ – Relaxation time Ea – Activation energy k – Boltzmann constant
1
1. Motivation and Objectives
Bone implants have been used worldwide for many years, in the last decades the developments in tissue engineering generated various new applications. Increased accessibility to these means by a rising population gave way to a $46/€41 million market in 2017 expected to reach $67/€60 million by 2025 [1]. The demand for bone implants can only grow bigger by reaching more patients in a wider socioeconomical spectrum.
Surgeries involving orthopaedic implants are, in many cases, obviously very invasive and may cause infections or disease transmission. In this sense, medics avoid doing it until it is absolute necessary. These procedures often require bone grafts, in other words the harvesting of healthy bone from a part of the body to replace the affected one. The most successful practice is to use the patient own bone, called an autograft. However, the bone quality may be poor and scarce specially in older patients, making it necessary to find a bone supplement donor performing an allograft. Xenogeneic bone (i.e. animal donor) or allografts might generate other problems related with immune rejection leading to total implant failure [2].
Another very important parameter used to evaluate implant failure is clinically marked mobility. Implant mobility is a consequence of deficient osseointegration and, at the 1st European
Workshop in Periodontology, its absence was consider to be a key criteria to implant success [3]. The case of a “falling” implant is defined by the continuous bone anchorage loss whereas a “failed” implant is one that is mobile. This problem can also be present with no distinctly radiographic signs of bone change making it more difficult to do an early diagnose. Considering that the body is a biological system, implant complications have multiple overlapping causes but can be summarized in infections, impaired healing and overload [4]. The first two, being strictly biological related are off the scope of the work here reported.
“Overload” is the name given for bone deformation due to excessive imposed mechanical stress. This term is more accurately related with the loss of bone supporting capacity in the implant surrounding area that eventually will lead to mobility and consequent implant failure. The ideal goal to address this problem would be to stimulate bone formation in order to regain implant support in the nearby affected areas. This is precisely why piezoelectric materials have been gaining such big interest in tissue engineering applications. It is known that electric phenomena exist in living tissues, but it is yet to be fully understood how it affects cell migration. Regardless, many studies indicate that electrical stimulation may cause enhanced bone density [5]. By taking advantage of body movement and a known complication with bone implants like overload, piezoelectric biomaterials might be able to transform the problem into a solution.
In order to approach the high standards imposed by the human body, bone in particular, this work examines the application of a composite material made of calcium doped barium titanate, synthesized by solid reaction route, and hydroxyapatite in order to mimic or excel the piezoelectric properties of bone and promote osseointegration. To achieve this purpose, it is necessary to:
Guarantee the tetragonality of the final material and enhance its piezoelectric properties.
Understand and limit the Curie point evolution with regards to calcium doping as well as the amount of hydroxyapatite used in the composite.
Ensure sample polarization.
3
2. Introduction
2.1. Piezoelectric Barium Titanate
Piezoelectricity was first discovered by Pierre and Jacques Curie in 1880 [6]. This property of materials generates an electric signal induced by a deformation (direct piezoelectric effect). The mechanical strain causes the asymmetric shift of ions or charges which induces a change in the electric polarization. Since it is known that an electrical stimulation, provided by mechanical stress, helps tissue regeneration there has been much interest in scaffolds made from piezoelectric materials for tissue engineering applications [2], [5], [7], [8].
Barium titanate (BaTiO3) was the first piezoelectric ceramic developed and as such it has been widely studied [9]. Mechanically and chemically very stable, it can be easily prepared and used as a polycrystalline ceramic. Structure wise belongs to the perovskite family (ABO3) that takes its name from CaTiO3, the mineral perovskite. The cubic crystal structure has an A-large cation in the corner with the coordination number 12, a B-smaller cation in the middle with the coordination number 6 and a anion, usually oxygen, located in the centre of the face edges [10]. BaTiO3 may have different crystallographic conformations [11]. At room temperature presents a ferroelectric tetragonal phase and at the Curie point, approximately 120 °C, undergoes a phase transformation to cubic that remains stable up to 1460 °C. Above this temperature changes to a hexagonal structure [12]. At the Curie point all the titanium ions are in equilibrium positions in the centre of their octahedra. As the temperature decreases and the tetragonal phase is stable, these ions jump between energetically favourable positions in the octahedron centre [10], like Figure 2.1.1 suggests.
Figure 2.1.1 (a) Perovskite cubic unit cell structure barium titanate presents above Curie temperature. Below Curie temperature it presents tetragonal structure where Ti4+ ion displacement will shift upward (b) and downward (c) [8].
A ceramic like barium titanate is an agglomeration of small crystals fitted in a random way. As it is cooled from high temperatures to the tetragonal phase, the unit cell deforms. In order to minimize intergranular stress, domains are formed. These are regions within each grain with a spontaneously oriented dipole. It is necessary a poling treatment to make barium titanate develop a piezoelectric response. This means, an electrical field must be applied to switch the polar axes of the crystallites to the directions which are nearest to the electrical field, giving it a net dipole moment as represented in annexe A, Figure A.1. As such, the material will respond linearly to applied electrical field or mechanical pressure like a single crystal. Although, considering the random orientated crystallographic directions in a ceramic, the orientation of polar axes cannot be as perfectly aligned as it is in a single crystal. Polarization measurements indicate the fraction of single crystal polarization that can be ideally done, in other words, the dipole alignment. Regarding the effect of field poling, the remanent alignment it causes is temperature and time dependent [13]. One of the reasons many ceramics do not reach full dipole orientation is intergranular stress because it prevents the domains from switching their initial polarity orientation to more favourable directions. Well poled barium
4
titanate has the ability of switching the domains up to 180° into the field direction without external shape change. This way it almost remains intergranular stress free thus presenting excellent polarization. The common symmetry these materials have when poled fixes the number of independent elastic, piezoelectric and dielectric constants needed to describe it completely [9]. The constants mentioned are strongly temperature dependent [14].
The first piezoelectric documented response of barium titanate was made in 1947 by Shepard Roberts [15]. Roberts was studying BaTiO3 dielectric response to biasing field strengths from 0 to 5 MV/m at different temperatures from -50 °C up to 135 °C and different frequencies. Samples above the Curie point of 120 °C followed the Curie-Weiss law for the electric susceptibility. However, for temperatures below the Curie point the same measurements indicated spontaneously polarized domains gave rise to hysteresis and remanence. By polarizing with a momentary strong electrical field at low magnetic field strength, a resonance spectrum appeared in the ceramics. The author concluded the resonance is attributed to the piezoelectric effect in polarized samples and measured the piezoelectric voltage developed upon squeezing a polarized sample of barium titanate with a vacuum tube electrometer. Despite no actual piezoelectric coefficient was measured, Roberts reports the piezoelectric voltage was found to be several volts for a force of several kilograms (not measured). Both electric field parallel to mechanical stress and electric field perpendicular to stress were observed. Some years later in 1971, the value commonly used for piezoelectric coefficient d33 of barium titanate was set to 190 pC N-1 at room temperature [9]. Since then various investigations aimed to increase this value and Shao et al. [16] reported d33 up to 419 pC N-1 of barium titanate prepared via solid state reaction method.
The conventional way to prepare barium titanate is by a solid state reaction method. It involves ball milling the analytical reagents such as BaCO3 and TiO2. The reaction starts in air by the initial formation of BaTiO3 at the BaCO3-TiO2 grain boundaries, after this the process is diffusion controlled. The reaction continues as BaTiO3 react to form Ba2TiO4 until BaCO3 is used up. The remaining TiO2 reacts with Ba2TiO4 to form BaTiO3. The formation of Ba2TiO4 can be restricted below 1100 °C by CO2 atmosphere [17]. This method may produce large BaTiO3 particles with irregular morphologies due to high reaction temperature and heterogenous solid phase reaction [18]. Therefore, solid state reaction despite being simple and low waste production method, the electrical properties of the final ceramic will not be optimized.
2.2. Piezoelectricity and biocompatibility compromise
The bone itself is a piezoelectric material as Yasuda an Fukada reported in 1957 [19] with a piezoelectric coefficient of 0,7 pC N-1 [20]. Its capacity of generating an electrical response from a mechanical stress is how bone tissue regeneration cells are biologically stimulated. Bone is a composite of densely packed aligned collagen fibrils containing hydroxyapatite particles [21]. Collagen is the most abundant mammalian protein and has a spiral structure consisting of a triple helice [22]. The piezoelectricity in tissues such as bone is attributed to the compact alignment of these highly ordered α-helice and their inherent polarization [23]. The study by Fukada and Yasuda concluded that bone piezoelectricity appears when the shearing force acts on the oriented collagen fibres that slip past one another. Even the micromechanical stress resulting from body movement is enough to generate an electrical dipole with an opposite electric charge that can attract calcium (Ca2+) and phosphate (PO43-) ions present in body fluid [24], thus stimulating growth and enhance the implant integration with the host bone according to Wolf’s law [5]. In addition the osteogenic activities which benefit bone healing are promoted by electrical signals [25].
5
Calcium titanate is another piezoelectric ceramic which has been used for biomedical applications and studies have confirmed that calcium titanate coatings on titanium implants promoted osteoblast adhesion compared to uncoated ones. Despite this, the same work reports results showing calcium titanate has poorer piezoelectric response than barium titanate [26]. In this sense doping barium titanate with calcium in a (Ba1-xCax)TiO3 mixture may become a good compromise between piezoelectricity and biocompatibility. Therefore, tailored piezoelectric materials such as barium titanate doped with calcium are very promising for improving the implant performance.
The work made by Han et al. [27] reports that Ca2+ prefers to occupy A-sites in BaTiO3 and will do so as long as Ba + Ca < Ti, but if Ba + Ca > Ti the Ca2+ ion could occupy B-sites. The site in which calcium ions can be integrated in barium titanate is hard to control. Zhuang et al. [28] studied the effect of Ca-acceptors on dielectric and conductivity properties of BaTiO3 and observed a decrease of tetragonal distortion of the perovskite unit cell, a lowering Curie point at the incorporation of Ca2+ ions on B-sites. Hennings et al. [29] confirmed that Ca2+ ions are shifted from A-sites to B-sites by influence of BaO-excess (A/B>1). Considering the mixture (Ba1-xCax)TiO3 Wang et al. [30] prepared a large range of different composites (0.2 ≤ x ≤ 1) and reported high piezoelectric properties in this composite for x = 0,23 being near to the solubility limit. Zhu et al. [31] also studied this mixtures and made composites from (Ba1-xCax)TiO3 (0 ≤ x ≤ 0.3) and reported the higher dielectric strength were obtained in the x = 0.75 composition.
2.3. Hydroxyapatite
The bone major component forming 60%-70% of its mass is called natural hydroxyapatite Ca10(PO4)6(OH)2 and is used under artificial form in many biomedical applications [32]. For many years the scientific community believed that hydroxyapatite could not be piezoelectric due to its crystallization in a centrosymmetric space group in the hexagonal system [33]. Although, in 2011 Lang et al. [34] made hydroxyapatite thin films spin-coated on silicon wafers and reported the first measurements of its piezoelectric coefficient (16 pC N-1), later in 2013 the same author demonstrated the piezoelectricity of sintered hydroxyapatite using PFM [35]. This can only suggest that hydroxyapatite, alongside collagen, contributes to the piezoelectricity of bone. Studies made in the beginning of the century like the one by Kobayashi et al. [36] found enhanced bone osteobonding and bone growth on polarized hydroxyapatite due to the generation of a permanent surface charge. The study reports bone growth is accelerated on negatively charged surfaces of polarized hydroxyapatite and decelerated on the positive surfaces. This may happen due to the absorption of Ca2+ ions that act as nuclei for calcium phosphate formation, but the mechanism is not clear. Plus electromagnetic fields accelerate bone growth as reported in studies about dielectric properties of hydroxyapatite [37]. Some work has been made in pursuit of establishing the best compound percentual relation in HP/BT composites. For instance, Zhang et al. [24] fabricated aligned porous scaffolds of HP/BT and reports that the composites made of 30%HP/70%BT and 10%HP/90%BT exhibited piezoelectric coefficient d33 of 1.2 and 2.8 pC N-1 respectively. In addition to these values being higher than the piezoelectric coefficient of bone, also both composites had no cytotoxic effects. The porosity is an important parameter knowing that a functional bone implant should be in a porous form to provide a favourable environment for bone ingrowth and osseointegration [38]. In agreement to the study previously referred Bowen et al. [39] concludes the increase of HP leads to the rapidly decrease of d33, but differs concluding that composites with BT percentage below 80% do not report significant piezoelectric response. In this sense, producing a composite by mixing hydroxyapatite and calcium doped barium titanate would improve the biocompatibility and increase osteobonding. All of these are characteristics of highly importance for the work we are proposing.
6
2.4. Sample preparation and characterization
This work prime goal is to study the best possible calcium doped barium titanate composition with regards to its piezoelectric properties and biocompatibility. Despite this, we will start by preparing barium titanate samples by the same solid state reaction method in order to have a reference sample for all the characterization ahead and to get acquainted with the compound behaviour. After, the calcium doped barium titanate samples are prepared, hydroxyapatite will finally be mixed. There is extensive information regarding the solid state reaction method [31], [40], [41], [42], [43], [44], [45]. Authors get better milling efficiency when using planetary ball with zirconium balls and ethanol. The time in planetary mill is between 2 to 12 hours. Calcination temperatures occur between 1000 °C and 1280 °C during 2 to 5 hours. The samples are pressed into disks with 10 mm to 15 mm diameter and 0.5 mm to 2 mm thickness by pressuring at 98 MPa to 200 MPa. Sintering temperatures may go from 1280 °C to 1500 °C during 2 to 10 hours. The addition of hydroxyapatite is made before sintering. Some authors do a two-step milling, before calcination and another one after calcination and prior to sintering. Most authors prepare samples with 1:1 molar ratio but not all, most of the times not mentioning the exact parameters for different molar ratios. Hence the different values in the parameters above. Special attention must be taken regarding the heating treatments samples undergo in both calcination and sintering. Milling time is another crucial parameter that appears in the literature with some value fluctuation. High energy ball milling will considerably reduce milling time [41].
To better understand the mixtures behaviour regarding the thermal treatments in calcination and specially sintering, one can analyse the phase diagrams of both BaTiO3 and BaTiO3-CaTiO3 as shown in annexe A, Figure A.2 and Figure A.3 respectively.
In order to characterize the mixtures regarding its properties, a series of analyses must be made as it was done in the literature mentioned above. Some of these are granulometry of the powders and mixtures to study average particle size, DSC to evaluate at which temperatures phase transformations occur. Mixtures behaviour throughout calcium substitution regarding Curie point determination can be described according to Curie-Weiss law. In equation (2.1), C is the Curie constant and T the absolute temperature. In equation (2.2), Tθ is the Curie temperature in the stressed state, T0 and C0 are the unstressed Curie temperature and constant respectively, (Q11+2Q12)0 is the value of the electrostrictive coefficient at zero temperature, α is the temperature coefficient and finally p is hydrostatic stress [28]:
𝜒 =
𝐶
𝑇 − 𝑇
(2.1)𝑇 =
𝑇 − 2𝜀 𝑝(𝑄
+ 2𝑄 ) 𝐶
1 + 2𝜀 𝛼𝑝(𝑄
+ 2𝑄 ) 𝐶
(2.2)Further structural analysis is required using XRD to identify the substitutional sites and crystal phase presence, SEM and RAMAN. Tests in vitro must be done in order to account for cytotoxicity so the samples can be labelled as qualified to polarization.
7
Thermally stimulated depolarization currents (TSDC) tests are a useful tool to describe the materials physical properties regarding polarization.
𝑄 =
1
𝛽
𝐽(𝑇)𝑑(𝑇)
(2.3)𝐽(𝑇) =
𝑑𝑃(𝑡)
𝑑𝑡
=
𝑑𝑃(𝑇)
𝑑𝑇
×
𝑑𝑇
𝑑𝑡
=
𝑃(𝑡)
𝜏(𝑇)
(2.4)𝑃(𝑇) =
1
𝛽
𝐽(𝑇)𝑑(𝑇)
(2.5)𝜏(𝑇) =
1
𝛽𝐽(𝑇)
𝐽(𝑇)𝑑𝑇 = 𝜏 exp
𝐸
𝑘𝑇
(2.6)From equation (2.3) the polarization charge Qp is calculated, heating rate is β and J(T) is the current density as a function of temperature.
During TSDC analysis no electrical field is applied, which means current density is given by equation (2.4) where dT/dt is the heating rate β, dP(T)/dT is the change in polarization with temperature [46]. Spontaneous polarization is given by equation (2.5). By equations (2.4) and (2.5) is possible to obtain the relaxation time τ(T) as described by equation (2.6).
2.5. Applications and challenges
Development of lead-free piezoelectric ceramics have been increasingly gaining interest for environment and biocompatibility reasons. Barium titanate comes as an obvious choice to be in the vanguard of such investigations due to its ability to form a strong interfacial bonding with bone and exhibits excellent biocompatibility [47]. Extended studies about in vitro biocompatibility made in 2013 by Ball et al. [7] clearly indicate barium titanate has good potential for orthopaedic tissue engineering applications. And studies by Ergun et al. [48] show that osteoblast (bone-forming cells) adhesion increased with greater CaTiO3 substitutions in either hydroxyapatite or tricalcium phosphate. Considering all the studies mentioned in this work, the applications in bone tissue engineering of calcium doped barium titanate mixed with hydroxyapatite are indeed very promising.
Some of the preliminary applications could be as dental implant coatings. Dental implants procedures have increased worldwide in the last 20 years, reaching about one million dental implants per year [49]. The early osseointegrations is closely related with the clinical success of the oral implants [50], in this sense our material has a clear helpful character. But the attractiveness of this material is not reduced to dental implants, many types of implants on different bone areas struggle with osteointegration and long term clinical success. A mixture of calcium doped barium titanate and hydroxyapatite might just be a solution.
9
3. Materials and methods
3.1. Analytical reagents characterization
Before beginning sample synthesis all the precursor reagents were analysed in order to understand their behaviour during preparation, in particular for milling and thermal treatments. DTA-TG (Linseis STA PT1600) under flowing air was done with powder samples weighing between 15 and 20 mg and heated up to 1200 °C with 10 °C min-1 heating rate. Granulometry analysis in water was done using Malvern Mastersizer Hydro 2000MU after sonicating each powder for 5 minutes. And X-ray diffraction via Rigaku-DMAX III-C 3KW and PANalytical X’Pert Pro-X-X-ray diffractometer was done in the interval 10° ≤ θ ≤ 60° with a 0.08° step. FTIR-Thermo Nicolet 6700 analysis was made to the analytical reagents in powder state.
3.2. Barium titanate and calcium doped BT synthesis
The analytical reagents, BaCO3 (99%), TiO2 (99%) and CaCO3 (99%) provided by Honeywell Fluka, Merch and Panreac respectively were used to prepare six mixtures of Ba(1-x)CaxTiO3 with x=0, 0.1, 0.15, 0.2, 0.3 named BT, BCT05, BCT10, BCT15, BCT20 and BCT30 respectively. After being carefully weight, accounting for molar ratio after calcination, the reagents were mixed using a turbula WAB System Schatz for 20 minutes. Milling in ethanol with zirconia balls followed for 3 to 12 hours using a planetary ball mill Pulverisette 6. The mixtures were dried for 24 hours at 60 °C and filtered through a 33 µm mesh in their powder state preventing aggregation in order to optimize CO2 release. Calcination was made at 1000°C during 4 hours in a Naber HT04116 oven. For scaffold preparation 0.5 mg of material was weighted and mixed with 40 µL of 5% PVA binder. Then pressed into 13 mm scaffolds under 150 MPa for 1 minute. Sintering in a tubular oven (TERMOLAB TH) was done between 1150 °C and 1450 °C with 5 °C min-1 heating rate in both air and N2 atmospheres for 2 hours. A schematic regarding sample production methods and chronology is in annexe B, Figure B.1.
Table 3.1 Summary of prepared samples and their sintering conditions
Sample name Theoretical composition temperature Sintering atmosphere Sintering
BT BaTiO3 1150 °C to 1450 °C Air and N2 BCT05 Ba0.95Ca0.05TiO3 BCT10 Ba0.90Ca0.10TiO3 BCT15 Ba0.85Ca0.15TiO3 BCT20 Ba0.80Ca0.20TiO3 BCT30 Ba0.70Ca0.30TiO3 BT/HP (90/10) (0.9) BaTiO3+ (0.1) Ca10(PO4)6(OH)2 1300 °C and 1350 °C Air BCT05/HP (90/10) (0.9) Ba0.95Ca0.05TiO3+ (0.1) Ca10(PO4)6(OH)2 BCT10/HP (90/10) (0.9) Ba0.90Ca0.10TiO3+ (0.1) Ca10(PO4)6(OH)2 BCT15/HP (90/10) (0.9) Ba0.85Ca0.15TiO3+ (0.1) Ca10(PO4)6(OH)2 BT/HP (80/20) (0.8) BaTiO3+ (0.2) Ca10(PO4)6(OH)2 BCT05/HP (80/20) (0.8) Ba0.95Ca0.05TiO3+ (0.2) Ca10(PO4)6(OH)2 BCT10/HP (80/20) (0.8) Ba0.90Ca0.10TiO3+ (0.2) Ca10(PO4)6(OH)2 BCT15/HP (80/20) (0.8) Ba0.85Ca0.15TiO3+ (0.2) Ca10(PO4)6(OH)2
10
The hydroxyapatite composites were done by carefully weigh HCa5O13P3 (99%) from Sigma-Aldrich in order to obtain 10% and 20% weight percentage of HP in the BT, BCT05, BCT10 and BCT15 mixtures. The materials were mixed in a planetary shaker mixer turbula for 45 minutes and pressed following the procedure mentioned in the paragraph above. Sintering in the tubular oven was made at 1300 °C and 1350 °C for 2 hours in air. Sample description is made in Table 3.1.
3.3. Sample characterization
During milling, granulometry analysis was done using the same equipment in the same conditions as the analytical reagents in order to understand the evolution of the average particle size along 3 hours milling process. Before calcination samples of all mixtures prepared in powder state were tested by the same DTA-TG used for the analytical reagents under the same conditions. After sintering the samples were submitted to different characterization techniques in order to study their atomic structures and crystallographic organization using the same X-ray diffraction equipment used for the analytical reagents in the 0°< θ <60° range using 0.08° step. FTIR-Thermo Nicolet 6700 analysis was made from 500 cm-1 to 5000 cm-1 for the analytical reagents and to the mixtures from 400 cm-1 to 4000 cm -1 after being mixed with KBr. RAMAN microscopy-Reninshaw Qontor was carried out with 1 second exposition and 0.5% of the 633 nm laser in the frequency range 0 to 1000 cm-1. Samples were cracked and gold coated for SEM/EDS using Carl Zeiss Auriga SEM and Oxford Instruments EDS respectively. To better understand the implications calcium doping would have in the Curie point DSC analysis were carried out, using DSC 204 F1 Phoenix from NETZSCH, on sintered samples heating from 25 °C to 200 °C at 5 °C min-1 rate.
3.4. Cytotoxicity tests
To evaluate samples cytotoxicity, the assays were performed according to standard ISO-10993 “Biological evaluation of medical devices, Part 5: Tests for in vitro cytotoxicity”. Using the extract method, Vero cells (monkey renal epithelial cells) and powder state samples sintered at 1350 °C. Readings were made by Biotek ELX 800 UV instrument. Detailed explanation is made in annexe J.
3.5. Polarization and TSDC
Polarization was made in University of Aveiro, using a corona system. Samples were heated up to 110 °C and a discharge potential of -15 kV was applied in order to measure -2 kV grid potential for 1 hour. Cooling occurred for 1 hour with the same potentials applied. The equipment used during polarization is showed in annexe B, Figure B.2. The TSDC tests were made placing the sample between two electrodes connected to an electrometer Keitlhey 617 in order to record current values meanwhile heating was done from room temperature to 250 °C at 5 °C min-1 rate.
3.6. Bioactivity tests
Materials ability to deposit on its surface phosphate ions PO3-4 and calcium ions Ca2+ was studied by ICP-AES and SEM/EDS analysis. Samples were immersed for 7 days in SBF (simulated body fluid), produced as explained in annexe L. Each recipient, kept at 37 °C and under agitation, was filled with ~250 ml of SBF in direct contact with the material. Two samples of 1 ml were collected in five different time intervals. The first interval was immediately before material immersion, followed by 24 hours, 48 hours, 96 hours and 168 hours. Upon SBF trial completion, ion concentration was analysed by ICP-AES and sample surface by SEM and EDS.
11
4. Results and Discussion
4.1. Analytical reagents CaCO
3, BaCO
3and TiO
24.1.1. Differential thermal analysis-Thermogravimetry
All three analytical reagents DTA curves are summarized in Figure 4.1.1. The DTA-TG analysis shows that BaCO3 mass loss starts at 600 °C and shortly after is possible to identify two endothermic peaks as annexe C, Figure C.1 confirms. The first one located at 810 °C is attributed to the transformation of orthorhombic witherite to rhombohedral phase. The second peak spotted at 964°C marks the transformation to cubic phase [51]. Up to 1200 °C BaCO3 has a 13% mass loss. Regarding TiO2, TG results indicate no mass loss during heating as manifested in annexe C, Figure C.2. Which means there is no chemical progression of any kind in contrast with what happens in both carbonate cases. The very large endothermic progression from 320 °C to 727 °C peaks at 751°C and subsequent exothermic directed progression to 922 °C is related with surface area decrease by crystallite growth, sintering and annealing of strains. The exotherm directed peaks at 956 °C are due to the anatase-rutile transformation. The following endothermic progression peaking at 1030 °C also presents an exothermic direction as follow-up revealing more crystalline growth and annealing of strains [52]. About CaCO3 mass loss is 22.6% beginning at 576 °C up to 850 °C as can be seen in annexe C, Figure C.3. This mass loss is accompanied by an endothermic large peak initiated at 694 °C, with 823 °C as maximum and ending at 858 °C. The peak in the thermogram described is related with the formation of lime (CaO) from calcite and decomposition of CO2 [53].
Figure 4.1.1 DTA analysis of the three analytical reagents BaCO3, CaCO3 and TiO2.
4.1.2. Granulometry and X-Ray diffraction
In order to better understand the milling process, it is necessary to analyse the starting point regarding average grain size of the analytical reagents. In this sense, by sonicating each reagent in
12
water, it was possible to identify three different average grain sizes. As shown in Figure 4.1.2, BaCO3 presented 6.6 µm particle size. The CaCO3 had 7.6 µm, and the smallest TiO2 indicated 0.6 µm.
Figure 4.1.2 Granulometry analysis of the three analytical reagents BaCO3, CaCO3 and TiO2.
Figure 4.1.3 XRD of BaCO3, CaCO3 and TiO2 powder. tetragonal anatase, rhombohedral calcite and l orthorhombic
witherite.
X-Ray diffraction of the analytical reagents in Figure 4.1.3 shows the three crystalline phases expected from non-sintered powder samples. Tetragonal anatase is correspondent to TiO2 diffractogram identified by ICDD 021-1272. Rhombohedral calcite is present in CaCO3 as ICDD 00-005-0586 suggests and orthorhombic witherite BaCO3 is finally identified by ICDD 00-045-1471.
13
4.1.3. FTIR
Given the fact that TiO2 is not a carbonate, its FTIR spectrum does not present clear peaks since carbon linked bands do not exist in this molecule thus there is no vibrations to be taken under consideration. On the other hand, CaCO3 and BaCO3 being carbonates, the vibrations these molecular links produced are present in their FTIR spectrum in Figure 4.1.4.
On CaCO3 analysis the peaks present in 879 cm-1 and 1424 cm-1 to 1492 cm-1 are related with the normal modes of vibration of planar XY3 molecules [54]. The peak spotted at 3639 cm-1 is probably due to a combination band where two fundamental bands absorb at two different energy simultaneously or an overtone of the band indicated by the first peak. Regarding BaCO3 the peaks shown at 692 cm-1, 857 cm-1, 1059 cm-1 and 1749 cm-1 are attributed to the stretching and deformation vibration modes of carbonate ions [55]. Once again, the low frequency peak at 2452 cm-1 is likely related to overtone or combination band.
Figure 4.1.4 FTIR analysis of each BaCO3, CaCO3 and TiO2 analytical reagents in powder state.
4.2. Calcium doped BT mixtures
4.2.1. DTA-TG and Granulometry
The thermal behaviour of BT endothermic progression associated with weight loss from 813 °C to 940 °C is attributed to the continuous transformation of orthorhombic BaCO3 to rhombohedral phase and subsequent formation of BaTiO3 according to equation (4.7), hence such a large endothermic domain. Weight loss of 11% starts at 714 °C and endures up until 943 °C related with CO2 release [56]. The formation of Ba2TiO4 according to equation (4.8) is also likely to happen knowingly that the powder was not calcinated before DTA-TG analysis. These reactions overlap and that is probably the reason why in Figure 4.2.1 is noticeable a very large endothermic region [57]. This proves the importance of an efficient calcination process if no reductive atmosphere is to be used during sintering.
14
BaCO3 + TiO2 → BaTiO3 + CO2 (4.7)
BaTiO3 + BaCO3 → Ba2TiO4 + CO2 (4.8)
Regarding BCT30 sample, the TG curve shows a continuous weight loss of 20% from 580 °C to 932 °C. There is an exothermic peak at 611 °C that is present in the thermograms of all mixtures containing calcium as annexe C, Figure C.4 proves. The exothermic peak mentioned is related with crystallization of the calcite phase after completing thermal dehydration [58]. From BT to BCT20 sample thermograms show a very similar endothermic behaviour presenting a very large region stretching from 820 °C to 940 °C implying there are multiple overlapping reactions taking place at those temperatures, not only equation (4.7) and equation (4.8), but also the formation of Ba1-xCaxTiO3 according to equation (4.9). BCT30 is the only sample to present a narrower endothermic region peaking at 890 °C. According to XRD results present in section 4.2.2, this might be due to the formation of orthorhombic CaTiO3 according to equation (4.10), indicating there is a limit to which calcium can dope barium titanate without compromising its structure by forming different phases. Weight loss of all samples are listed in Table 4.2. There is a clear increasement of mass loss from no calcium substitution to 5% molar substitution. In section 4.1.1, DTA-TG analysis of the carbonate analytical reagents show there is more mass loss in CaCO2 than in BaCO2. Suggesting the presence of calcium in the mixture should translate in larger mass loss. These values maintain throughout the remaining samples except for BCT15.
(1-x) BaCO3 + (x) CaCO3 + TiO2 → Ba1-xCaxTiO3 + CO2 (4.9)
CaCO3 + TiO2 → CaTiO3 +CO2 (4.10)
Figure 4.2.1 BT and BCT30 differential thermic analysis in order to compare the behaviour of the highest calcium substituted material and no calcium substituted material.
15
A study regarding the weight loss during calcination at 1000 °C for 4 hours was also made. The results present in Figure 4.2.2 show that as the molar percentage of calcium increases so does the weight loss. These results, as mentioned before, indicate that CaCO3 is more reactive to high temperature than BaCO3 in the sense that more CO2 is released. This goes in agreement with the results given by TG analysis of BT and BCT30. But there is an important factor to be taken under consideration regarding weight loss, that is average particle size. From Table 4.2 the average particle size in BT and BCT30 are both 3.8 µm after 3 hours milling but this is not true for BCT15, that presents 5.0 µm size and loses 10% weight during DTA analysis. Smaller particle size implicates larger surface area in contact with hot air, for that reason it increases temperature reactivity. Since the samples submitted to DTA-TG analysis did not went under calcination process before being heated up to 1200 °C, samples containing calcium lose more weight during heating.
Table 4.1 Granulometry analysis results for milling time and correspondent average particle size of BT mixture.
Mixture BT
Milling time (hours) 3 6 9 12 Average particle size (µm) 3.8 3.3 2.9 1.5
Figure 4.2.2 Mass loss (%) in function of calcium presence along the calcination process with a 5 °C min-1 heating rate from
room temperature up to 1000 °C remaining at the highest temperature for 4 hours.
The BT mixture was first ball milled up to 12 hours with samples being taken every 3 hours for particle size analysis. Results showed an evolution from 3.8 µm to 1.5 µm between the interval. The following results reported in this work are made from mixtures ball milled for 3 hours. Table 4.1 shows the relation between average particle size and milling time for BT mixture.
Table 4.2 Average particle size (µm) for every mixture prepared. Results were obtained by granulometry analysis made in water.
Mixture BT BCT05 BCT10 BCT15 BCT20 BCT30 Average particle size (µm) 3.8 3.8 3.6 5.0 2.9 3.8 Weight loss up to 1200 °C (%) 11 19 20 10 23 20
16
4.2.2. X-Ray Diffraction
Analysing Figure 4.2.3 is noticeable that tetragonality in BT is assured (ICDD – International Centre for Diffraction Data 05-0626) and there is no evidence that using N2 atmosphere during sintering might significantly change crystal structure since the peaks found in both samples are the same. Although, for BCT30 samples, there is clear presence of a tetragonal Ba1-xCaxTiO3 specimen, it is also spottable orthorhombic CaTiO3 (ICDD 22-0153) indicating that CaCO3 did not react to full extend forming Ba0.7Ca0.3TiO3 and instead CaTiO3 residue was left. Just like BT samples, BCT30 diffractogram does not indicate any variability between air and N2 atmosphere during sintering regarding tetragonality assurance or supressing CaTiO3 formation [59]. Another important remark is the existing shift to higher angles on BCT30 samples. This means the cell unit volume is shrinking and it can be explained by Ca2+ ions presenting smaller ionic radius and replacing Ba2+ with bigger ionic radius at CN = 12 site in BaTiO3 lattice maintaining a tetragonal phase [31].
Sintering temperature plays an important role in crystal conformation and as such, tetragonal phase is better achieved and maintained when samples are submitted to high temperatures during sintering [45]. This importance becomes clear in X-ray diffraction, since the evolution of sintering temperatures from 1150 °C to 1350 °C is accompanied by the formation of two double peaks on the diffractograms near 2θ values of 45° and 57° as annexes E, Figure E.1 and Figure E.2 show. In the first figure (E.1) there are different diffractograms of BT mixture are present, temperatures from 1150 °C to 1250 °C show peaks correspondent to cubic BaTiO3 identified by ICDD 031-0174. Diffractograms of samples with sintering temperatures above 1300 °C have both distinguished double peaks that identify tetragonal BaTiO3 by ICDD 01-083-1878. The second figure (E.2) shows a similar evolution as mention above, but in this case the second double peak located around 2θ = 57° is not so evident. Moreover, there is some small peaks indicating the presence of orthorhombic CaTiO3 unrelated with sintering temperature evolution as expected.
Figure 4.2.3 X-Ray diffraction of BT and BCT30 mixtures sintered at 1350 °C in both air and N2 atmospheres. tetragonal
17
The remaining 1350 °C sintered mixtures diffractograms do not show signs of either CaTiO3 or tetragonality loss. Despite this, there is a double peak formation from a single peak only on sample BCT15 located close to 2θ = 38° presented in annexe E, Figure E.3. It might indicate the presence of TiO by ICDD 98-0020-3331. These results show there is an incomplete solid solubility of Ca2+ in BaTiO3 lattice on, at least, BCT30 samples.
4.2.3. FTIR
Figure 4.2.4 FTIR analysis of every Ba1-xCaxTiO2 compounds mixed with KBr.
In Figure 4.2.4 FTIR analysis of samples sintered at 1350 °C are shown. In BT spectrum there is a strong absorption peak at 532 cm-1 attributed to the stretching vibration of Ti-O bond, these modes of vibration and the spectrum are represented in annexes F, Figure F.2 and Figure F.1 respectively. There is great importance in this stretching normal vibration mode since its direction is the same as spontaneous polarization of tetragonal BaTiO3 phase [60]. The FTIR spectrums of Ba1-xCaxTiO3 (0 ≤ x ≤ 0.3) mixtures are similar but BCT05 absorption peak wave number is smaller than BT, the first is 529 cm-1 and the last 532 cm-1. XRD analysis in section 4.2.2 show a tetragonal perovskite structure (ABO3). As such, when Ca2+ ions are doped most occupy A-site substituting Ba2+ but some occupy B-sites where Ti4+ was present before. This last substitution implies a weaker coulomb interaction with O2- ions since the old electrical charge of Ti4+ is greater than the new Ca2+, resulting in an energy decrease of O-B (B is the ion at B-site) bond [61].
Figure 4.2.4 also shows that from BCT05 to BCT30, the increase of Ca percentage reflects in a wave number increment from 529 cm-1 to 553 cm-1. The unit cell volume decreases due to preferable substitution of Ca in A-site, as confirmed by XRD results. The increasing Ca substitution is associated with angle value increments proving there is crystal planes approximation by ion radius shortage since Ca2+ has a smaller ionic radius than Ba2+. As a result, Ti-O bonds also shorten shifting the aborting peaks in FTIR spectrum to higher frequencies. Figure 4.2.5 shows absorption peaks in function of Ca percentage in the mixture [61].
18
Figure 4.2.5 Relation between FTIR absorption peaks and calcium substitution.
4.2.4. RAMAN
For samples sintered at 1350 °C, Figure 4.2.6 presents barium titanate RAMAN spectrum at room temperature and it shows optical phonon frequencies and their mode symmetry assignments (some presented in annexe G, Figure G.5) in BaTiO3 that indicate tetragonality characteristic such as 168 cm-1 A1[TO2], 266 cm-1 A1[TO1], 309 cm-1 B1 and E[TO+LO], 470 cm-1 A1[LO], 520 cm-1 A1[TO4] and 720 cm-1 A1[LO] [62], [63]. The introduction of calcium in the mixture reflects on the spectrum in different senses like, the vibration mode A1[TO1] (168 cm-1 for BT sample) peak shifts to lower frequencies and both B1 and E[TO+LO] peak (309 cm-1 for BT sample) become larger to the point of being unnoticeable, as annexe G, Figure G.1 suggests. These evolutions go in agreement with previous studies [64] that point to changes on phonon vibrations of Ti-O bonds due to Ca2+ presence. Another important alteration, as calcium fraction increases, is the sift to higher frequencies of A1[TO4] and A1[LO] correspondent to 720 cm-1 peak in BT. In this case local disorder regarding Ti4+ position due to the substitution of ions with different radius and subsequent force constant increase are responsible for peak shifting to higher frequencies and broadening [64].
If there was significant substitution of Ca2+ ions in Ti4+ site it should be noticeable a peak close to 800 cm-1 A1g octahedral breathing mode since it is RAMAN inactive for single B-site species [65]. There is no evidence on what was mentioned before and alongside with XRD and FTIR, Raman analysis indicates the large majority of Ca2+ ions are substituting Ba2+ ions and not Ti4+ on Ba1-xCaxTiO3. Despite this, it is important to notice BCT20 and BCT30 show almost no evidence of some tetragonal optical phonon vibrations like B1 and E[TO+LO], also these samples show large shift and broadening of key peaks like the ones corresponding to A1[TO1] modes of vibration. Indicating their tetragonality is somewhat doubtful. Annexe G, Figure G.2 has the mixture spectra that maintain all the peaks.
Raman microscopy of every unpolished sample reveals very heterogenous grain size throughout the same sample confirmed by annexe G, Figure G.4. It is also noticeable the average grain size in BT is greater than BCT05 and BCT10. BCT15 has similar size to BT but decreases for BCT20 and BCT30. It is possible to clarify there is no significant difference in the Raman spectrum of samples sintered at 1350 °C and 1450 °C, comparing annexe G, Figure G.1 and Figure G.3 confirms.
19
Figure 4.2.6 Raman analysis of BCT30, BCT15 and BT samples.
4.2.5. DSC
The following measurements were made after the structural studies mentioned before in order to understand the temperature evolution at which structural transformation takes place from tetragonal phase to cubic (i.e.) Curie point along calcium substitution. The following samples were previously sintered at 1350 °C. Taking into consideration Tc values were obtained while heating the samples and not cooling, the results are represented in Figure 4.2.7. BT sample show Tc of 125 °C as literature suggests [9]. As expected, small amounts of calcium substitution up to 15 molar percentage, show little to no difference regarding the evolution of Tc. Nonetheless, BCT20 and BCT30 peaks present broadening and a shift toward lower temperatures like 118 °C and 111 °C respectively. Figure 4.2.8 represents the direct relationship between Tc and calcium substitution. The notorious effect in BCT20 and BCT30 is caused by lattice distortion confirmed by XRD, FTIR and Raman analysis. It was discussed above that despite the majority of Ca2+ ions are replacing Ba2+ ions, there is some residual quantity of the first ions replacing Ti4+ in the unit cell. This residual percentage of B-site occupation logically increases with the increasing calcium substitution. It is possible to understand the unit cell deformation caused by a compressive stress p on the adjacent unit cell due to substitution as shown in annexe H, Figure H.1.
Looking at equation (2.2) in section 2.4, it becomes obvious the Curie temperature under stress Tθ will decrease linearly while the hydrostatical stress p increases, just like what the DSC results here reported suggest.
It seems to be clear there is a calcium substitutional limit in Ba(1-x)CaxTiO3 if the objective is to ensure the material tetragonal characteristics. Taking into consideration the studies made so far in this report, that limit must be under 20% molar substitution of calcium. Which leaves BT, BCT05, BCT10 and BCT15 the samples where is possible to assure tetragonal phase characteristics are not compromised making it possible to polarize and be piezoelectric efficient. In addition, the effect of
20
sintering temperature on tetragonal to cubic phase transitions in both BCT20 and BCT30 is clarified by the absence of clear peaks on DSC spectrums indicating the difficulty in achieving tetragonal phase at room temperature if samples are not submitted to sintering temperatures above 1300 °C as demonstrated in annexe H, Figure H.2 and Figure H.3
Figure 4.2.7 Differential scanning calorimetry analysis to all the Ba1-xCaxTiO2 mixtures in order to obtain the Curie point for
each one.
Figure 4.2.8 Evolution of Curie point in function of calcium molar percentage.
It might be possible to achieve a stable tetragonal phase with relative elevated Curie point for Ba(x-1)CaxTiO3 with x > 15% but it requires much higher sintering temperatures. This way, atoms may have enough time and energy to arrange themselves in the unit cell without increasing hydrostatic
21
pressure too much and consequently decreasing Curie point to the point of almost inexistence as BCT30 in Figure 4.2.7 demonstrates. However, there are other obstacles regarding high temperature sintering in order to optimize piezoelectric properties like over-sized grain domains that promote back switching [66], jeopardizing polling treatments efficiency and thus the material main purpose.
4.2.6. SEM and EDS
Figure 4.2.9 SEM showing different grain sizes in Ba(1-x)CaxTiO3 0 ≤ x ≤ 0.3 .
Calcium doped barium titanate mixtures under SEM in Figure 4.2.9 show a decrease of grain size as calcium presence increases, which agrees with the information present in the literature [31], [67]. A similar effect using barium titanate produced by two-step sintering is reported by Zhao et al [68]. This author states that smaller and specially more uniform grain size will result in higher breakdown strength and internal resistance, since there is a more homogenous electrical field concentration along the sample if grain size is more uniform. In this work, however, the cause for grain uniformization is the presence of calcium as an impurity and not improvement of sintering efficiency on the same material. More calcium appears to inhibit grain growth, thus resulting in a more uniform grain size distribution as calcium percentage increases. Sample BCT15 SEM image on Figure 4.2.9 shows larger grain size probably to higher particle size after milling as mentioned in section 4.2.1 and seems to have a different phase formation between grains. This may be due to TiO presence confirmed by XRD, as shown in annexe E, Figure E.3.
Some samples like BT, BCT15 and BCT30 surface after being polished using down to ¼ µm diamond paste are shown in annexe I, Figure I.1. It is clear there is some porous with heterogenous sizes and shapes, but overall samples do not reveal a high porosity. Sample BCT30 SEM image has noticeable small darker shapes that indicate, via EDS mapping and quantification, the presence of high calcium formations in annexe I, Figure I.2. These results combined with what can be found in XRD analysis in section 4.2.2 confirm the possibility of CaTiO3 phase formation.
4.2.7. Cytotoxicity
These assays were done using extraction method where Vero cells are put in contact with medium where the different samples were incubated in. After 48 hours in the incubator, a viable cell