CERN-PH-EP/2013-037 2015/09/15
CMS-SMP-13-013
Measurement of the Z boson differential cross section in
transverse momentum and rapidity in proton-proton
collisions at 8 TeV
The CMS Collaboration
∗Abstract
We present a measurement of the Z boson differential cross section in rapidity and transverse momentum using a data sample of pp collision events at a centre-of-mass
energy√s = 8 TeV, corresponding to an integrated luminosity of 19.7 fb−1. The Z
boson is identified via its decay to a pair of muons. The measurement provides a precision test of quantum chromodynamics over a large region of phase space. In addition, due to the small experimental uncertainties in the measurement the data has the potential to constrain the gluon parton distribution function in the kinematic regime important for Higgs boson production via gluon fusion. The results agree
with the next-to-next-to-leading-order predictions computed with theFEWZprogram.
The results are also compared to the commonly used leading-order MADGRAPHand
next-to-leading-orderPOWHEGgenerators.
Published in Physics Letters B as doi:10.1016/j.physletb.2015.07.065.
c
2015 CERN for the benefit of the CMS Collaboration. CC-BY-3.0 license ∗See Appendix A for the list of collaboration members
1
Introduction
The production of lepton pairs in proton-proton collisions is dominated by the Drell–Yan (DY)
process i.e. the production of an intermediate γ∗/Z boson by the incoming partons.
Mea-surements of the cross sections as a function of the mass of the intermediate boson (hereafter referred to as the ‘Z boson’), rapidity, and transverse momentum provide a very sensitive test of quantum chromodynamics (QCD). Precise measurement of the differential cross section also allows comparisons to calculations employing different parton distribution functions (PDF) and underlying theoretical models. Finally, the understanding of DY lepton pair production is important in the study of several physics processes, such as diboson and tt production, as well as in searches for new resonances decaying to dileptons in models of physics beyond the standard model. Differential measurements of Z boson production at the LHC have already been performed [1–8].
In this Letter we present the first measurement of the DY cross section at a centre-of-mass en-ergy of 8 TeV for dimuon pairs in the vicinity of the Z boson peak, doubly differential in the
transverse momentum qTand in the rapidity y of the Z boson. The analysis uses the data
sam-ple of pp collisions collected with the CMS detector at the LHC in 2012, corresponding to an
integrated luminosity of 19.7 fb−1. We present the absolute fiducial cross section and the
fidu-cial cross section normalised to the inclusive fidufidu-cial cross section. The measurement probes
the production of Z bosons up to high transverse momenta, qT ∼ 100 GeV, a kinematic regime
where the production is dominated by gluon-quark fusion. The precision of this measurement leads to experimental uncertainties smaller than or similar to the uncertainties of the gluon PDF in the kinematic region that is relevant to the production of the Higgs boson via the gluon fusion mechanism. Using the Z boson production process to constrain the gluon PDF [9] in the future would be complementary to other processes such as direct photon production [10] and top-quark pair production [11] that constrain the gluon PDF in this regime. Moreover, sev-eral of the experimental systematic uncertainties in the DY measurement are uncorrelated with these other processes. The latter have more complex topologies and thus have complementary and potentially larger systematic uncertainties.
2
The CMS detector
A more detailed description of the CMS detector, together with a definition of the coordinate system and the relevant kinematic variables, can be found in Ref. [12]. The central feature of the CMS apparatus is a superconducting solenoid of 6 m internal diameter, providing a mag-netic field of 3.8 T. Within the solenoid volume are a silicon pixel and strip tracker, a lead tungsten crystal electromagnetic calorimeter (ECAL), and a brass/scintillator hadron calori-meter (HCAL), each composed of a barrel and two endcap sections. Muons are measured in gas-ionisation detectors embedded in the steel flux-return yoke outside the solenoid. Extensive forward calorimetry complements the coverage provided by the barrel and endcap detectors.
Muons are measured in the pseudorapidity range|η| <2.4, with detection planes made using
three technologies: drift tubes, cathode strip chambers, and resistive-plate chambers. Matching
muons to tracks measured in the silicon tracker results in a relative pT resolution of 1.3–2.0%
in the barrel and better than 6% in the endcaps, for muons with 20 < pT < 100 GeV. The pT
resolution in the barrel is better than 10% for muons with pTup to 1 TeV [13]. The particle-flow
event reconstruction [14, 15] is used in this analysis. It works by reconstructing and identify-ing each particle with an optimised combination of all subdetector information. The energy of photons is directly obtained from the ECAL measurement, corrected for zero-suppression effects. The energy of electrons is determined from a combination of the track momentum at
2 4 Event selection
the main interaction vertex, the corresponding ECAL cluster energy, and the energy sum of all bremsstrahlung photons. The energy of muons is obtained from the corresponding track momentum. The energy of charged hadrons is determined from a combination of the track momentum and the corresponding ECAL and HCAL energies, corrected for zero-suppression effects, and calibrated for the nonlinear response of the calorimeters. Finally, the energy of neu-tral hadrons is obtained from the corresponding calibrated ECAL and HCAL energies. The first level of the CMS trigger system, composed of custom hardware processors, uses information from the calorimeters and muon detectors to select the most interesting events in a fixed time interval of less than 4 µs. The high-level trigger processor farm further decreases the event rate from around 100 kHz to around 400 Hz before data storage.
3
Simulation
The signal process is simulated using the leading-order (LO) MADGRAPH1.3.30 [16] generator
with 0–4 additional jets, interfaced withPYTHIA[17] v6.4.24 with the Z2* tune [18]. The
match-ing between matrix element calculation and parton shower is performed with the kT-MLM
al-gorithm [19]. Multiple-parton interactions are accounted for viaPYTHIA. The LO CTEQ6L1 [20]
PDF set is used for the generation. As a cross-check, a second signal sample is simulated using
the next-to-leading-order (NLO) POWHEG[21–24] generator interfaced with PYTHIA. For this
generation the NLO CT10 [25] PDF set is used.
The backgrounds are generated with MADGRAPH(W+jets, tt, ττ), POWHEG(single top quark
[26, 27]), andPYTHIA(dibosons, WW, WZ, ZZ). The inclusive cross sections of DY, W+jets [28],
and tt [29] processes are normalised to next-to-next-to-leading-order (NNLO) predictions. In addition, for the single top quark a higher-order (approximate NNLO [30]) inclusive cross section is used. The generated events are passed through a detector simulation based on
GEANT4 [31]. The simulated processes are overlaid with minimum bias collisions in order
to reproduce the distribution of the number of additional proton-proton interactions per bunch crossing (pileup) present in data.
In addition, for comparison with the final result the double differential cross section is
com-puted withFEWZ3.1.b2 [32] at NNLO. The electroweak corrections are computed at NLO and
initial-state photon radiation and photon-induced processes are included in the generation.
The computation is done for each qT bin separately. The factorisation and renormalisation
scales are chosen as
√
M2Z+q2T, where MZis the mass of the Z boson and qTis the value of the
lower edge of the corresponding bin in qT. For the computation the NNLO NNPDF23 PDF set
with radiative corrections [33] is used.
4
Event selection
An isolated single-muon trigger is used with a threshold of pT >24 GeV and a requirement of
|η| < 2.1. The standard CMS baseline offline muon selection [13] is applied. It requires that
the muon candidate is reconstructed both in the muon detectors and in the inner tracker, with
χ2/ndof < 10 for the track fit. In addition, requirements are placed on the minimum number
of pixel and tracker layers that are hit and on detailed matching criteria between the trajecto-ries reconstructed in the inner tracker and the muon system. The distance between the muon candidate trajectory and the primary vertex is required to be smaller than 2 mm in the trans-verse plane and smaller than 5 mm in the longitudinal direction. The vertex with the highest
sum of p2T of associated tracks is selected as the primary vertex. The leading reconstructed
acceptance, the leading muon is selected with pT >25 GeV and|η| <2.1. The second muon is
required to have pT > 10 GeV and|η| <2.4. The relative isolation is defined to be the scalar
sum of the transverse momenta of charged hadrons, neutral hadrons, and photons in a cone
of ∆R = √(∆η)2+ (∆φ)2 < 0.4 around the muon direction, divided by p
T. After correction
for pileup, the value of the relative isolation is required to be less than 0.12 (0.5) for the lead-ing (second) muon. A pair of oppositely charged muons is required to have an invariant mass
M(µµ)between 81 and 101 GeV. In the rare case of ambiguity among several reconstructed
muons, the muon pair with the invariant mass closest to the Z boson mass is selected. The
absolute rapidity|y|of the muon pair must be less than 2.
Scale factors are applied to account for known differences between data and simulation. The efficiencies for the tracking, the trigger, the muon isolation and identification are determined via a “tag-and-probe” method [34]. The tracking efficiency is measured in bins of η. The trigger
efficiency is measured in bins of muon pT and η for positive and negative muons separately.
The identification efficiency is measured in bins of pT and η. In particular phase space
re-gions, especially for higher qT, the second muon can often point opposite to the Z boson in
the azimuthal plane. In that direction, the hadronic activity from the recoil of the Z boson is enhanced. Thus the second muon is often less isolated than the leading muon and the isolation depends on the event kinematics. For that reason, the requirement for the isolation of the sec-ond muon is looser than the requirement for the leading muon, and the efficiency is measured in variables reflecting the second muon direction with respect to the Z boson. Three variables for the second muon are chosen to measure this effect on the efficiency in data: the transverse
momentum of the dimuon system qT, the cosine of the polar angle cos θ∗ and the azimuthal
angle φ∗. The two angles are measured in the Z boson rest frame, where the z axis is the Z
boson flight direction. For cos(θ∗) = −1 the leptons are more likely to be close to the hadronic
recoil. The azimuthal angle is chosen to be zero for the proton closest to the z axis in this frame.
The isolation efficiency for the leading muon is measured in bins of pTand η. These efficiencies
are measured in data and simulation, and scale factors are applied to the simulation to account for differences with respect to the data.
The backgrounds are small relative to the signal (at the percent level or smaller) and can be divided into two categories: those where the leptons come from Z boson decays and those where the leptons stem from other sources. The backgrounds from tt, ττ, WW, tW, and W+jets are estimated from specific data samples. Backgrounds typically have two prompt leptons, al-though not necessarily of the same lepton flavor: flavor universality is used for the background estimation. The estimation consists of two steps. First, the oppositely charged mixed lepton eµ yields are measured in both data and MC. Then the ratio of the yields in data and simulation in this data sample (eµ channel) is used to normalise the simulation in the muon channel. The eµ-channel selection uses the same trigger as the final sample, thus the same trigger efficiency scale factor is used. In addition, the tracking, the identification, and the isolation efficiency scale
factors for the leading muon are applied. Electrons are selected if they have pT(e) > 20 GeV
and|η(e)| < 2.1, which is similar to the fiducial regions of the muon selection. No
data-to-simulation correction factors are applied to the electron identification since the effect on the final results is negligible. In order to enhance the statistical precision, the invariant mass range
of the eµ pairs is increased to [60,120] GeV. Within the uncertainties, no significant trend in qT
and|y| is observed in the ratio of the eµ yields in data and simulation, and a constant scale
factor of 0.987±0.008 is used. The WZ and ZZ backgrounds, which include a true Z → µµ
4 6 Systematic uncertainties
5
Measured observables and granularity
The reconstructed and background-corrected double differential distribution in qT and|y| is
unfolded to pre-final-state radiation (FSR) lepton kinematics. The unfolding is performed to
the kinematic region 81≤ M(µµ) <101 GeV and within the kinematic selection of the leading
(second) muon, pT > 25(10)GeV and|η| <2.1(2.4). The unfolding is done using an iterative
unfolding technique [35] implemented in the RooUnfold package [36]. The bins in qTare [0,20],
[20,40], [40,60], [60,80], [80,100], [100,120], [120,140], [140,170], [170,200], [200,1000]. In |y| a
constant bin width of 0.4 is used and the binning ends at 2.
MADGRAPHis used as simulation input to the unfolding. The unfolding is validated by
treat-ing the simulatedPOWHEGsignal sample as data. The unfoldedPOWHEGdistribution is found
to be compatible with the distribution at the generator level within unfolding uncertainty.
6
Systematic uncertainties
The sources of systematic uncertainty are ordered by their average size starting with the largest one. The full covariance matrix is computed for both the normalised and the absolute cross section.
• Luminosity uncertainty:
The uncertainty in the measurement of the integrated luminosity is 2.6% [37].
• Tracking, muon trigger, isolation, and identification efficiency correction factors:
A potential bias in the measurement of the efficiencies with the tag-and-probe tech-nique is estimated by varying the most sensitive components: the background in simulation is removed and doubled; the signal is parametrised with the sum of two Voigtian functions instead of the sum of a Crystal Ball and a Gaussian function; the efficiencies are parametrised only in η but with finer bins; and, only tags with a sin-gle available probe are selected for the measurement instead of all possible pairs. For each contribution a 100% correlation is assumed in the covariance matrix. The effect of statistical uncertainties in the measured data-to-simulation scale factors is esti-mated by their variation within the uncertainties in a series of pseudo-experiments. Combining the effects extracted from these variations, the systematic uncertainties
are typically between 1% and 1.6%, depending on the bin, and increase with qT.
• Pileup uncertainty:
The cross section of minimum bias events is varied by±5% and the impact of the
pileup multiplicity in the simulation on the measurement is used as correlated un-certainty for all bins. This unun-certainty is at maximum around 0.5% and is negligible compared to the leading uncertainties.
• Statistical uncertainties of the simulation:
The uncertainty due to the limited number of events in simulation is estimated via pseudo-experiments by varying the response matrix and the efficiency within the statistical uncertainties.
• FSR:
The simulation is reweighted to reflect the difference between a soft-collinear ap-proach and the exact O(α) result, similar to what was done in Ref. [34]. It also reflects effects from higher-order contributions. The difference between the measurements with and without the reweighting is assigned as an uncertainty and is assumed to be fully correlated for the covariance matrix.
• Backgrounds:
• tt,tW, WW, W+jets, and ττ backgrounds:
A 10% uncertainty is assigned to the scale factor derived in the eµ method. This accounts for the statistical uncertainty of the scale factor and for the uncertainties in the lepton efficiencies. For the covariance matrix full cor-relation is assumed.
• WZ and ZZ backgrounds:
The diboson backgrounds that include a Z boson are determined from simulation. The cross sections are varied by 50% to estimate the system-atic uncertainty. While the inclusive cross sections have been measured to agree reasonably well [38–40], we assign conservatively 50% to account
for the fact that we use the qT and|y|shapes from LO calculations.
• Muon momentum resolution:
The muon momentum resolution is measured in data and simulation, and corre-sponding corrections are applied. The covariance accounting for the statistical un-certainty of the muon momentum correction measurements is calculated via pseudo-experiments. In addition, an uncertainty is assigned to take into account possible correlated offsets.
• Z boson polarisation:
The lepton angular distribution of the Drell–Yan process can be described at LO
through the coefficients, A0–A4[41]. However, inaccuracies in the way this is
mod-elled in the simulation can affect the result of the unfolding. The angular coefficients
A0–A4are inferred in bins of qTand|y|in [42] for both data and simulation we use.
For each parameter Ai the simulation is independently reweighted to correspond to
the data as measured in [42]. In case the difference in Ai is smaller than the typical
theoretical uncertainty of 10% [43] Aiis varied by 10%. The full difference between
the default polarisation and the changed polarisation is assigned as systematic un-certainty. Full correlation is assumed between the bins.
• qT and y shapes:
The dependence of the results on the qTand y shapes of the simulation is studied by
repeating the analysis usingPOWHEGas the signal sample. The results obtained
us-ing MADGRAPHorPOWHEGfor the unfolding are compatible with each other within
the statistical uncertainties. In addition, the MADGRAPH simulation is weighted in
fine bins in qT and y to match the background-corrected data. The effect on the
result using the reweighted simulation for the unfolding is much smaller than the uncertainties assigned to the limited statistics of simulation and is neglected.
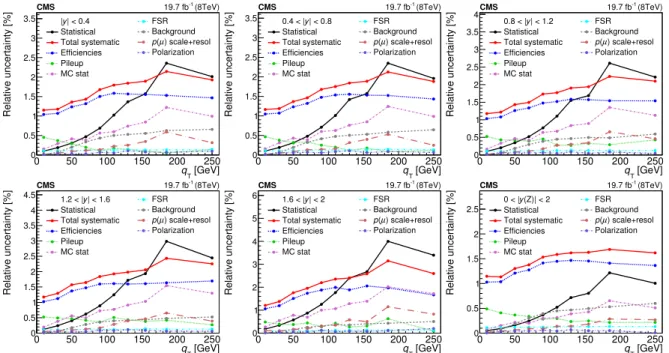
The contributions of the uncertainties to the normalised cross section measurement are pre-sented in Fig. 1. The systematic uncertainty is dominated by the uncertainty in the efficiency
correction. In the highest bins of qTthe measurement is dominated by the statistical
uncertain-ties. The uncertainty contributions to the absolute cross section measurement are presented in Fig. 2.
7
Results
The double differential cross section normalised to the inclusive cross section for Z bosons decaying to muons is presented in Table 1. A comparison of the measurement with the NNLO
6 7 Results [GeV] T q 0 50 100 150 200 250 Relative uncertainty [%] 0 0.5 1 1.5 2 2.5 3 3.5 (8TeV) -1 19.7 fb CMS | < 0.4 y | Statistical Total systematic Efficiencies Pileup MC stat FSR Background ) scale+resol µ ( p Polarization [GeV] T q 0 50 100 150 200 250 Relative uncertainty [%] 0 0.5 1 1.5 2 2.5 3 3.5 (8TeV) -1 19.7 fb CMS | < 0.8 y 0.4 < | Statistical Total systematic Efficiencies Pileup MC stat FSR Background ) scale+resol µ ( p Polarization [GeV] T q 0 50 100 150 200 250 Relative uncertainty [%] 0 0.5 1 1.5 2 2.5 3 3.5 4 (8TeV) -1 19.7 fb CMS | < 1.2 y 0.8 < | Statistical Total systematic Efficiencies Pileup MC stat FSR Background ) scale+resol µ ( p Polarization [GeV] T q 0 50 100 150 200 250 Relative uncertainty [%] 0 0.5 1 1.5 2 2.5 3 3.5 4 4.5 (8TeV) -1 19.7 fb CMS | < 1.6 y 1.2 < | Statistical Total systematic Efficiencies Pileup MC stat FSR Background ) scale+resol µ ( p Polarization [GeV] T q 0 50 100 150 200 250 Relative uncertainty [%] 0 1 2 3 4 5 6 (8TeV) -1 19.7 fb CMS | < 2 y 1.6 < | Statistical Total systematic Efficiencies Pileup MC stat FSR Background ) scale+resol µ ( p Polarization [GeV] T q 0 50 100 150 200 250 Relative uncertainty [%] 0 0.2 0.4 0.6 0.8 1 1.2 1.4 1.6 1.8 2 2.2 (8TeV) -1 19.7 fb CMS (Z)| < 2 y 0 < | Statistical Total systematic Efficiencies Pileup MC stat FSR Background ) scale+resol µ ( p Polarization
Figure 1: Relative uncertainties in percent of the normalised fiducial cross section
measure-ment. Each plot shows the qTdependence in the indicated ranges of|y|.
[GeV] T q 0 50 100 150 200 250 Relative uncertainty [%] 0 0.5 1 1.5 2 2.5 3 3.5 (8TeV) -1 19.7 fb CMS | < 0.4 y | Statistical Total systematic Efficiencies Pileup MC stat FSR Background ) scale+resol µ ( p Polarization [GeV] T q 0 50 100 150 200 250 Relative uncertainty [%] 0 0.5 1 1.5 2 2.5 3 3.5 (8TeV) -1 19.7 fb CMS | < 0.8 y 0.4 < | Statistical Total systematic Efficiencies Pileup MC stat FSR Background ) scale+resol µ ( p Polarization [GeV] T q 0 50 100 150 200 250 Relative uncertainty [%] 0 0.5 1 1.5 2 2.5 3 3.5 4 (8TeV) -1 19.7 fb CMS | < 1.2 y 0.8 < | Statistical Total systematic Efficiencies Pileup MC stat FSR Background ) scale+resol µ ( p Polarization [GeV] T q 0 50 100 150 200 250 Relative uncertainty [%] 0 0.5 1 1.5 2 2.5 3 3.5 4 4.5 (8TeV) -1 19.7 fb CMS | < 1.6 y 1.2 < | Statistical Total systematic Efficiencies Pileup MC stat FSR Background ) scale+resol µ ( p Polarization [GeV] T q 0 50 100 150 200 250 Relative uncertainty [%] 0 1 2 3 4 5 6 (8TeV) -1 19.7 fb CMS | < 2 y 1.6 < | Statistical Total systematic Efficiencies Pileup MC stat FSR Background ) scale+resol µ ( p Polarization [GeV] T q 0 50 100 150 200 250 Relative uncertainty [%] 0 0.5 1 1.5 2 2.5 (8TeV) -1 19.7 fb CMS (Z)| < 2 y 0 < | Statistical Total systematic Efficiencies Pileup MC stat FSR Background ) scale+resol µ ( p Polarization
Figure 2: Relative uncertainties in percent of the absolute fiducial cross section measurement.
The 2.6% uncertainty in the luminosity is not included. Each plot shows the qTdependence in
the indicated ranges of|y|.
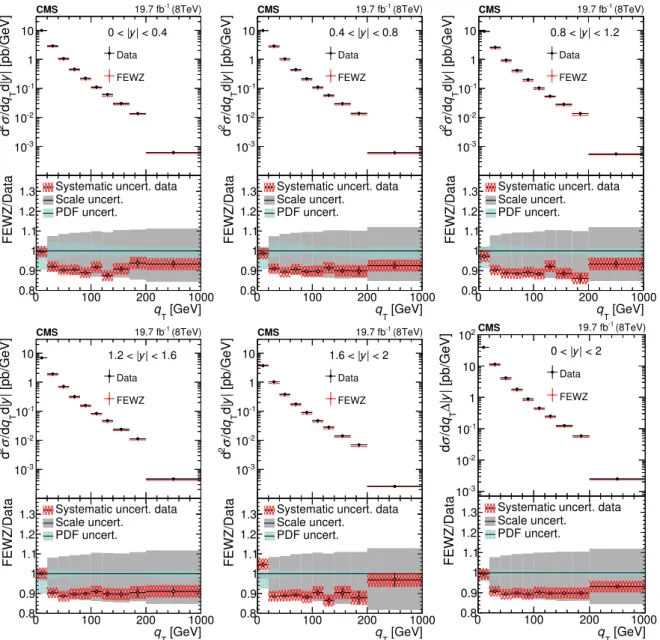
five bins in |y| and the last plot shows the qT dependence integrated over|y|. In the bottom
panels the ratio of theFEWZprediction to data is shown. The vertical error bars represent the
statistical uncertainties of data and simulation. The red-hatched bands drawn at the points represent the systematic uncertainties of the measurement only. The scale uncertainties are indicated by the grey-shaded areas and the PDF uncertainties by the light-hatched bands. The scale uncertainties are estimated from the envelope of the following combinations of variations
(µF,2µR), (0.5µF,µR), and (µF,0.5µR). The PDF uncertainties are evaluated as the envelope of the
uncertainties of the NNLO NNPDF23 and the NNLO CT10 [44] PDF sets. The scale uncertainty
is about 4% for the lowest qT bin. In the second qT bin it is about 8% and increases up to about
14% in the highest qTbin. The jump in the size of the scale uncertainty between the first and the
second bins in qT can be understood as a consequence of reducing the order of the calculation
to NLO when the Z boson is produced in combination with a jet, which is the dominant process
for qT > 20 GeV. While the scale uncertainties are smaller at low qT, the shape is not expected
to match the data well since multiple soft gluon emissions are not modelled. At very high qT
QED corrections could reach a few percent [45, 46].
The PDF uncertainties in the region qT > 20 GeV range between+1% and−4%. The
uncer-tainty is asymmetric because the inclusive cross section computed using the NNLO CT10 PDF set is about 2.5% larger than the one obtained using the NNLO NNPDF23 PDF set.
The NNLOFEWZcomputation predicts the shape correctly, within scale uncertainties of order
6–12%, where the default scale has the general feature of underestimating the relative
abun-dance of high-qT(>20 GeV) events at the 7% level. The shape in|y|is well described byFEWZ.
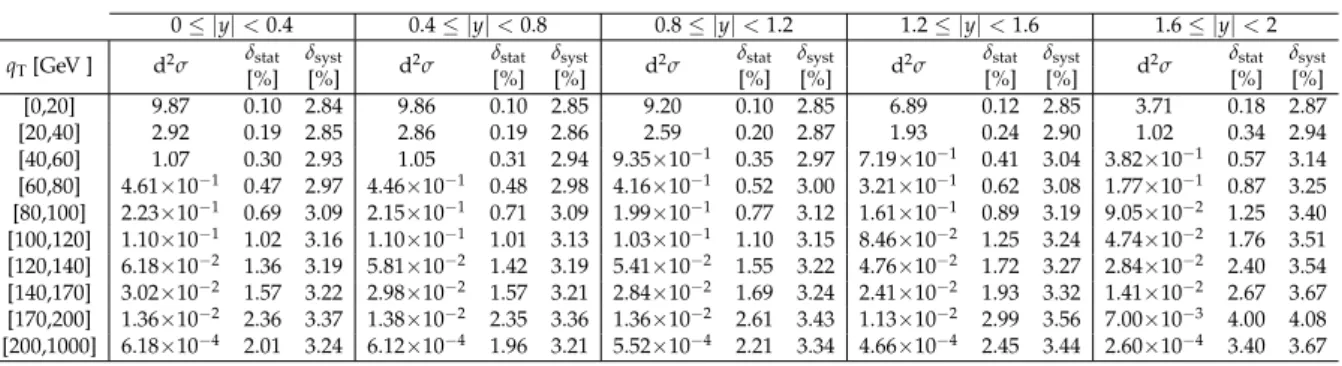
The absolute double differential cross section is presented in Table 2. The comparison with the
NNLO computation of theFEWZprogram is shown in Fig. 4. The scale uncertainties range from
10–16% for qT > 20 GeV. The PDF uncertainties are of the order of 3% in the central rapidity
region and decrease to about 1% in the forward region. The absolute cross section predicted by
the NNLO programFEWZagrees within the uncertainties with the measurement.
A comparison of the measurements with the MADGRAPHand thePOWHEGgenerators is shown
in Fig. 5. The statistical uncertainties are smaller than the symbol size. The hatched bands rep-resent the systematic uncertainties of the measurement only. The two generators show opposite
trends in qT. The MADGRAPHgenerator overestimates the data in the highest qTbins, whereas
thePOWHEGgenerator underestimates the data up to 20% in this region. Also shown are the
absolute differential cross section predictions of MADGRAPH andPOWHEG after normalising
their inclusive cross-sections to the NNLO cross section by K factors, that are independent of
qTand|y|.
Table 1: Measured double differential fiducial cross section normalised to the inclusive fiducial
cross section in units of GeV−1.
0≤ |y| <0.4 0.4≤ |y| <0.8 0.8≤ |y| <1.2 1.2≤ |y| <1.6 1.6≤ |y| <2
qT[GeV ] d2σ/σinc δ[%]stat δ[%]syst d2σ/σinc [%]δstat δ[%]syst d2σ/σinc δ[%]stat δ[%]syst d2σ/σinc [%]δstat δ[%]syst d2σ/σinc δ[%]stat δ[%]syst
[0,20] 2.10×10⁻² 0.09 0.30 2.10×10⁻² 0.09 0.30 1.96×10⁻² 0.10 0.30 1.47×10⁻² 0.12 0.31 7.88×10⁻³ 0.17 0.45 [20,40] 6.20×10⁻³ 0.18 0.44 6.08×10⁻³ 0.19 0.42 5.50×10⁻³ 0.20 0.46 4.11×10⁻³ 0.24 0.59 2.17×10⁻³ 0.34 0.81 [40,60] 2.28×10⁻³ 0.30 0.84 2.22×10⁻³ 0.31 0.80 1.99×10⁻³ 0.35 0.85 1.53×10⁻³ 0.40 1.03 8.11×10⁻⁴ 0.57 1.35 [60,80] 9.79×10⁻⁴ 0.47 0.99 9.48×10⁻⁴ 0.48 0.94 8.85×10⁻⁴ 0.52 0.96 6.82×10⁻⁴ 0.62 1.16 3.75×10⁻⁴ 0.87 1.56 [80,100] 4.73×10⁻⁴ 0.69 1.33 4.56×10⁻⁴ 0.71 1.26 4.23×10⁻⁴ 0.77 1.26 3.42×10⁻⁴ 0.89 1.43 1.92×10⁻⁴ 1.25 1.89 [100,120] 2.33×10⁻⁴ 1.02 1.44 2.34×10⁻⁴ 1.01 1.36 2.19×10⁻⁴ 1.10 1.37 1.80×10⁻⁴ 1.25 1.50 1.01×10⁻⁴ 1.76 2.03 [120,140] 1.31×10⁻⁴ 1.37 1.51 1.24×10⁻⁴ 1.42 1.50 1.15×10⁻⁴ 1.55 1.53 1.01×10⁻⁴ 1.72 1.58 6.03×10⁻⁵ 2.40 2.13 [140,170] 6.42×10⁻⁵ 1.57 1.59 6.34×10⁻⁵ 1.57 1.54 6.05×10⁻⁵ 1.68 1.56 5.13×10⁻⁵ 1.93 1.68 3.00×10⁻⁵ 2.67 2.30 [170,200] 2.88×10⁻⁵ 2.36 1.91 2.93×10⁻⁵ 2.35 1.88 2.90×10⁻⁵ 2.61 1.93 2.40×10⁻⁵ 2.98 2.14 1.49×10⁻⁵ 4.00 2.88 [200,1000] 1.31×10⁻⁶ 2.01 1.64 1.30×10⁻⁶ 1.96 1.57 1.17×10⁻⁶ 2.21 1.75 9.90×10⁻⁷ 2.45 1.95 5.54×10⁻⁷ 3.39 2.39
8
Summary
For Z bosons decaying to muons the double differential Z boson fiducial cross section in qT
and|y|has been measured in pp collisions at 8 TeV. The results are compared to the
next-to-next-to-leading-order predictions computed with theFEWZprogram and they agree within the
8 8 Summary 0 100 200 1000 | [1/GeV] y d| T q /d σ 2 d inc σ 1/ -6 10 -5 10 -4 10 -3 10 -2 10 Data FEWZ (8TeV) -1 19.7 fb CMS | < 0.4 y 0 < | [GeV] T q 0 100 200 1000 FEWZ/Data 0.8 0.9 1 1.1 1.2
1.3 Systematic uncert. data
Scale uncert. PDF uncert. 0 100 200 1000 | [1/GeV] y d| T q /d σ 2 d inc σ 1/ -6 10 -5 10 -4 10 -3 10 -2 10 Data FEWZ (8TeV) -1 19.7 fb CMS | < 0.8 y 0.4 < | [GeV] T q 0 100 200 1000 FEWZ/Data 0.8 0.9 1 1.1 1.2
1.3 Systematic uncert. data
Scale uncert. PDF uncert. 0 100 200 1000 | [1/GeV] y d| T q /d σ 2 d inc σ 1/ -6 10 -5 10 -4 10 -3 10 -2 10 Data FEWZ (8TeV) -1 19.7 fb CMS | < 1.2 y 0.8 < | [GeV] T q 0 100 200 1000 FEWZ/Data 0.8 0.9 1 1.1 1.2
1.3 Systematic uncert. data
Scale uncert. PDF uncert. 0 100 200 1000 | [1/GeV] y d| T q /d σ 2 d inc σ 1/ -6 10 -5 10 -4 10 -3 10 -2 10 Data FEWZ (8TeV) -1 19.7 fb CMS | < 1.6 y 1.2 < | [GeV] T q 0 100 200 1000 FEWZ/Data 0.8 0.9 1 1.1 1.2
1.3 Systematic uncert. data
Scale uncert. PDF uncert. 0 100 200 1000 | [1/GeV] y d| T q /d σ 2 d inc σ 1/ -6 10 -5 10 -4 10 -3 10 -2 10 Data FEWZ (8TeV) -1 19.7 fb CMS | < 2 y 1.6 < | [GeV] T q 0 100 200 1000 FEWZ/Data 0.8 0.9 1 1.1 1.2
1.3 Systematic uncert. data
Scale uncert. PDF uncert. 0 100 200 1000 | [1/GeV] y | ∆ T q /d σ d inc σ 1/ -5 10 -4 10 -3 10 -2 10 -1 10 Data FEWZ (8TeV) -1 19.7 fb CMS | < 2 y 0 < | [GeV] T q 0 100 200 1000 FEWZ/Data 0.8 0.9 1 1.1 1.2
1.3 Systematic uncert. data
Scale uncert. PDF uncert.
Figure 3: The measured fiducial Z boson differential cross section, normalised to the inclusive
fiducial cross section compared to the NNLO prediction ofFEWZ. The first five plots show the
qTdependence in the five bins of|y|and the last plot shows the qTdependence integrated over
|y|. The NNLO NNPDF23 PDF set with radiative corrections is used for the generation. We
include data in qTup to 1 TeV, but have shortened the bin for presentation purposes.
Table 2: Measured absolute double differential fiducial cross section in units of pb/GeV.
0≤ |y| <0.4 0.4≤ |y| <0.8 0.8≤ |y| <1.2 1.2≤ |y| <1.6 1.6≤ |y| <2
qT[GeV ] d2σ δstat δsyst d2σ δstat δsyst d2σ δstat δsyst d2σ δstat δsyst d2σ δstat δsyst
[%] [%] [%] [%] [%] [%] [%] [%] [%] [%] [0,20] 9.87 0.10 2.84 9.86 0.10 2.85 9.20 0.10 2.85 6.89 0.12 2.85 3.71 0.18 2.87 [20,40] 2.92 0.19 2.85 2.86 0.19 2.86 2.59 0.20 2.87 1.93 0.24 2.90 1.02 0.34 2.94 [40,60] 1.07 0.30 2.93 1.05 0.31 2.94 9.35×10⁻¹ 0.35 2.97 7.19×10⁻¹ 0.41 3.04 3.82×10⁻¹ 0.57 3.14 [60,80] 4.61×10⁻¹ 0.47 2.97 4.46×10⁻¹ 0.48 2.98 4.16×10⁻¹ 0.52 3.00 3.21×10⁻¹ 0.62 3.08 1.77×10⁻¹ 0.87 3.25 [80,100] 2.23×10⁻¹ 0.69 3.09 2.15×10⁻¹ 0.71 3.09 1.99×10⁻¹ 0.77 3.12 1.61×10⁻¹ 0.89 3.19 9.05×10⁻² 1.25 3.40 [100,120] 1.10×10⁻¹ 1.02 3.16 1.10×10⁻¹ 1.01 3.13 1.03×10⁻¹ 1.10 3.15 8.46×10⁻² 1.25 3.24 4.74×10⁻² 1.76 3.51 [120,140] 6.18×10⁻² 1.36 3.19 5.81×10⁻² 1.42 3.19 5.41×10⁻² 1.55 3.22 4.76×10⁻² 1.72 3.27 2.84×10⁻² 2.40 3.54 [140,170] 3.02×10⁻² 1.57 3.22 2.98×10⁻² 1.57 3.21 2.84×10⁻² 1.69 3.24 2.41×10⁻² 1.93 3.32 1.41×10⁻² 2.67 3.67 [170,200] 1.36×10⁻² 2.36 3.37 1.38×10⁻² 2.35 3.36 1.36×10⁻² 2.61 3.43 1.13×10⁻² 2.99 3.56 7.00×10⁻³ 4.00 4.08 [200,1000] 6.18×10⁻⁴ 2.01 3.24 6.12×10⁻⁴ 1.96 3.21 5.52×10⁻⁴ 2.21 3.34 4.66×10⁻⁴ 2.45 3.44 2.60×10⁻⁴ 3.40 3.67
0 100 200 1000 | [pb/GeV] y d| T q /d σ 2 d -3 10 -2 10 -1 10 1 10 Data FEWZ (8TeV) -1 19.7 fb CMS | < 0.4 y 0 < | [GeV] T q 0 100 200 1000 FEWZ/Data 0.8 0.9 1 1.1 1.2
1.3 Systematic uncert. data
Scale uncert. PDF uncert. 0 100 200 1000 | [pb/GeV] y d| T q /d σ 2 d -3 10 -2 10 -1 10 1 10 Data FEWZ (8TeV) -1 19.7 fb CMS | < 0.8 y 0.4 < | [GeV] T q 0 100 200 1000 FEWZ/Data 0.8 0.9 1 1.1 1.2
1.3 Systematic uncert. data
Scale uncert. PDF uncert. 0 100 200 1000 | [pb/GeV] y d| T q /d σ 2 d -3 10 -2 10 -1 10 1 10 Data FEWZ (8TeV) -1 19.7 fb CMS | < 1.2 y 0.8 < | [GeV] T q 0 100 200 1000 FEWZ/Data 0.8 0.9 1 1.1 1.2
1.3 Systematic uncert. data
Scale uncert. PDF uncert. 0 100 200 1000 | [pb/GeV] y d| T q /d σ 2 d -3 10 -2 10 -1 10 1 10 Data FEWZ (8TeV) -1 19.7 fb CMS | < 1.6 y 1.2 < | [GeV] T q 0 100 200 1000 FEWZ/Data 0.8 0.9 1 1.1 1.2
1.3 Systematic uncert. data
Scale uncert. PDF uncert. 0 100 200 1000 | [pb/GeV] y d| T q /d σ 2 d -3 10 -2 10 -1 10 1 10 Data FEWZ (8TeV) -1 19.7 fb CMS | < 2 y 1.6 < | [GeV] T q 0 100 200 1000 FEWZ/Data 0.8 0.9 1 1.1 1.2
1.3 Systematic uncert. data
Scale uncert. PDF uncert. 0 100 200 1000 | [pb/GeV] y | ∆ T q /d σ d -3 10 -2 10 -1 10 1 10 2 10 Data FEWZ (8TeV) -1 19.7 fb CMS | < 2 y 0 < | [GeV] T q 0 100 200 1000 FEWZ/Data 0.8 0.9 1 1.1 1.2
1.3 Systematic uncert. data
Scale uncert. PDF uncert.
Figure 4: The measured absolute fiducial Z boson differential cross section compared to the
NNLO prediction ofFEWZ. The first five plots show the qT dependence in the five bins of|y|
and the last plot shows the qT dependence integrated over |y|. We include data in qT up to
10 8 Summary
0
100
200
1000
| [1/GeV]
y
|
∆
Tq
/d
σ
d
incσ
1/
-510
-410
-310
-210
-110
Data MadGraph Powheg (8TeV) -1 19.7 fb CMS | < 2 y 0 < |[GeV]
Tq
0
100
200
1000
MC/Data0.8
1
1.2
MadGraph/Data[GeV]
Tq
0
100
200
1000
MC/Data0.8
1
1.2
Powheg/Data0
100
200
1000
| [pb/GeV]
y|
∆
Tq
/d
σ
d
-310
-210
-110
1
10
210
Data NNLO K × MadGraph NNLO K × Powheg (8TeV) -1 19.7 fb CMS | < 2 y 0 < |[GeV]
Tq
0
100
200
1000
MC/Data0.8
1
1.2
/Data NNLO K × MadGraph[GeV]
Tq
0
100
200
1000
MC/Data0.8
1
1.2
/Data NNLO K × PowhegFigure 5: Normalised (left) and absolute (right) fiducial Z boson cross section, as a function
of qT, compared to predictions from MADGRAPH(red symbols) andPOWHEG(blue symbols).
MADGRAPHuses the LO CTEQ6L1 PDF set andPOWHEG the NLO CT10 PDF set. The
inclu-sive LO MADGRAPHand the inclusive NLOPOWHEGcross sections are scaled to the inclusive
NNLO cross section calculated withFEWZby applying scale factors KNNLOFEWZ.
observed in the MADGRAPHandPOWHEGgenerators. The results are presented along with the
full covariance matrix in order to enable their use in future fits of the PDF. The experimental uncertainties are significantly smaller than the current theoretical and PDF uncertainties.
Acknowledgments
We congratulate our colleagues in the CERN accelerator departments for the excellent perfor-mance of the LHC and thank the technical and administrative staffs at CERN and at other CMS institutes for their contributions to the success of the CMS effort. In addition, we gratefully acknowledge the computing centers and personnel of the Worldwide LHC Computing Grid for delivering so effectively the computing infrastructure essential to our analyses. Finally, we acknowledge the enduring support for the construction and operation of the LHC and the CMS detector provided by the following funding agencies: BMWFW and FWF (Austria); FNRS and FWO (Belgium); CNPq, CAPES, FAPERJ, and FAPESP (Brazil); MES (Bulgaria); CERN; CAS, MOST, and NSFC (China); COLCIENCIAS (Colombia); MSES and CSF (Croatia); RPF (Cyprus); MoER, ERC IUT and ERDF (Estonia); Academy of Finland, MEC, and HIP (Finland); CEA and CNRS/IN2P3 (France); BMBF, DFG, and HGF (Germany); GSRT (Greece); OTKA and NIH (Hungary); DAE and DST (India); IPM (Iran); SFI (Ireland); INFN (Italy); MSIP and NRF
(Re-public of Korea); LAS (Lithuania); MOE and UM (Malaysia); CINVESTAV, CONACYT, SEP, and UASLP-FAI (Mexico); MBIE (New Zealand); PAEC (Pakistan); MSHE and NSC (Poland); FCT (Portugal); JINR (Dubna); MON, RosAtom, RAS and RFBR (Russia); MESTD (Serbia); SEIDI and CPAN (Spain); Swiss Funding Agencies (Switzerland); MST (Taipei); ThEPCenter, IPST, STAR and NSTDA (Thailand); TUBITAK and TAEK (Turkey); NASU and SFFR (Ukraine); STFC (United Kingdom); DOE and NSF (USA).
Individuals have received support from the Marie-Curie program and the European Research Council and EPLANET (European Union); the Leventis Foundation; the A. P. Sloan Founda-tion; the Alexander von Humboldt FoundaFounda-tion; the Belgian Federal Science Policy Office; the Fonds pour la Formation `a la Recherche dans l’Industrie et dans l’Agriculture (FRIA-Belgium); the Agentschap voor Innovatie door Wetenschap en Technologie (IWT-Belgium); the Ministry of Education, Youth and Sports (MEYS) of the Czech Republic; the Council of Science and In-dustrial Research, India; the HOMING PLUS program of the Foundation for Polish Science, cofinanced from European Union, Regional Development Fund; the Compagnia di San Paolo (Torino); the Consorzio per la Fisica (Trieste); MIUR project 20108T4XTM (Italy); the Thalis and Aristeia programs cofinanced by EU-ESF and the Greek NSRF; and the National Priorities Research Program by Qatar National Research Fund.
References
[1] CMS Collaboration, “Measurement of the rapidity and transverse momentum
distributions of Z bosons in pp collisions at√s =7 TeV”, Phys. Rev. D 85 (2012) 032002,
doi:10.1103/PhysRevD.85.032002, arXiv:1110.4973.
[2] ATLAS Collaboration, “Measurement of the transverse momentum distribution of Z/γ∗
bosons in proton-proton collisions at√s =7 TeV with the ATLAS detector”, Phys. Lett. B
705(2011) 415, doi:10.1016/j.physletb.2011.10.018, arXiv:1107.2381.
[3] ATLAS Collaboration, “Measurement of the Z/γ∗boson transverse momentum
distribution in pp collisions at√s =7 TeV with the ATLAS detector”, JHEP 09 (2014)
145, doi:10.1007/JHEP09(2014)145, arXiv:1406.3660.
[4] LHCb Collaboration, “Measurement of the cross-section for Z→e+e−production in pp
collisions at√s=7 TeV”, JHEP 02 (2013) 106, doi:10.1007/JHEP02(2013)106,
arXiv:1212.4620.
[5] LHCb Collaboration, “Inclusive W and Z production in the forward region at√s =7
TeV”, JHEP 06 (2012) 058, doi:10.1007/JHEP06(2012)058, arXiv:1204.1620. [6] CMS Collaboration, “Measurement of the differential and double-differential Drell-Yan
cross sections in proton-proton collisions at√s=7 TeV”, JHEP 12 (2013) 030,
doi:10.1007/JHEP12(2013)030, arXiv:1310.7291.
[7] CMS Collaboration, “Measurements of differential and double-differential Drell-Yan cross sections in proton-proton collisions at 8 TeV”, Eur. Phys. J. C75 (2015), no. 4, 147,
doi:10.1140/epjc/s10052-015-3364-2, arXiv:1412.1115.
[8] ATLAS Collaboration, “Measurement of angular correlations in Drell-Yan lepton pairs to
probe Z/γ∗boson transverse momentum at√s=7 TeV with the ATLAS detector”,
Phys. Lett. B 720 (2013) 32, doi:10.1016/j.physletb.2013.01.054,
12 References
[9] S. A. Malik and G. Watt, “Ratios of W and Z cross sections at large boson pTas a
constraint on PDFs and background to new physics”, JHEP 02 (2014) 025, doi:10.1007/JHEP02(2014)025, arXiv:1304.2424.
[10] D. d’Enterria and J. Rojo, “Quantitative constraints on the gluon distribution function in the proton from collider isolated-photon data”, Nucl. Phys. B 860 (2012) 311,
doi:10.1016/j.nuclphysb.2012.03.003, arXiv:1202.1762.
[11] M. Czakon, M. L. Mangano, A. Mitov, and J. Rojo, “Constraints on the gluon PDF from top quark pair production at hadron colliders”, JHEP 07 (2013) 167,
doi:10.1007/JHEP07(2013)167, arXiv:1303.7215.
[12] CMS Collaboration, “The CMS experiment at the CERN LHC”, JINST 3 (2008) S08004, doi:10.1088/1748-0221/3/08/S08004.
[13] CMS Collaboration, “Performance of CMS muon reconstruction in pp collision events at√
s =7 TeV”, JINST 7 (2012) P10002, doi:10.1088/1748-0221/7/10/P10002,
arXiv:1206.4071.
[14] CMS Collaboration, “Particle–Flow Event Reconstruction in CMS and Performance for
Jets, Taus, and Emiss
T ”, CMS Physics Analysis Summary CMS-PAS-PFT-09-001, 2009.
[15] CMS Collaboration, “Commissioning of the Particle-flow Event Reconstruction with the first LHC collisions recorded in the CMS detector”, CMS Physics Analysis Summary CMS-PAS-PFT-10-001, 2010.
[16] J. Alwall et al., “MadGraph 5: going beyond”, JHEP 06 (2011) 128, doi:10.1007/JHEP06(2011)128, arXiv:1106.0522.
[17] T. Sjostrand, S. Mrenna, and P. Z. Skands, “PYTHIA 6.4 physics and manual”, JHEP 05 (2006) 026, doi:10.1088/1126-6708/2006/05/026, arXiv:hep-ph/0603175. [18] CMS Collaboration, “Study of the underlying event at forward rapidity in pp collisions
at√s = 0.9, 2.76, and 7 TeV”, JHEP 04 (2013) 072, doi:10.1007/JHEP04(2013)072,
arXiv:1302.2394.
[19] J. Alwall et al., “Comparative study of various algorithms for the merging of parton showers and matrix elements in hadronic collisions”, Eur. Phys. J. C 53 (2008) 473,
doi:10.1140/epjc/s10052-007-0490-5, arXiv:0706.2569.
[20] J. Pumplin et al., “New generation of parton distributions with uncertainties from global QCD analysis”, JHEP 07 (2002) 012, doi:10.1088/1126-6708/2002/07/012,
arXiv:hep-ph/0201195.
[21] P. Nason, “A new method for combining NLO QCD with shower Monte Carlo algorithms”, JHEP 11 (2004) 040, doi:10.1088/1126-6708/2004/11/040,
arXiv:hep-ph/0409146.
[22] S. Frixione, P. Nason, and C. Oleari, “Matching NLO QCD computations with Parton Shower simulations: the POWHEG method”, JHEP 11 (2007) 070,
doi:10.1088/1126-6708/2007/11/070, arXiv:0709.2092.
[23] S. Alioli, P. Nason, C. Oleari, and E. Re, “A general framework for implementing NLO calculations in shower Monte Carlo programs: the POWHEG BOX”, JHEP 06 (2010) 043,
[24] S. Alioli, P. Nason, C. Oleari, and E. Re, “NLO vector-boson production matched with shower in POWHEG”, JHEP 07 (2008) 060,
doi:10.1088/1126-6708/2008/07/060, arXiv:0805.4802.
[25] H.-L. Lai et al., “New parton distributions for collider physics”, Phys. Rev. D 82 (2010) 074024, doi:10.1103/PhysRevD.82.074024, arXiv:1007.2241.
[26] S. Alioli, P. Nason, C. Oleari, and E. Re, “NLO single-top production matched with shower in POWHEG: s- and t-channel contributions”, JHEP 09 (2009) 111,
doi:10.1088/1126-6708/2009/09/111, arXiv:0907.4076. [Erratum:
doi:10.1007/JHEP02(2010)011].
[27] E. Re, “Single-top W t-channel production matched with parton showers using the POWHEG method”, Eur. Phys. J. C 71 (2011) 1547,
doi:10.1140/epjc/s10052-011-1547-z, arXiv:1009.2450.
[28] R. Gavin, Y. Li, F. Petriello, and S. Quackenbush, “FEWZ 2.0: A code for hadronic Z production at next-to-next-to-leading order”, Comput. Phys. Commun. 182 (2011) 2388,
doi:10.1016/j.cpc.2011.06.008, arXiv:1011.3540.
[29] M. Czakon, P. Fiedler, and A. Mitov, “Total top-quark pair-production cross section at
hadron colliders throughO(α4S)”, Phys. Rev. Lett. 110 (2013) 252004,
doi:10.1103/PhysRevLett.110.252004, arXiv:1303.6254.
[30] N. Kidonakis, “Differential and total cross sections for top pair and single top
production”, in XX Int. Workshop on Deep-Inelastic Scattering and Related Subjects, p. 831. Bonn, Germany, 2012. arXiv:1205.3453.
doi:10.3204/DESY-PROC-2012-02/251.
[31] GEANT4 Collaboration, “GEANT4—a simulation toolkit”, Nucl. Instrum. Meth. A 506 (2003) 250, doi:10.1016/S0168-9002(03)01368-8.
[32] Y. Li and F. Petriello, “Combining QCD and electroweak corrections to dilepton production in FEWZ”, Phys. Rev. D 86 (2012) 094034,
doi:10.1103/PhysRevD.86.094034, arXiv:1208.5967.
[33] NNPDF Collaboration, “Parton distributions with QED corrections”, Nucl. Phys. B 877 (2013) 290, doi:10.1016/j.nuclphysb.2013.10.010.
[34] CMS Collaboration, “Measurements of inclusive W and Z cross sections in pp collisions
at√s = 7 TeV”, J. High Energy Phys. 01 (2011) 080, doi:10.1007/JHEP01(2011)080.
[35] G. D’Agostini, “A multidimensional unfolding method based on Bayes’ theorem”, Nucl. Instrum. Meth. A 362 (1995) 487, doi:10.1016/0168-9002(95)00274-X.
[36] T. Adye, “Unfolding algorithms and tests using RooUnfold”, in Proceedings of the PHYSTAT 2011 Workshop on Statistical Issues Related to Discovery Claims in Search Experiments and Unfolding, p. 313. CERN, Geneva, Switzerland, January 17-20, 2011.
arXiv:1105.1160. doi:10.5170/CERN-2011-006.
[37] CMS Collaboration, “CMS Luminosity Based on Pixel Cluster Counting - Summer 2013 Update”, CMS Physics Analysis Summary CMS-PAS-LUM-13-001, 2013.
14 References
[38] ATLAS Collaboration, “Measurement of WZ production in proton-proton collisions at√
s =7 TeV with the ATLAS detector”, Eur. Phys. J. C 72 (2012) 2173,
doi:10.1140/epjc/s10052-012-2173-0, arXiv:1208.1390.
[39] CMS Collaboration, “Measurement of the pp→ZZ production cross section and
constraints on anomalous triple gauge couplings in four-lepton final states at√s=8
TeV”, Phys. Lett. B 740 (2015) 250, doi:10.1016/j.physletb.2014.11.059, arXiv:1406.0113.
[40] ATLAS Collaboration, “Measurement of ZZ production in pp collisions at√s=7 TeV
and limits on anomalous ZZZ and ZZγ couplings with the ATLAS detector”, JHEP 03 (2013) 128, doi:10.1007/JHEP03(2013)128, arXiv:1211.6096.
[41] J. C. Collins and D. E. Soper, “Angular distribution of dileptons in high-energy hadron collisions”, Phys. Rev. D 16 (1977) 2219, doi:10.1103/PhysRevD.16.2219.
[42] CMS Collaboration, “Angular coefficients of Z bosons produced in pp collisions at 8 TeV
and decaying to µ+
µ−as a function of transverse momentum and rapidity”,
arXiv:1504.03512.
[43] Z. Bern et al., “Left-handed W bosons at the LHC”, Phys. Rev. D 84 (2011) 034008, doi:10.1103/PhysRevD.84.034008, arXiv:1103.5445.
[44] J. Gao et al., “CT10 next-to-next-to-leading order global analysis of QCD”, Phys. Rev. D
89(2014) 033009, doi:10.1103/PhysRevD.89.033009, arXiv:1302.6246.
[45] T. Becher and X. Garcia i Tormo, “Electroweak Sudakov effects in W, Z and γ production at large transverse momentum”, Phys. Rev. D 88 (2013) 013009,
doi:10.1103/PhysRevD.88.013009, arXiv:1305.4202.
[46] A. Denner, S. Dittmaier, T. Kasprzik, and A. Muck, “Electroweak corrections to dilepton + jet production at hadron colliders”, JHEP 06 (2011) 069,
A
The CMS Collaboration
Yerevan Physics Institute, Yerevan, Armenia
V. Khachatryan, A.M. Sirunyan, A. Tumasyan
Institut f ¨ur Hochenergiephysik der OeAW, Wien, Austria
W. Adam, T. Bergauer, M. Dragicevic, J. Er ¨o, M. Friedl, R. Fr ¨uhwirth1, V.M. Ghete, C. Hartl,
N. H ¨ormann, J. Hrubec, M. Jeitler1, W. Kiesenhofer, V. Kn ¨unz, M. Krammer1, I. Kr¨atschmer,
D. Liko, I. Mikulec, D. Rabady2, B. Rahbaran, H. Rohringer, R. Sch ¨ofbeck, J. Strauss,
W. Treberer-Treberspurg, W. Waltenberger, C.-E. Wulz1
National Centre for Particle and High Energy Physics, Minsk, Belarus
V. Mossolov, N. Shumeiko, J. Suarez Gonzalez
Universiteit Antwerpen, Antwerpen, Belgium
S. Alderweireldt, S. Bansal, T. Cornelis, E.A. De Wolf, X. Janssen, A. Knutsson, J. Lauwers, S. Luyckx, S. Ochesanu, R. Rougny, M. Van De Klundert, H. Van Haevermaet, P. Van Mechelen, N. Van Remortel, A. Van Spilbeeck
Vrije Universiteit Brussel, Brussel, Belgium
F. Blekman, S. Blyweert, J. D’Hondt, N. Daci, N. Heracleous, J. Keaveney, S. Lowette, M. Maes, A. Olbrechts, Q. Python, D. Strom, S. Tavernier, W. Van Doninck, P. Van Mulders, G.P. Van Onsem, I. Villella
Universit´e Libre de Bruxelles, Bruxelles, Belgium
C. Caillol, B. Clerbaux, G. De Lentdecker, D. Dobur, L. Favart, A.P.R. Gay, A. Grebenyuk,
A. L´eonard, A. Mohammadi, L. Perni`e2, A. Randle-conde, T. Reis, T. Seva, L. Thomas, C. Vander
Velde, P. Vanlaer, J. Wang, F. Zenoni
Ghent University, Ghent, Belgium
V. Adler, K. Beernaert, L. Benucci, A. Cimmino, S. Costantini, S. Crucy, A. Fagot, G. Garcia, J. Mccartin, A.A. Ocampo Rios, D. Poyraz, D. Ryckbosch, S. Salva Diblen, M. Sigamani, N. Strobbe, F. Thyssen, M. Tytgat, E. Yazgan, N. Zaganidis
Universit´e Catholique de Louvain, Louvain-la-Neuve, Belgium
S. Basegmez, C. Beluffi3, G. Bruno, R. Castello, A. Caudron, L. Ceard, G.G. Da Silveira,
C. Delaere, T. du Pree, D. Favart, L. Forthomme, A. Giammanco4, J. Hollar, A. Jafari, P. Jez,
M. Komm, V. Lemaitre, C. Nuttens, D. Pagano, L. Perrini, A. Pin, K. Piotrzkowski, A. Popov5,
L. Quertenmont, M. Selvaggi, M. Vidal Marono
Universit´e de Mons, Mons, Belgium
N. Beliy, T. Caebergs, E. Daubie, G.H. Hammad
Centro Brasileiro de Pesquisas Fisicas, Rio de Janeiro, Brazil
W.L. Ald´a J ´unior, G.A. Alves, L. Brito, M. Correa Martins Junior, T. Dos Reis Martins, J. Molina, C. Mora Herrera, M.E. Pol, P. Rebello Teles
Universidade do Estado do Rio de Janeiro, Rio de Janeiro, Brazil
E. Belchior Batista Das Chagas, W. Carvalho, J. Chinellato6, A. Cust ´odio, E.M. Da Costa,
D. De Jesus Damiao, C. De Oliveira Martins, S. Fonseca De Souza, L.M. Huertas Guativa, H. Malbouisson, D. Matos Figueiredo, L. Mundim, H. Nogima, W.L. Prado Da Silva,
16 A The CMS Collaboration
Universidade Estadual Paulistaa, Universidade Federal do ABCb, S˜ao Paulo, Brazil
C.A. Bernardesb, S. Dograa, T.R. Fernandez Perez Tomeia, E.M. Gregoresb, P.G. Mercadanteb,
S.F. Novaesa, Sandra S. Padulaa
Institute for Nuclear Research and Nuclear Energy, Sofia, Bulgaria
A. Aleksandrov, V. Genchev2, R. Hadjiiska, P. Iaydjiev, A. Marinov, S. Piperov, M. Rodozov,
S. Stoykova, G. Sultanov, M. Vutova
University of Sofia, Sofia, Bulgaria
A. Dimitrov, I. Glushkov, L. Litov, B. Pavlov, P. Petkov
Institute of High Energy Physics, Beijing, China
J.G. Bian, G.M. Chen, H.S. Chen, M. Chen, T. Cheng, R. Du, C.H. Jiang, R. Plestina7, F. Romeo,
J. Tao, Z. Wang
State Key Laboratory of Nuclear Physics and Technology, Peking University, Beijing, China
C. Asawatangtrakuldee, Y. Ban, S. Liu, Y. Mao, S.J. Qian, D. Wang, Z. Xu, F. Zhang8, L. Zhang,
W. Zou
Universidad de Los Andes, Bogota, Colombia
C. Avila, A. Cabrera, L.F. Chaparro Sierra, C. Florez, J.P. Gomez, B. Gomez Moreno, J.C. Sanabria
University of Split, Faculty of Electrical Engineering, Mechanical Engineering and Naval Architecture, Split, Croatia
N. Godinovic, D. Lelas, D. Polic, I. Puljak
University of Split, Faculty of Science, Split, Croatia
Z. Antunovic, M. Kovac
Institute Rudjer Boskovic, Zagreb, Croatia
V. Brigljevic, K. Kadija, J. Luetic, D. Mekterovic, L. Sudic
University of Cyprus, Nicosia, Cyprus
A. Attikis, G. Mavromanolakis, J. Mousa, C. Nicolaou, F. Ptochos, P.A. Razis, H. Rykaczewski
Charles University, Prague, Czech Republic
M. Bodlak, M. Finger, M. Finger Jr.9
Academy of Scientific Research and Technology of the Arab Republic of Egypt, Egyptian Network of High Energy Physics, Cairo, Egypt
Y. Assran10, A. Ellithi Kamel11, M.A. Mahmoud12, A. Radi13,14
National Institute of Chemical Physics and Biophysics, Tallinn, Estonia
M. Kadastik, M. Murumaa, M. Raidal, A. Tiko
Department of Physics, University of Helsinki, Helsinki, Finland
P. Eerola, M. Voutilainen
Helsinki Institute of Physics, Helsinki, Finland
J. H¨ark ¨onen, V. Karim¨aki, R. Kinnunen, T. Lamp´en, K. Lassila-Perini, S. Lehti, T. Lind´en, P. Luukka, T. M¨aenp¨a¨a, T. Peltola, E. Tuominen, J. Tuominiemi, E. Tuovinen, L. Wendland
Lappeenranta University of Technology, Lappeenranta, Finland
DSM/IRFU, CEA/Saclay, Gif-sur-Yvette, France
M. Besancon, F. Couderc, M. Dejardin, D. Denegri, B. Fabbro, J.L. Faure, C. Favaro, F. Ferri, S. Ganjour, A. Givernaud, P. Gras, G. Hamel de Monchenault, P. Jarry, E. Locci, J. Malcles, J. Rander, A. Rosowsky, M. Titov, A. Zghiche
Laboratoire Leprince-Ringuet, Ecole Polytechnique, IN2P3-CNRS, Palaiseau, France
S. Baffioni, F. Beaudette, P. Busson, E. Chapon, C. Charlot, T. Dahms, O. Davignon, L. Dobrzynski, N. Filipovic, A. Florent, R. Granier de Cassagnac, L. Mastrolorenzo, P. Min´e, I.N. Naranjo, M. Nguyen, C. Ochando, G. Ortona, P. Paganini, S. Regnard, R. Salerno, J.B. Sauvan, Y. Sirois, C. Veelken, Y. Yilmaz, A. Zabi
Institut Pluridisciplinaire Hubert Curien, Universit´e de Strasbourg, Universit´e de Haute Alsace Mulhouse, CNRS/IN2P3, Strasbourg, France
J.-L. Agram15, J. Andrea, A. Aubin, D. Bloch, J.-M. Brom, E.C. Chabert, N. Chanon, C. Collard,
E. Conte15, J.-C. Fontaine15, D. Gel´e, U. Goerlach, C. Goetzmann, A.-C. Le Bihan, K. Skovpen,
P. Van Hove
Centre de Calcul de l’Institut National de Physique Nucleaire et de Physique des Particules, CNRS/IN2P3, Villeurbanne, France
S. Gadrat
Universit´e de Lyon, Universit´e Claude Bernard Lyon 1, CNRS-IN2P3, Institut de Physique Nucl´eaire de Lyon, Villeurbanne, France
S. Beauceron, N. Beaupere, C. Bernet7, G. Boudoul2, E. Bouvier, S. Brochet, C.A. Carrillo
Montoya, J. Chasserat, R. Chierici, D. Contardo2, B. Courbon, P. Depasse, H. El Mamouni,
J. Fan, J. Fay, S. Gascon, M. Gouzevitch, B. Ille, T. Kurca, M. Lethuillier, L. Mirabito, A.L. Pequegnot, S. Perries, J.D. Ruiz Alvarez, D. Sabes, L. Sgandurra, V. Sordini, M. Vander Donckt, P. Verdier, S. Viret, H. Xiao
Institute of High Energy Physics and Informatization, Tbilisi State University, Tbilisi, Georgia
Z. Tsamalaidze9
RWTH Aachen University, I. Physikalisches Institut, Aachen, Germany
C. Autermann, S. Beranek, M. Bontenackels, M. Edelhoff, L. Feld, A. Heister, K. Klein, M. Lipinski, A. Ostapchuk, M. Preuten, F. Raupach, J. Sammet, S. Schael, J.F. Schulte, H. Weber,
B. Wittmer, V. Zhukov5
RWTH Aachen University, III. Physikalisches Institut A, Aachen, Germany
M. Ata, M. Brodski, E. Dietz-Laursonn, D. Duchardt, M. Erdmann, R. Fischer, A. G ¨uth, T. Hebbeker, C. Heidemann, K. Hoepfner, D. Klingebiel, S. Knutzen, P. Kreuzer, M. Merschmeyer, A. Meyer, P. Millet, M. Olschewski, K. Padeken, P. Papacz, H. Reithler, S.A. Schmitz, L. Sonnenschein, D. Teyssier, S. Th ¨uer
RWTH Aachen University, III. Physikalisches Institut B, Aachen, Germany
V. Cherepanov, Y. Erdogan, G. Fl ¨ugge, H. Geenen, M. Geisler, W. Haj Ahmad, F. Hoehle,
B. Kargoll, T. Kress, Y. Kuessel, A. K ¨unsken, J. Lingemann2, A. Nowack, I.M. Nugent,
C. Pistone, O. Pooth, A. Stahl
Deutsches Elektronen-Synchrotron, Hamburg, Germany
M. Aldaya Martin, I. Asin, N. Bartosik, J. Behr, U. Behrens, A.J. Bell, A. Bethani, K. Borras, A. Burgmeier, A. Cakir, L. Calligaris, A. Campbell, S. Choudhury, F. Costanza, C. Diez Pardos, G. Dolinska, S. Dooling, T. Dorland, G. Eckerlin, D. Eckstein, T. Eichhorn, G. Flucke,
18 A The CMS Collaboration
A. Kalogeropoulos, O. Karacheban16, M. Kasemann, P. Katsas, J. Kieseler, C. Kleinwort, I. Korol,
D. Kr ¨ucker, W. Lange, J. Leonard, K. Lipka, A. Lobanov, W. Lohmann16, B. Lutz, R. Mankel,
I. Marfin16, I.-A. Melzer-Pellmann, A.B. Meyer, G. Mittag, J. Mnich, A. Mussgiller, S.
Naumann-Emme, A. Nayak, E. Ntomari, H. Perrey, D. Pitzl, R. Placakyte, A. Raspereza, P.M. Ribeiro
Cipriano, B. Roland, E. Ron, M. ¨O. Sahin, J. Salfeld-Nebgen, P. Saxena, T. Schoerner-Sadenius,
M. Schr ¨oder, C. Seitz, S. Spannagel, A.D.R. Vargas Trevino, R. Walsh, C. Wissing
University of Hamburg, Hamburg, Germany
V. Blobel, M. Centis Vignali, A.R. Draeger, J. Erfle, E. Garutti, K. Goebel, M. G ¨orner, J. Haller, M. Hoffmann, R.S. H ¨oing, A. Junkes, H. Kirschenmann, R. Klanner, R. Kogler, T. Lapsien, T. Lenz, I. Marchesini, D. Marconi, D. Nowatschin, J. Ott, T. Peiffer, A. Perieanu, N. Pietsch, J. Poehlsen, T. Poehlsen, D. Rathjens, C. Sander, H. Schettler, P. Schleper, E. Schlieckau, A. Schmidt, M. Seidel, V. Sola, H. Stadie, G. Steinbr ¨uck, H. Tholen, D. Troendle, E. Usai, L. Vanelderen, A. Vanhoefer
Institut f ¨ur Experimentelle Kernphysik, Karlsruhe, Germany
M. Akbiyik, C. Barth, C. Baus, J. Berger, C. B ¨oser, E. Butz, T. Chwalek, W. De Boer,
A. Descroix, A. Dierlamm, M. Feindt, F. Frensch, M. Giffels, A. Gilbert, F. Hartmann2, T. Hauth,
U. Husemann, I. Katkov5, A. Kornmayer2, P. Lobelle Pardo, M.U. Mozer, T. M ¨uller, Th. M ¨uller,
A. N ¨urnberg, G. Quast, K. Rabbertz, S. R ¨ocker, H.J. Simonis, F.M. Stober, R. Ulrich, J. Wagner-Kuhr, S. Wayand, T. Weiler, C. W ¨ohrmann, R. Wolf
Institute of Nuclear and Particle Physics (INPP), NCSR Demokritos, Aghia Paraskevi, Greece
G. Anagnostou, G. Daskalakis, T. Geralis, V.A. Giakoumopoulou, A. Kyriakis, D. Loukas, A. Markou, C. Markou, A. Psallidas, I. Topsis-Giotis
University of Athens, Athens, Greece
A. Agapitos, S. Kesisoglou, A. Panagiotou, N. Saoulidou, E. Stiliaris, E. Tziaferi
University of Io´annina, Io´annina, Greece
X. Aslanoglou, I. Evangelou, G. Flouris, C. Foudas, P. Kokkas, N. Manthos, I. Papadopoulos, E. Paradas, J. Strologas
Wigner Research Centre for Physics, Budapest, Hungary
G. Bencze, C. Hajdu, P. Hidas, D. Horvath17, F. Sikler, V. Veszpremi, G. Vesztergombi18,
A.J. Zsigmond
Institute of Nuclear Research ATOMKI, Debrecen, Hungary
N. Beni, S. Czellar, J. Karancsi19, J. Molnar, J. Palinkas, Z. Szillasi
University of Debrecen, Debrecen, Hungary
A. Makovec, P. Raics, Z.L. Trocsanyi, B. Ujvari
National Institute of Science Education and Research, Bhubaneswar, India
S.K. Swain
Panjab University, Chandigarh, India
S.B. Beri, V. Bhatnagar, R. Gupta, U.Bhawandeep, A.K. Kalsi, M. Kaur, R. Kumar, M. Mittal, N. Nishu, J.B. Singh
University of Delhi, Delhi, India
Ashok Kumar, Arun Kumar, S. Ahuja, A. Bhardwaj, B.C. Choudhary, A. Kumar, S. Malhotra, M. Naimuddin, K. Ranjan, V. Sharma
Saha Institute of Nuclear Physics, Kolkata, India
S. Banerjee, S. Bhattacharya, K. Chatterjee, S. Dutta, B. Gomber, Sa. Jain, Sh. Jain, R. Khurana, A. Modak, S. Mukherjee, D. Roy, S. Sarkar, M. Sharan
Bhabha Atomic Research Centre, Mumbai, India
A. Abdulsalam, D. Dutta, V. Kumar, A.K. Mohanty2, L.M. Pant, P. Shukla, A. Topkar
Tata Institute of Fundamental Research, Mumbai, India
T. Aziz, S. Banerjee, S. Bhowmik20, R.M. Chatterjee, R.K. Dewanjee, S. Dugad, S. Ganguly,
S. Ghosh, M. Guchait, A. Gurtu21, G. Kole, S. Kumar, M. Maity20, G. Majumder, K. Mazumdar,
G.B. Mohanty, B. Parida, K. Sudhakar, N. Wickramage22
Indian Institute of Science Education and Research (IISER), Pune, India
S. Sharma
Institute for Research in Fundamental Sciences (IPM), Tehran, Iran
H. Bakhshiansohi, H. Behnamian, S.M. Etesami23, A. Fahim24, R. Goldouzian, M. Khakzad,
M. Mohammadi Najafabadi, M. Naseri, S. Paktinat Mehdiabadi, F. Rezaei Hosseinabadi,
B. Safarzadeh25, M. Zeinali
University College Dublin, Dublin, Ireland
M. Felcini, M. Grunewald
INFN Sezione di Baria, Universit`a di Barib, Politecnico di Baric, Bari, Italy
M. Abbresciaa,b, C. Calabriaa,b, S.S. Chhibraa,b, A. Colaleoa, D. Creanzaa,c, L. Cristellaa,b, N. De
Filippisa,c, M. De Palmaa,b, L. Fiorea, G. Iasellia,c, G. Maggia,c, M. Maggia, S. Mya,c, S. Nuzzoa,b,
A. Pompilia,b, G. Pugliesea,c, R. Radognaa,b,2, G. Selvaggia,b, A. Sharmaa, L. Silvestrisa,2,
R. Vendittia,b, P. Verwilligena
INFN Sezione di Bolognaa, Universit`a di Bolognab, Bologna, Italy
G. Abbiendia, C. Battilana, A.C. Benvenutia, D. Bonacorsia,b, S. Braibant-Giacomellia,b,
L. Brigliadoria,b, R. Campaninia,b, P. Capiluppia,b, A. Castroa,b, F.R. Cavalloa, G. Codispotia,b,
M. Cuffiania,b, G.M. Dallavallea, F. Fabbria, A. Fanfania,b, D. Fasanellaa,b, P. Giacomellia,
C. Grandia, L. Guiduccia,b, S. Marcellinia, G. Masettia, A. Montanaria, F.L. Navarriaa,b,
A. Perrottaa, A.M. Rossia,b, T. Rovellia,b, G.P. Sirolia,b, N. Tosia,b, R. Travaglinia,b
INFN Sezione di Cataniaa, Universit`a di Cataniab, CSFNSMc, Catania, Italy
S. Albergoa,b, G. Cappelloa, M. Chiorbolia,b, S. Costaa,b, F. Giordanoa,2, R. Potenzaa,b,
A. Tricomia,b, C. Tuvea,b
INFN Sezione di Firenzea, Universit`a di Firenzeb, Firenze, Italy
G. Barbaglia, V. Ciullia,b, C. Civininia, R. D’Alessandroa,b, E. Focardia,b, E. Galloa, S. Gonzia,b,
V. Goria,b, P. Lenzia,b, M. Meschinia, S. Paolettia, G. Sguazzonia, A. Tropianoa,b
INFN Laboratori Nazionali di Frascati, Frascati, Italy
L. Benussi, S. Bianco, F. Fabbri, D. Piccolo
INFN Sezione di Genovaa, Universit`a di Genovab, Genova, Italy
R. Ferrettia,b, F. Ferroa, M. Lo Veterea,b, E. Robuttia, S. Tosia,b
INFN Sezione di Milano-Bicoccaa, Universit`a di Milano-Bicoccab, Milano, Italy
M.E. Dinardoa,b, S. Fiorendia,b, S. Gennaia,2, R. Gerosaa,b,2, A. Ghezzia,b, P. Govonia,b,
M.T. Lucchinia,b,2, S. Malvezzia, R.A. Manzonia,b, A. Martellia,b, B. Marzocchia,b,2, D. Menascea,
20 A The CMS Collaboration
INFN Sezione di Napolia, Universit`a di Napoli ’Federico II’b, Napoli, Italy, Universit`a della Basilicatac, Potenza, Italy, Universit`a G. Marconid, Roma, Italy
S. Buontempoa, N. Cavalloa,c, S. Di Guidaa,d,2, F. Fabozzia,c, A.O.M. Iorioa,b, L. Listaa,
S. Meolaa,d,2, M. Merolaa, P. Paoluccia,2
INFN Sezione di Padova a, Universit`a di Padova b, Padova, Italy, Universit`a di Trento c, Trento, Italy
P. Azzia, N. Bacchettaa, D. Biselloa,b, A. Brancaa,b, R. Carlina,b, P. Checchiaa, M. Dall’Ossoa,b,
T. Dorigoa, F. Gasparinia,b, U. Gasparinia,b, A. Gozzelinoa, M. Gulminia,26, K. Kanishcheva,c,
S. Lacapraraa, M. Margonia,b, A.T. Meneguzzoa,b, J. Pazzinia,b, N. Pozzobona,b, P. Ronchesea,b,
F. Simonettoa,b, E. Torassaa, M. Tosia,b, P. Zottoa,b, A. Zucchettaa,b, G. Zumerlea,b
INFN Sezione di Paviaa, Universit`a di Paviab, Pavia, Italy
M. Gabusia,b, A. Magnania, S.P. Rattia,b, V. Rea, C. Riccardia,b, P. Salvinia, I. Vaia, P. Vituloa,b
INFN Sezione di Perugiaa, Universit`a di Perugiab, Perugia, Italy
M. Biasinia,b, G.M. Bileia, D. Ciangottinia,b,2, L. Fan `oa,b, P. Laricciaa,b, G. Mantovania,b,
M. Menichellia, A. Sahaa, A. Santocchiaa,b, A. Spieziaa,b,2
INFN Sezione di Pisaa, Universit`a di Pisab, Scuola Normale Superiore di Pisac, Pisa, Italy
K. Androsova,27, P. Azzurria, G. Bagliesia, J. Bernardinia, T. Boccalia, G. Broccoloa,c, R. Castaldia,
M.A. Cioccia,27, R. Dell’Orsoa, S. Donatoa,c,2, G. Fedi, F. Fioria,c, L. Fo`aa,c, A. Giassia,
M.T. Grippoa,27, F. Ligabuea,c, T. Lomtadzea, L. Martinia,b, A. Messineoa,b, C.S. Moona,28,
F. Pallaa, A. Rizzia,b, A. Savoy-Navarroa,29, A.T. Serbana, P. Spagnoloa, P. Squillaciotia,27,
R. Tenchinia, G. Tonellia,b, A. Venturia, P.G. Verdinia, C. Vernieria,c
INFN Sezione di Romaa, Universit`a di Romab, Roma, Italy
L. Baronea,b, F. Cavallaria, G. D’imperioa,b, D. Del Rea,b, M. Diemoza, C. Jordaa, E. Longoa,b,
F. Margarolia,b, P. Meridiania, F. Michelia,b,2, G. Organtinia,b, R. Paramattia, S. Rahatloua,b,
C. Rovellia, F. Santanastasioa,b, L. Soffia,b, P. Traczyka,b,2
INFN Sezione di Torino a, Universit`a di Torino b, Torino, Italy, Universit`a del Piemonte Orientalec, Novara, Italy
N. Amapanea,b, R. Arcidiaconoa,c, S. Argiroa,b, M. Arneodoa,c, R. Bellana,b, C. Biinoa,
N. Cartigliaa, S. Casassoa,b,2, M. Costaa,b, R. Covarelli, A. Deganoa,b, G. Dellacasaa,
N. Demariaa, L. Fincoa,b,2, C. Mariottia, S. Masellia, E. Migliorea,b, V. Monacoa,b, M. Musicha,
M.M. Obertinoa,c, L. Pachera,b, N. Pastronea, M. Pelliccionia, G.L. Pinna Angionia,b,
A. Romeroa,b, M. Ruspaa,c, R. Sacchia,b, A. Solanoa,b, A. Staianoa, U. Tamponia
INFN Sezione di Triestea, Universit`a di Triesteb, Trieste, Italy
S. Belfortea, V. Candelisea,b,2, M. Casarsaa, F. Cossuttia, G. Della Riccaa,b, B. Gobboa, C. La
Licataa,b, M. Maronea,b, A. Schizzia,b, T. Umera,b, A. Zanettia
Kangwon National University, Chunchon, Korea
S. Chang, A. Kropivnitskaya, S.K. Nam
Kyungpook National University, Daegu, Korea
D.H. Kim, G.N. Kim, M.S. Kim, D.J. Kong, S. Lee, Y.D. Oh, H. Park, A. Sakharov, D.C. Son
Chonbuk National University, Jeonju, Korea
T.J. Kim, M.S. Ryu
Chonnam National University, Institute for Universe and Elementary Particles, Kwangju, Korea