i v
Sentiment Analysis in Geo Social Streams by using Machine
Learning Techniques
ii
SENTIMENT ANALYSIS IN GEO SOCIAL STREAMS BY USING
MACHINE LEARNING TECHNIQUES
Dissertation Supervised by
Francisco Ramos, PhD
Professor, Institute of New Imaging Technologies,
Universitat Jaume I,
Castellón, Spain
Dissertation Co-supervised by
Oscar Belmonte Fernandez, PhD
Assoc. Professor, Department de Llenguatges I Sistemes Informatics
Universitat Jaume I,
Castellón, Spain
Roberto Henriques, PhD
Assistant Professor, Sistemas e Tecnologias da Informação
Informação Universidade Nova de Lisboa,
Lisbon, Portugal
iii
ACKNOWLEDGMENTS
First and foremost, I want to thank my thesis supervisor Prof. Francisco Ramos for his continuous support on my research, for his patience, enthusiasm, guidance and motivation. He has been supportive from day one. He consistently allowed this research to be my own work, but directed me in the right path whenever he thought I needed it.
I am also thankful to Prof. Oscar Belmonte Fernandez and Prof Roberto Henriques for co-supervising me on my thesis.
I am also grateful to my classmates of MSc Geospatial Technologies for all the fun we have had in this Master’s course. There are too many of you to mention but I would especially like to thank Pravesh Yagol, Mahesh Thapa and Sanjeevan Shrestha. I am particularly grateful for the time and assistance given by my friend Amrit Karmacharya.
On a more personal note, I would like to thank my girlfriend, Usha Shrestha for never letting me doubt myself and for reminding me there is a whole world outside of my thesis. Finally, I must express my very profound gratitude to my family for providing me with encouragement throughout this period. This accomplishment would not have been possible without their unfailing support.
iv
SENTIMENT ANALYSIS OF GEO SOCIAL STREAMS USING
MACHINE LEARNING TECHNIQUES
ABSTRACT
Massive amounts of sentiment rich data are generated on social media in the form of Tweets, status updates, blog post, reviews, etc. Different people and organizations are using these user generated content for decision making. Symbolic techniques or Knowledge base approaches and Machine learning techniques are two main techniques used for analysis sentiments from text.
The rapid increase in the volume of sentiment rich data on the web has resulted in an increased interaction among researchers regarding sentiment analysis and opinion (Kaushik & Mishra, 2014). However, limited research has been conducted considering location as another dimension along with the sentiment rich data. In this work, we analyze the sentiments of Geotweets, tweets containing latitude and longitude coordinates, and visualize the results in the form of a map in real time.
We collect tweets from Twitter using its Streaming API, filtered by English language and location (bounding box). For those tweets which don’t have geographic coordinates, we geocode them using geocoder from GeoPy. Textblob, an open source library in python was used to calculate the sentiments of Geotweets. Map visualization was implemented using Leaflet. Plugins for clusters, heat maps and real-time have been used in this visualization. The visualization gives an insight of location sentiments.
v
KEYWORDS
Geovisualization Machine Learning Opinion Mining Sentiment Analysisvi
ACRONYMS
API – Application Programming Interface GPS – Global Positioning System
IDF – Inverse Document Frequency IR – Information Retrieval
LVQ – Learning Vector Quantization PCA – Principal Component Analysis PMI – Pointwise Mutual Information REST – Representational State Transfer SA – Sentiment Analysis
SO – Sentiment Orientation SVM – Support Vector Machine
vii
Table of Contents
ACKNOWLEDGMENTS ... iii ABSTRACT ... iv KEYWORDS ... v ACRONYMS ... vi INDEX OF FIGURES ... ix 1. INTRODUCTION ... 1 1.1 Background ... 1 1.2 Problem Statements... 2 1.3 Objectives... 32. CONCEPT AND DEFINITIONS ... 4
2.1 Background on Sentiment Analysis ... 4
2.1.1 Sentiment Analysis: An Introduction ... 4
2.1.2 Why Sentiment Analysis is Important? ... 4
2.1.3 Classification of Sentiment Analysis ... 4
2.2 Geovisualization... 9
3. LITERATURE REVIEW ... 11
3.1 Limitation of Prior Art ... 11
3.2 Related Work ... 11
3.2.1 Machine Learning Approach ... 12
3.2.2 Lexicon-based Approach ... 16
4. Methodology ... 18
4.1 Data Collection ... 19
4.1.1 Twitter API ... 19
viii 4.3 Geocoding ... 23 4.4 Pre-Processing ... 24 4.5 Sentiment Analysis ... 25 4.6 Data Storing ... 25 4.7 Visualization ... 26 5. RESULTS ... 28 6. CONCLUSIONS ... 34 REFERENCES... 36 ANNEX ... 40
ix
INDEX OF FIGURES
Figure 1: Sentiment Analysis Process on Product Reviews (Medhat, Hassan, &
Korashy, 2014) ... 5
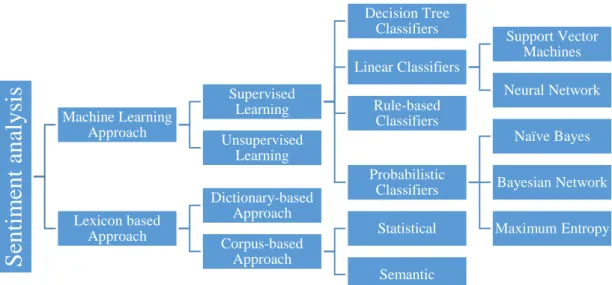
Figure 2: Sentiment Analysis Classification (Medhat et al., 2014) ... 5
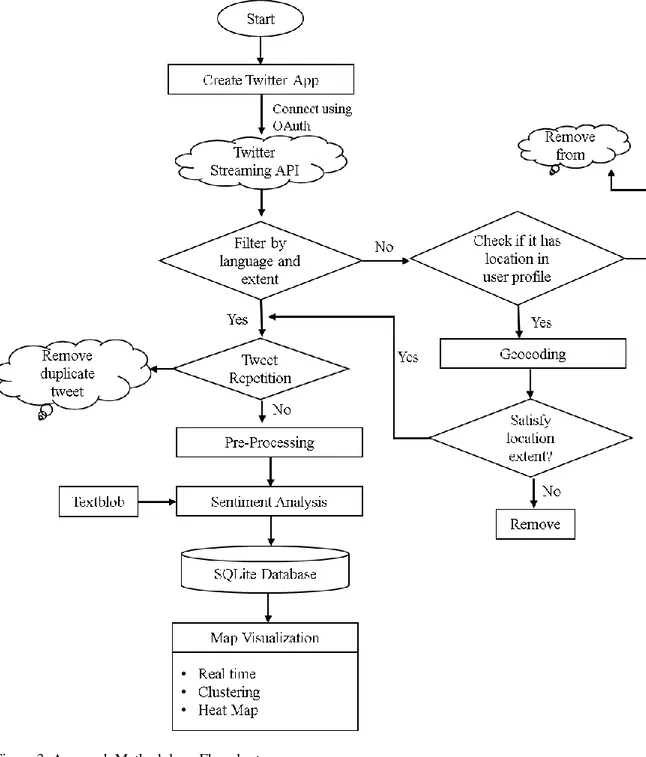
Figure 3: Approach Methodology Flowchart ... 18
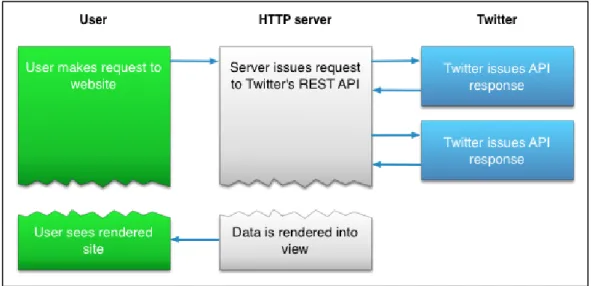
Figure 4: REST API ... 19
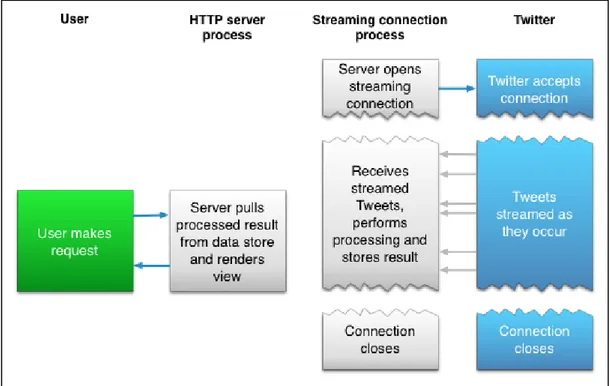
Figure 5: Streaming API ... 21
Figure 6: Possible states for the 3-legged sign in interaction ... 21
Figure 7: Filters for Twitter Streaming and their capabilities ... 23
Figure 8: SQLite server-less architecture ... 26
Figure 9: Screenshot of data stored in SQLite database ... 26
Figure 10: Heat maps and Pie-chart of sentiments for Lisbon ... 28
Figure 11: Heat map of Lisbon for Positive Sentiments ... 29
Figure 12: Heat map of Lisbon for Negative Sentiments ... 29
Figure 13: Tweets Cluster in Lisbon ... 30
Figure 14: Line graphs for Positive Vs Negative Vs Neutral Sentiments ... 30
Figure 15: Heat maps and Pie-chart of sentiments for Florida ... 31
Figure 16: Heat map of Florida for Positive Sentiment ... 32
Figure 17: Heat map of Florida for Negative Sentiment ... 32
Figure 18: Heat map of Florida for Neutral Sentiments ... 33
1
1. INTRODUCTION
1.1 Background
The internet has brought massive change in the way people express their views. Social media is generating a vast amount of sentiment rich data in the form of tweets, status updates, blog posts, product reviews, etc. (Neethu & Rajasree, 2013). “Rapid increase in the volume of sentiment rich social media on the web has resulted in an increased interact among researchers regarding sentiment analysis and opinion mining” (Kaushik & Mishra, 2014). The presence of a huge volume of opinionated data on the web has motivated many researchers to carry out research on such data. Individuals and different organization are increasingly using such data for decision-making. Although the main source of such sentiment rich data are from product review, it is not only limited to that. Product reviews can play a vital role in decision-making to the business holders as they can have an insight of the user’s opinion about the product and can make necessary improvements.
Besides that, sentiment analysis in Twitter data has been used for prediction or measurement in several domains, such as the stock market, political debates, news articles, sports debates and social movements (Bollen, Mao, & Zeng, 2011; Choy, Cheong, Laik, & Shung, 2011; Tumasjan, Sprenger, Sandner, & Welpe, 2010; Zeitzoff, 2011). With this vast amount of sentiment rich data in different domains came the need by companies, politicians, analysts and researchers to analyse the data for different users. For mining and analyzing these data, an automated technique is required as manual mining and analyzing are difficult and time consuming.
Twitter has become one of the most popular microblogging platforms for all ordinary people including celebrities, politicians, companies, etc. Identifying the sentiments of news articles about stock market can facilitate an investor’s decision-making as stock trends can be predicted with this technique (Yu, Wu, Chang, & Chu, 2013). The investors may be encouraged to buy more shares with the positive news thus forcing the price hike while negative news may have opposite effects. However, finding such information from news articles on daily basis is tedious task. Thus, sentiment analysis technique can play an important role in classification and identification of the positive and negative sentiments from stock market news for prediction of stock trend.
2 Most companies, if not all, are active in social media, and use microblogging site like Twitter to promote their brands and services. But, we should not take social media just as a platform to post and promote goods and services. From the managerial perspective, social media should also be considered as source of information about what the target user thinks about the services.
1.2 Problem Statements
This thesis aims to analyze the location based sentiment analysis for streams of geo-tweets in real-time to analyze geography of happiness. The first step is to identify a big data source, which can deliver data in real-time. This research is using Twitter Streaming API as a feeding data source. Secondly, it is important to have geographical coordinates from where the tweet was sent. The GPS capability in smartphones allow users to create social media data with geotags containing latitude and longitude coordinates. However most people don’t turn on the GPS service on their devices to save battery life. This narrows down our data source. To overcome this problem to a certain limit, we use geocoding services to get the geographical coordinates along with tweets. Once the tweet is captured with location information, the project will undertake detail data analysis.
People use very informal languages in most of social media. They create their own shortcuts and punctuation, use slangs and misspellings. Generally, tweets contains hash-tags (marked with the character #), white spaces, URLs, genre specific terminology and abbreviations, and special characters. Before analyzing the text, the text HTML, URLs, white spaces, punctuations, emoticons and special characters needed to be removed. After the pre-processing, it will generate more concise tweet strings, which will make the sentiment analysis process easier and more precise.
3
1.3 Objectives
The objectives of this research are as follows:
To connect with the Twitter API for collecting data using location and keyword as filters.
To apply an algorithm for automatic classification of tweets into positive, negative or neutral.
Visualization in the form of maps and analysis of the sentiments based on location.
4
2. CONCEPT AND DEFINITIONS
2.1 Background on Sentiment Analysis
2.1.1 Sentiment Analysis: An Introduction
Sentiment analysis (also referred to as: opinion mining, sentiment mining, sentiment classification, subjectivity analysis, review mining and in some cases polarity classification) refers to the use of natural language processing, statistics, text analysis and machine learning methods to extract and identify sentiments from the source materials. Although, sentiment analysis and opinion mining are referred to as synonyms, (Tsytsarau & Palpanas, 2012) stated that sentiment analysis and opinion mining have slightly different notions. The authors stated that, opinion mining extracts and analyses people’s opinion about an entity while sentiment analysis identifies the sentiment expressed in a text then analyses it. Therefore, sentiment analysis deals with extracting opinions, identifying sentiments expressed in the text and classifying them according to their polarity.
2.1.2 Why Sentiment Analysis is Important?
There are millions of online users around the world, who use the internet to write and read things. The internet has made life easier for those who wants to express their opinions. The sentiments expressed online have become one of the most significant factors in decision-making. Dimensional Research conducted a survey, which discusses the percentage of trust people have in online reviews (Freund & Cellary, 2014). The study suggests 74% of customer’s confidence is based on reading online recommendations or reviews in 2011, 60% in 2012, and 57% in 2013. However, this figure increases massively in 2014 with 94% customers having trust in online sentiments.
2.1.3 Classification of Sentiment Analysis
The classification process of sentiment analysis of product reviews can be illustrated as in Figure 1. The existing work done on sentiment analysis can be classified according to the level of detail of text, techniques used, etc.
5
Figure 1: Sentiment Analysis Process on Product Reviews (Medhat, Hassan, & Korashy, 2014)
2.1.3.1 Techniques
The following approaches are used for the sentiment classification. A. Machine learning approach
B. Lexicon-based approach
Figure 2: Sentiment Analysis Classification (Medhat et al., 2014)
Sen
tim
en
t
an
aly
sis
Machine Learning Approach Supervised Learning Decision Tree Classifiers Linear Classifiers Support Vector Machines Neural Network Rule-based Classifiers Probabilistic Classifiers Naïve Bayes Bayesian Network Maximum Entropy Unsupervised Learning Lexicon based Approach Dictionary-based Approach Corpus-based Approach Statistical Semantic6 A. Machine Learning Approach
The machine learning technique uses linguistic features, and is one of the most useful techniques to classify sentiments and categorized the text into positive, negative or neutral categories. The text classification methods using ML approach is classified into two basic approaches as follows:
1. Supervised Machine Learning Approach
Supervised technique is used for classifying the document or sentence into positive, negative and neutral, and this approach depends on the existence of labelled training documents. In this approach, the system classifies the document based on the training dataset using one of the common classification algorithm or combination of different algorithm. The algorithms or the families of algorithms used in this approach are as follows:
a) Decision tree Classifier b) Linear Classifier
i. Support Vector Machine ii. Neural Network (Perceptron) c) Rule Based Classifier
d) Probabilistic Classifier i. Naïve Bayes ii. Bayesian Network iii. Maximum Entropy
2. Unsupervised Machine Learning Approach
In supervised learning approach, large number of labelled training documents are used for text classification. However, sometimes it is difficult to create these labelled documents. Unsupervised learning approach overcome these difficulties. In this method, it breakdown documents to sentences, and then categorized the sentences using keywords or opinion words. Sentiment Orientation (SO) of these keywords are determined and based on whether the SO is positive, negative or neutral, the documents are classified.
7 B. Lexicon Based Approach
Lexicon based technique work on an assumption that the collective polarity of a document or sentence depends on the polarity of the micro phrases or words that compose it. In other words, the collective polarity is the sum of polarities of the individual words or phrases. A microphrase is built whenever a splitting cue is found in the text. Conjunctions, adverbs and punctuations are used as splitting cues. For example, in this sentence “I don’t like this weather, it’s hot”, the comma “,” acts as a splitting cue. The lexicon based technique can be also divided as follows:
1. Dictionary Based Approach
In a dictionary-based approach, first it finds the opinionated words from the document and then searches the dictionary for their synonyms and antonyms. It counts the number of positive and negative words from predefined lexicon in a big corpus, and gives the sentiments of the document. (Goyal & Daumé III, 2011) suggested that dictionaries can also be created manually for lexicon-based approaches using seed words to expand the list of words. This approach is unsupervised in nature and it assumes that positive adjectives appear more frequently with positive opinionated words and negative adjectives appear more frequently with negative opinionated words (Harb, Planti, Roche, & Cedex, 2008).
2. Corpus Based Approach
Corpus based approach is a data driven approach in which, sentiments of opinionated words are found from a large corpus along with their context. This approach requires large dataset to calculate polarity and consequently sentiment of the document. This approach relies on the polarity of the terms that appear in the training dataset. If the terms don’t appear in the training corpus, it doesn’t calculate its polarity, which is one of the major drawbacks of this approach.
8 2.1.3.2 Text View
Based on the nature of the text view, sentiment analysis is further categorized into three levels: document level, sentence level and aspect level also known as feature level sentiment analysis.
A. Document Level Sentiment Analysis
In document level sentiment analysis, the whole document is considered as a single unit. It classifies the document and expresses the overall sentiments as positive, negative or neutral. Subjectivity or objectivity classification is very important in this type of classification. The document level sentiment analysis has its own benefits and drawbacks. The main advantage of document level sentiment analysis is getting an overall polarity of whole opinion text, which may be also considered as a drawback as a document may consist of different emotions about different features, which cannot be extracted separately. As a result, the emotions with minority are overshadowed by the majority emotions. Generally, this type of classification is not desirable in forums and blogs. Both supervised and unsupervised techniques can be used in document level classification. Supervised techniques like Naïve Bayesian and Support vector machine can be used to train a system while unsupervised technique can be applied by extracting opinions from the document and finding semantics of the extracted words or phrase.
B. Sentence Level Sentiment Analysis
Sentence level sentiment analysis has similar approach to that of the document level sentiment analysis, but in this method, the polarity of each sentence is calculated instead of the whole document. Sentences are just like short documents. Likewise, to document level sentiment analysis, the first step is to identify whether the sentence is subjective or objective. The opinionated words in a subjective sentence helps to determine the sentiments, which are later classified into positive, negative and neutral classes. (Wilson, Wiebe, & Hoffman, 2005) have pointed out that sentiment expressions are not necessarily subjective in nature. For example, “I love this story” is a subjective sentence with positive sentiment; whereas “This is a love story” is an objective sentence with neutral sentiment. The benefit of sentiment level sentiment analysis deceives the subjectivity/objectivity classification.
9 C. Aspect/Feature Level Sentiment Analysis
Many applications require detailed opinions for text classification which, both document level sentiment analysis and sentence level sentiment analysis cannot provide. To achieve the detailed opinions from the text, we need to go to the aspect level sentiment analysis, which is also referred to as feature level sentiment analysis. This approach classifies the sentiments in text with respect to specific aspects of entities. Aspect level sentiment analysis also has its own advantages and disadvantages, with an advantage being accurate extraction of opinions. However, in some cases, where the negating words are far apart from the opinion words, the result may not be fully accurate. Phrase level analysis is not desirable in such cases. For example, the sentence “The picture quality of this phone is good, but the battery life is
short” has different opinions for different aspects of the same entity.
2.2 Geovisualization
Geovisualization stands for Geographic Visualization. Wikipedia defines Geovisualizatoin as a set of tools and techniques for analysis of geospatial data through the use of interactive visualization (Wikipedia). MacEachren and Kraak (2011) refers to “geovisualization as set of cartographic technologies and practices that take advantage of the ability of modern microprocessors to render changes to a map in real time, allowing users to adjust the mapped data on the fly”. It emphasizes the construction of knowledge over knowledge storage or information transmission (MacEachren & Kraak, 2011). Geovisualization when combined with human understanding, allows for data exploration and decision making processes (Jiang & Li, 2005; MacEachren & Kraak, 2011; Pultar et. al., 2009; Rhyne et al., 2004).
Visualization is an important part of data analysis process for efficient exploration and description of complex dataset. It helps to summarize the main characteristics of the datasets with a visual graph. The datasets can be visualize in the form of histogram, line chart, bar chart, pie chart and so on. There are significant amount of researches done on sentiment analysis. However, verylittle research has visualized the results. It’s not enough to just classify the sentiments without proper visualization. In this research,
10 we are analyzing stream of tweets with location, filtered by keywords, language or some geographical extent (bounding box). Therefore, to have actionable insights, we need to visualize the differences in sentiment by location. For example, let’s consider the weather report in TV channels. They show the weather information like fog, rain or snow, displayed over a map as a background. That visualization gives us a detailed look on the weather and most importantly, where, the location information. In a similar way, sentiments can also be visualized based on location.
11
3. LITERATURE REVIEW
3.1 Limitation of Prior Art
A decent amount of research has been done on sentiment analysis in different domains. These research differs from Twitter mainly because of the character limit allowed from the Twitter. The character limit allowed by Twitter was 140 characters per tweet earlier. Twitter has now changed that to 280 characters per tweet. With the popularity of microblogging sites and social networking sites like Twitter and Facebook, they are considered a good source of sentiment rich data. (Tumasjan et al., 2010) analyze over 100000 political tweets published between August 13th and September 19th 2009, prior to the German national election to predict the election. The authors used LIWC2007, Linguistic Inquiry and Word count, (Pennebaker, Chung, Ireland, Gonzales, & Booth, 2007) to automatically extract the sentiments from these tweets. The authors examine the attention the political parties received on Twitter and analyzed the ideology between the parties and potential political coalitions after the election in order to understand whether tweets can help to predict the election outcome. A system was developed for the real-time Twitter sentiment analysis of 2012 U.S. Presidential Election Cycle (H. Wang, Can, Kazemzadeh, Bar, & Narayanan, 2012) which offers new and timely perspective on the dynamics of the electoral process and public opinion to the media, politicians, scholars and public. Although lots of research has been done in this field, there is still a need of proper visualization of the analysis for comparisons between results achieved from different techniques. Most available visualizations are limited to pie charts, bar diagram, line graphs, scatter plot, etc. and to some extent heat maps.
3.2 Related Work
(Medhat et al., 2014) stated that sentiment analysis can be classified in two main categories: Machine Learning Approach and Lexicon-based Approach (Figure 2). The machine learning approach is further divided into Supervised learning and unsupervised learning, the former being divided into different classifying techniques. Lexicon-based approach is divided into Dictionary-based approach and Corpus-based approach. Much research on sentiment analysis has be carried out using these
12 techniques. The research so far has mainly focused on two things: identifying whether a given text is subjective or objective, and identifying polarity of subjective texts (Pang & Lee, 2006).
3.2.1 Machine Learning Approach
Naïve Bayes and Support Vector Machines are the two most used techniques for sentiment analysis. These supervised learning techniques provides best results and are very expensive as manual labelling is required. Some work has been done using unsupervised (e.g., (Brody & Diakopoulos, 2011; Turney, 2002)) and semi-supervised (e.g., (Barbosa & Feng, 2010; Pak & Paroubek, 2010)) approaches leaving lots of room for further improvements.
3.2.1.1 Unsupervised Learning Approach
(Turney, 2002) presents a simple unsupervised learning algorithm for classifying reviews predicted by the average semantic orientation (SO) of the phrases in the review containing adjectives or adverbs. The reviews were classified as recommended (thumbs up) or not recommended (thumbs down). The algorithm classifies the written review in three steps.
First, to identify the phrase in the input text/review containing adjectives or adverbs, the author used part-of-speech tagger. It is a simple process of identification of words as nouns, verbs, adjectives, adverbs, etc. Some words may have dual orientation depending upon the context. Therefore, two consecutive words are extracted, one adjective or adverb and the second providing context.
Second, the semantic orientation of the extracted phrase is estimated using PMI-IR algorithm. The algorithm uses Pointwise Mutual Information (PMI) and Information Retrieval (IR) to measure the similarity of pairs of words or phrases. The phrase is compared to a positive reference word and negative reference word to calculate the semantic orientation. The word “excellent” was used as positive reference word while for negative reference, the word “poor” was used.
In the third step, the author assign the calculated semantic orientation to a class, recommended or not recommended, based on the average semantic orientation of the
13 phrase extracted from the review. The review is assigned as recommended if the average semantic orientation is positive. The author evaluated 410 reviews from Epinions, sampled from four different domains (reviews of automobiles, banks, movies, and travel destinations). Average accuracy of 74% was achieved with automobile reviews getting the highest accuracy of 84% and movie reviews getting the lowest of 66%.
(Brody & Diakopoulos, 2011) present an unsupervised method for sentiment detection in microblogs using word lengthening. The method used word lengthening phenomenon to expand an existing sentiment lexicon and tailor it to the domain. The authors detect the sentiment in three steps. First, the authors demonstrate the widespread use and importance of word lengthening in microblogs and social messaging. Normally people use the lengthening phenomenon to emphasize important words conveying sentiments and emotions. The authors showed the association of lengthening with subjectivity and sentiments in the second part. Finally, an unsupervised method was used to demonstrate the implications of that association for detecting sentiments using an existing sentiment lexicon. For evaluation, the authors compared the methods to human judgement through volunteers and categorized into five class: strongly negative, weakly negative, neutral, weakly positive, and strongly positive.
3.2.1.2 Supervised Learning Approach
(Suresh & Bharathi, 2016) classified sentiments from the RatingSystem.com database using decision tree based feature selection. The customer review information is collected in the database in the form of web forms and emails. In this algorithm, Inverse document frequency (IDF) are used to extract features from the database. The use of the Principal Component Analysis (PCA) decreases the features. The authors used a local classification algorithm, Learning Vector Quantization (LVQ) for effective classification obtaining 75% of accuracy.
Most of the techniques in sentiment analysis use information from diverse sources. The Support Vector Machines (SVMs) approach provides ideal tool in bringing these sources together and is one of the most commonly used approach by the researchers in sentiment analysis field. Support Vector Machines is a well-known and powerful tool
14 for classifying vectors of real-valued features as positive or negative. (Mullen & Collier, 2004) use support vector machines to analyze sentiments from diverse information sources. The authors used the approach adopted by (Turney, 2002) to predict the semantic orientation expressed by a word or phrase using part-of-speech tagger to identify the adjectives or adverbs in the phrase. Further, the authors used WordNet relationships, method of Kamps and Marx (2002) to derive three values appropriate to the emotive meaning of adjectives. The three values introduced in Charles Osgood’s Theory of Semantic Differentiation are potency (strong or weak), activity (active or passive) and evaluative (good or bad). The authors believes that sentiment expressed with respect to particular subjects can be best identified with reference to the subject itself. The feature space created from employing semantic orientation values from different sources were separated using an SVM. The SVM technique uses a kernel function to map a space of data points. The authors analyze sentiment analysis on two different datasets: first datasets consisting of total 1380 Epinions.com movie reviews and a second dataset consisting of 100 record reviews from the Pitchfork Media online record review publication.
(Santos & Gatti, 2014) proposed a deep convolutional neural network that exploits from character-to-sentence level information to perform sentiment analysis of short texts. The authors applied the approach for two short texts of two different domains: the Stanford Sentiment Tree-bank (STTb) containing movie reviews; and the Stanford Twitter Sentiment Corpus (STS), containing twitter messages. The proposed network, named Character to Sentence Convolutional Neural Network (CharSCNN), uses two convolutional layers to extract relevant features from words and sentences to explore the richness of word embeddings produced by unsupervised pre-training. With this approach, the authors achieves 85.7 % accuracy in positive/negative classification for SSTb corpus while for the STS corpus, the achieved accuracy is 86.4%.
(Troussas, Virvou, Espinosa, Llaguno, & Caro, 2013) stated few challenges for opinion mining in sentiment analysis from the system developer’s viewpoint. One of the challenges includes the insignificance of all the words in a sentence and the possibility of insignificant words being classified as noise. The authors mentioned that, some words like “not” might provide negative meaning to the existing opinion even if they are used with a positive words. The authors see another big challenge in how data are
15 collected for corpus. They developed a system able to classify an opinion using sentence-level classification. Their methods use Facebook application as a main user interface to collect data for the corpus. While collecting the data, they focus on the user’s Facebook status post excluding photo stories and application stories. The authors use Naïve Bayes Classifier, Rocchio Classifier and Perception Classifier to compare their performance in terms of precision, recall and F-score in predicting whether a Facebook status update is positive or negative. Around 7000 status updates from 90 users were collected for the classification and the same training and testing set were used for each classifier.
(Berger, Pietra, & Pietra, 1996) in their research prove that Maximum Entropy technique can be effective in number of natural language processing applications. Since Maximum Entropy allows the unrestricted use of contextual features, it is the convenient for natural language processing among several machine learning algorithms. (Y.-Y. Wang & Acero, 2007) also mentioned that the Maximum Entropy algorithm supports convex objective function converging to a global optimum with respect to a training set. (Lee & Bhd, 2011) used Maximum Entropy classification for the comments in Chinese language given for electronic product to examine the effectiveness of the techniques in a language different than English.
First, to retrieve the meaning of the sentences, the authors did segmentation, which then followed by application of conjunction rules, elimination of stop words and punctuation, dealing with negation, and comparison with keywords. The authors classified the results into positive and negative class. Furthermore, the authors also analyze the feature selection and pre-processing of the messages for training and testing purpose, apart from presenting the results obtained from Maximum Entropy technique.
The authors found the increment in overall accuracy of sentiment analysis stage by stage from 81.65% to 87.05% thus proving higher accuracy can be achieved using Maximum Entropy classification. Other researchers (Nigam, John, & McCallum, 1999) also found that Maximum Entropy works better than Naïve Bayes for their experiment.
16 3.2.2 Lexicon-based Approach
In a Lexicon-based approach, the semantic orientation of words or phrases in a document are used to calculate the semantic orientation of the document (Turney, 2002). In most of the research based on lexicon-based approach, the semantic orientation of the text is calculated using adjectives as indicators. Previous studies also show that adjectives are good indicators of semantic orientation (Hatzivassiloglou & McKeown, 1997).
3.2.2.1 Dictionary-based approach
(Cruz, Ochoa, Roche, & Poncelet, 2016) experiments dictionary based sentiment analysis over two domains: Agricultural domain and a Movie domain. For the agricultural domain, the authors extracted the opinions from Twitter while for the Movie domain, they used the dataset introduced in (Pang, Lee, & Vaithyanathan, 2002). First, the authors acquired the data containing positive and negative opinion, for specific domain from the web followed by preprocessing to remove HTML tags and scripts from the text. The opinion adjectives and nouns extracted using POS-Tagging and the Window Size algorithm are used to compute correlation score, which is classified into positive and negative lexicons. (Chopra & Bhatia, 2016) also followed similar algorithm, but for the text in Punjabi language. In their experiment, the authors found that positive words are used less in reviews in comparison with the negative words.
3.2.2.1 Corpus-based approach
Moreno-Ortiz & Fernández-Cruz (2015) applied corpus-based, machine learning sentiment analysis approach for financial text. The authors used a simple 3-step model based on weirdness ratio to extract candidate term from the corpora, which are then matched against existing general language polarity database. This approach allows to obtain sentiment-bearing words whose polarity is domain specific. (Abdulla, Ahmed, Shehab, & Al-ayyoub, 2013) also performed corpus based sentiment analysis for an Arabic dataset composed of 2000 Tweets; 1000 positive and 1000 negative. The
17 authors observed that the accuracy of corpus-based tool using SVM for classification yields higher accuracy.
18
4. Methodology
This section will explain the architecture of our system along with the main components. The process begins with data collection from Twitter API, Data Filtering, Geocoding, Pre-Processing, Sentiment analysis, Data storage and finally map visualization. Figure 3 represents the system architecture.
19
4.1 Data Collection
4.1.1 Twitter API
An API, or Application Programming Interface, is the instruction set that allows two software programs to communicate with each another. It allows for a smooth access and interaction with Twitter data and its features. The access to an open API allows developers to develop technology and clients to use that technology. Twitter provides two APIs: REST API and Streaming API. Both APIs requires OAuth authentication: either application-only authentication or application-user authentication to request data.
REST APIs work in a request and response way. It is the most common way to access Twitter data. Clients send Requests to servers and server Respond to a client’s Request. REST API provides two main functionalities of GET data from Twitter and POST data to Twitter. The connection to the server is terminated once the requested data is received. REST API allows access to twitter data such as status updates (tweets) and user info regardless of time. Twitter does not make available the data, which are older than a week, so, the REST access is limited to the tweets less than one week old. In addition, Twitter has limited the number of tweets a user can extract using REST API to 3200 tweets, regardless of the query criteria.. Moreover, the number of request a user can make is limited to 180 request in a period of 15 minutes. Nevertheless, REST API meets the needs of most Twitter application programmers.
Figure 4: REST API
20 The streaming API delivers data based on users requested criteria like by keyword, location, etc. along with the info about the author, in real-time. In a Streaming API, whenever a client sends a Request to the server, the server continuously send streams of Response whenever an update is available. However, the Streaming API requires continuous connection between the client server and the Twitter. One advantage of Streaming API is that, there is no such rate limits as in REST API, and the connection is open for as long as possible. The Streaming API is different from REST API in a sense that REST API is only used to pull data from Twitter whereas Streaming API also pushes data thus allowing more data to be downloaded in real time than using the REST API. The Twitter Streaming API has three variations:
a) The Public Stream: This allows us to monitor public data on Twitter, such as tweets, hashtags, etc. via our application.
b) The User Stream: This allows us to track tweet streams of a specific user in real time.
c) Site Streams: The Site Streams require prior approval from Twitter. It allows us to monitor real-time Twitter feeds for a hefty number of user through our application.
Studies have estimated that the clients receive data anywhere from 1% to over 40% in near real-time using Twitter’s Streaming API. Twitter Firehose overcome this problem with guaranteed delivery of 100% of the data that match user’s criteria. However, it is only available commercially.
21
Figure 5: Streaming API
(Source: Twitter Developer Archive https://archive.li/t6jp4)
Data Collection
The tweets for this research are collected using Twitter’s Streaming API. We used Tweepy, an easy-to-use python library for accessing the Twitter API. First, to obtain the OAuth application keys, the user should sign in to the Twitter developer site,
https://apps.twitter.com with their credentials. A new application should be registered
by clicking on “Create New App”. The authorization is called 3-legged authorization and it allows the application to obtain an access token. The 3-legged sign in interaction is illustrated in the flowchart in Figure no 5.
Figure 6: Possible states for the 3-legged sign in interaction
22 Tweepy is an open source library that handles the authentication, connection, creating and destroying the session, reading incoming messages, and partially routing messages, thus making it easier to use the Twitter Streaming API for Python. There are three steps using the Streaming API with Tweepy:
1. Creating StreamListener
First, a class for StreamListener should be created. Stream listener are used to print text. The on_data method on Tweepy’s StreamListener conveniently passes data from status to the on_status method. The python script for creating StreamListener is as follows:
>>> import tweepy
>>> class MyStreamListener(tweepy.StreamListener) >>> def on_status(self, status):
>>> print(status.text)
2. Creating Stream
A Stream establishes a streaming session and routes messages to StreamListener. An API authentication is needed. Once both StreamListener and API is ready, stream object can be created.
>>> myStreamListener = MyStreamListener( )
>>> twitterStream = tweepy.Stream(auth = api.auth, listener = myStreamListener())
3. Starting Stream
Most of the twitter streams available through Tweepy uses filters, the user_stream or the sitestream. In this research, we use filter by language and location (bounding box). The script is written in such a way that, it can be further filtered with keywords or hashtags. An example of stream filter with language and bounding box is as follows:
>>> twitterStream.filter (languages = [“en”], locations = [-9.50, 38.68, -8.78, 39.32])
Apart from these above-mentioned three steps, errors should also be handled, as streams does not terminate unless the connection is closed. There is a possibility of
23 crossing the rate limit defined by Twitter. In such cases, we can use on_error to catch such failed attempts and disconnect our stream.
4.2 Data Filtering
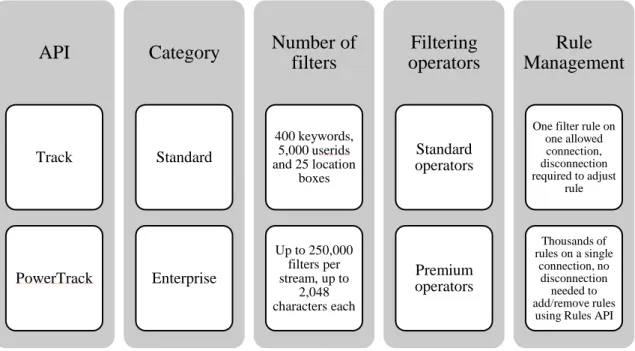
The Twitter API platform offers two options for streaming real-time Tweets, each offering a varying number of filters and filtering capabilities (Figure:7 ).
Figure 7: Filters for Twitter Streaming and their capabilities
(Source: Twitter Developer https://developer.twitter.com/en/docs/tweets/filter-realtime/overview )
For this research, we use Standard Track filter for filtering Tweets by language, location and keywords in real-time. As we can see in thefigure above, the standard filters are only allowed to use one filter at one connection, first we filtered the tweets by language in English followed by location using a bounding box. We can turn on and off the location filter from the code. In addition to that, the script is written in such a way that we can also filter the Tweets stream with keywords.
4.3 Geocoding
Google geocoder, Yahoo geocoder, geocoder.us (only for US address), Microsoft MapPoint, GeoNames and MediaWiki are some of the available geocoding web
API Track PowerTrack Category Standard Enterprise Number of filters 400 keywords, 5,000 userids and 25 location boxes Up to 250,000 filters per stream, up to 2,048 characters each Filtering operators Standard operators Premium operators Rule Management
One filter rule on one allowed connection, disconnection required to adjust rule Thousands of rules on a single connection, no disconnection needed to add/remove rules
24 services. Geocoders allows us to get geographic coordinates from textual location, the process is called forward geocoding. Google geocoder and GeoNames also offer capabilities of reverse geocoding (finding textual location from geographic coordinates). It is not necessary that all the tweets are tagged. If the tweets are geo-tagged, then it will proceed to the next step. Else, the program will check, whether there is place name available or not in location description of the user profile. If the place name is unavailable, the tweets will be ignored as we are only analysing the tweets with geographical coordinates. If the place name is available in user profile, the place name will be geocoded, and checked if it lies within our initial boundary extent. Only the tweets satisfying the condition will proceed to next step. In this research, we use geocoders from GeoPy to locate the coordinates of Tweets without coordinate information. GeoPy is a Python package which relies on a web API to do the conversion. As we are using Google Maps API’s standard usage, there is a limit of 2500 free request per day, calculated as the sum of client-side and server-side queries. Also, the limit of requests per second is 50, which is also the calculated sum of client-side and server-client-side queries.
4.4 Pre-Processing
Pre-processing is the process of cleaning and preparing the text for classification. Online texts contains lots of unnecessary and uninformative parts such as HTML tags, scripts and advertisements. The case is even worse in case of social media as the language used by the users is very informal. In addition to that, the users even create their own words and spellings shortcuts and punctuation, misspellings, slang, URLs, etc. These data needs to be cleaned before analysing the sentiments of the text. In this research, the pre-processing includes the removal of URLs, @user and hashtags. For example:
“@xyz I really love that shoes at #sprinter.
https://www.sprinter.es/tienda-sprinter-castellon ”
The above text will be like following after pre-processing: “I really love that shoes at sprinter”
25
4.5 Sentiment Analysis
Initially we planned to use a machine learning sentiment analysis algorithm from MonkeyLearn using an application called Zapier, a web based service that allows end users to integrate the web applications. However, the application is free only if we classify each tweet manually. They charge a certain amount of money if we build a model for automation of our workflow. The idea was then dropped in the middle of this research and we opt for Textblob.
TextBlob is an open source text processing library written in Python with capabilities to perform various natural language processing tasks such as part-of-speech tagging, noun-phrase extraction, sentiment analysis, text translation and many more. TextBlob is more easily-accessible and is built on top of Natural Language Toolkit (NLTK). TextBlob is popular for its fast prototyping that doesn’t require highly optimized performance.
4.6 Data Storing
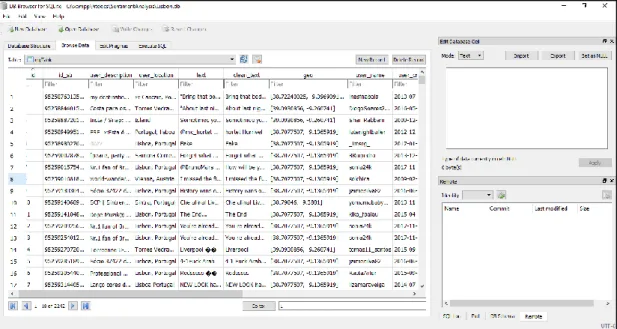
After Sentiment Analysis, the Tweets along with geographical coordinates, polarity, subjectivity and other user information were stored in SQLite database. SQLite is a software library that provides relational database management system with noticeable features like server-less, self-contained, zero configuration, and transactional. The lite in SQLite refers to light weight in terms of setup, database administration, and required resources.
Unlike other Relational Database Management System (RDBMS) such as MySQL, PostgreSQL, etc., SQLite doesn’t require a separate server process to operate. SQLite database is integrated with an application that interact with the database read and write directly from the database files stored on disk. The SQLite server-less architecture is illustrated in following diagram.
26
Figure 8: SQLite server-less architecture (Source: https://sqlite.org/docs.html)
In addition to that, we don’t need to install SQLite before using it because of the server-less architecture. It also requires minimal support from the operating system or external library making it usable in any environment.
Figure 9: Screenshot of data stored in SQLite database
4.7 Visualization
After getting the data to the server, we require visualization of data. Since we opt for a web based visualization, a webserver based visualization was implementation based on web technologies of client server for publishing, HTML/CSS/JavaScript for presentation and PHP for communication and control is suitable for our case.
27 Our visualization is based on internet browsers technologies which are supported by all the major internet browsers (Firefox, Chrome, and Opera). It should work on any standard browsers, but have not been tested as it is out of scope. The browsers being the client, an apache server serves up the pages to the clients. Apache is implemented through the XAMPP infrastructure as it is best for development with many debugging facilities, but it may not be the best for production stage.
XAMPP is an easy to install Apache distribution containing MySQL, PHP, and Perl. XAMPP is a very easy to install Apache Distribution for Linux, Solaris, Windows, and Mac OS X. The package includes the Apache web server, MySQL, PHP, Perl, a FTP server and phpMyAdmin. Here we require only apache and PHP.
Map visualization is implemented through Leaflet. Leaflet is a widely used open source JavaScript library used to build web mapping applications. It supports most mobile and desktop platforms, supporting HTML5 and CSS3. Along with OpenLayers, and the Google Maps API, it is one of the most popular JavaScript mapping libraries and is used by major web sites such as FourSquare, Pinterest and Flickr. We choose it for its easy use and small size which improves performance and its rich plugins. Plugins for clusters, heatmaps and realtime have been used in this visualization. Realtime fetches data every 3 seconds from an API and provides data to clusters and heatmaps. Clusters and heatmaps form a major part of visualization. Realtime uses Asynchronous JavaScript and XML (AJAX) so that the page load times are reduced and the data integration is efficient. So far we have not felt any lag in the visualization, except during initialization. During initialization, traffic load is heavy so some lag is expected.
An API is implemented to connect the SQLite data and convert it to GeoJSON format. GeoJSON formats can be easily consumed by leaflet as well as other visualization mediums. The API is implemented through PHP. The process of updating the database by python and visualization by PHP can run in parallel.
28
5. RESULTS
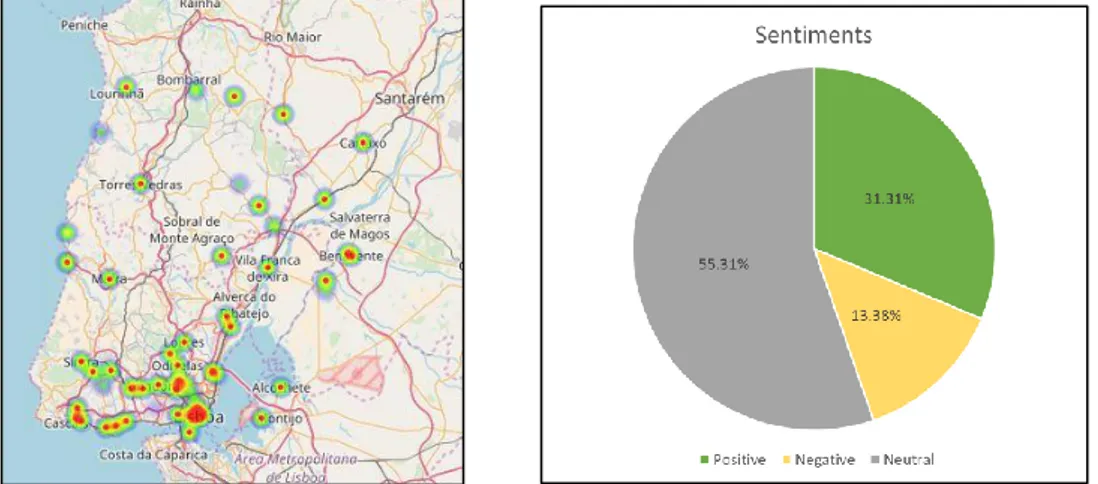
For our experiment about location-based sentiment analysis of tweets for Lisbon, we collected 2245 tweets over a period of 9 days. No any specific topics were covered for this purpose. We didn’t use any keywords to filter these tweets. We tried to analyze the trends and patterns about people’s sentiments from general text. 1240 (55.31%) were classified as having neutral sentiments. 31.31% of tweets were positive while 13.38% have negative sentiments. Furthermore, from the heat map in Figure 10, we can clearly observe that, the tweets are mostly concentrated in and around Lisboa Municipality. One of the reasons behind this is geocoding. As tweets without geographical coordinates and having their location as Lisbon in their Twitter Profile are geocoded to same geographical coordinates in Lisbon.
Figure 10: Heat maps and Pie-chart of sentiments for Lisbon
Figure 11 and 12 shows the heat maps of Lisboa for positive and negative sentiments respectively. It is quite clear from the heat maps that the number of tweets with negative sentiments are comparatively lesser than the tweets with positive sentiments. From the heat maps, we can have an overview of sentiments of people on the basis of location. We can say that, people in an around Lisboa are more positive in general.
29
Figure 11: Heat map of Lisbon for Positive Sentiments
30
Figure 13: Tweets Cluster in Lisbon
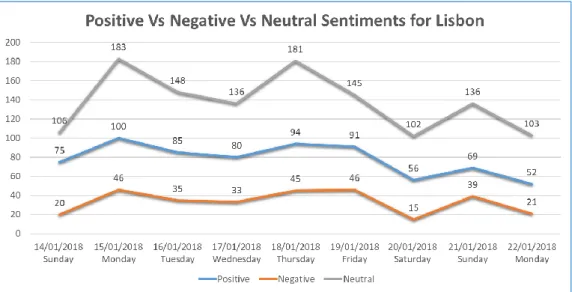
31 The line graph in Figure 14 shows a comparison of the positive vs negative vs neutral sentiments of twitter users in Lisbon. It can be seen that, the trend of the increasing and decreasing of positive sentiments is similarto negative sentiments. Both positive and negative sentiments record highest number of tweets on Monday, 2018/01/15 and lowest on Saturday, 2018/01/20. Whereas, the graph of neutral sentiments has sharp changes. Monday, 2018/01/15 and Thursday 2018/01/18 recorded the highest with 183 and 183 tweets respectively. It reached the bottom low on Saturday 2018/01/20 with 102 tweets.
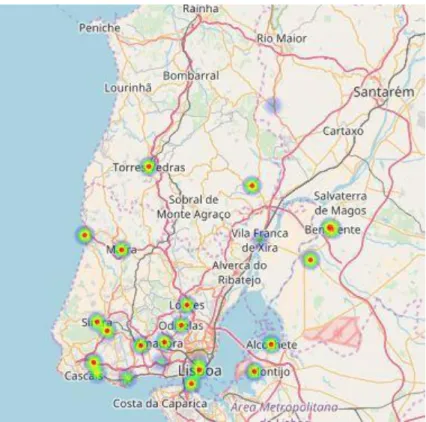
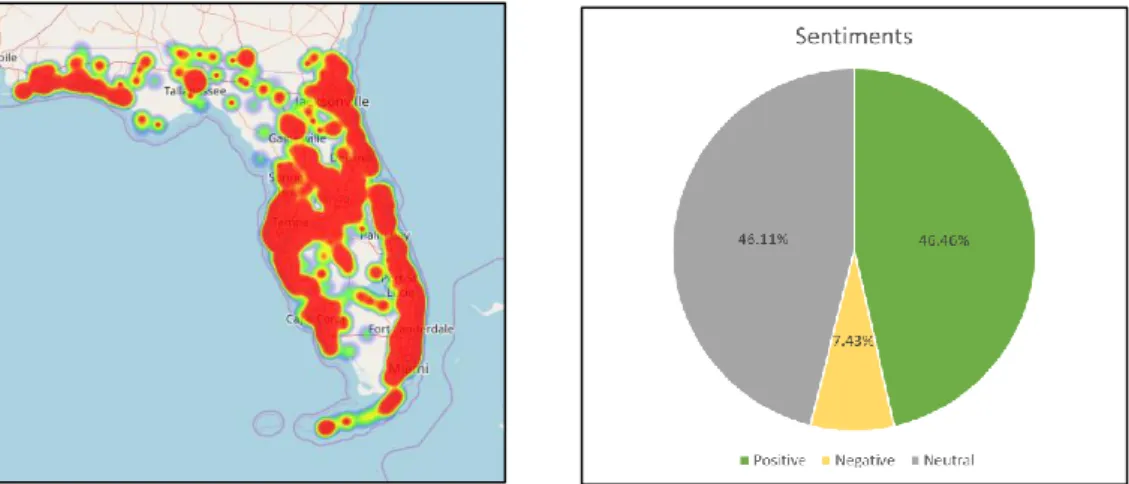
For our next experiment of Florida, a total of 16169 tweets were collected in three days. Likewise for the experiment in Lisbon, here also we didn’t filter the tweets with keywords. The positive class got the highest percentage of tweets with 46.46% while 46.11% tweets were classified as neutral. Only 7.43% of tweets were classified as having negative sentiments.
Figure 15: Heat maps and Pie-chart of sentiments for Florida
The heat map of the sentiments for Florida is shown in Figure 14. It also illustrates that the tweets are well distributed along Florida. Figure 16-18 represents the heat maps for Florida with positive, negative and neutral sentiments respectively. From the figures, we can say that tweets with positive and neutral sentiments dominates the tweets with negative sentiments. In general Twitter users in Florida are more positive or neutral.
32
Figure 16: Heat map of Florida for Positive Sentiment
33
Figure 18: Heat map of Florida for Neutral Sentiments
34
6. CONCLUSIONS
In this thesis, we analyze the sentiments of geotweets and visualize the result in the form of heat maps and clusters in real time. Sentiment analysis has become the most important source in decision-making. Most people depends on it to achieve the efficient product. The tremendous amount of sentiment rich data in microblogging sites makes them an attractive source of data for opinion mining and sentiment analysis. In this work, we performed location based sentiment analysis on tweets from Lisbon and Florida. We collected geotweets using Twitter Streaming API. We filtered the tweets by geographical extent and only considered the tweets which were in English language. We use geocoder from Geopy to geocode tweets without geographic coordinates. Textblob, an open source text processing library written in python was used to calculate polarity of the tweets, which later were classified into positive, negative and neutral sentiments. We visualize the result in the form of heat maps and clusters in leaflet. In both cases, we saw how positive, negative and neutral sentiments differs for different location. Also, we studied how the change of sentiments over a period of week in Lisbon. We collected comparatively lower number of tweets for Lisbon than for Florida and that too within longer time period than the later. The main reason behind this is English not being a local language in Portugal.
Location based sentiment analysis can be applied to control the decision making in any domain. And the visualization helps us to perceive information even more quickly. If a company is targeting a specific geographic location as potential clients or users, then location based sentiment analysis can help them understand the opinions of people of that region towards the company and their products or project.
For the future work, we can improve our approach to work on multi-languages so that language should not be a barrier for the analysis. In this work, we convert the Unicode characters like emoji and smileys into question mark sign “?”, as the non-unicode characters cannot be processed and was throwing errors. We should find a way to consider these emoji and smileys as they can change tone of a statement. Furthermore, our approach fall short to detect irony, humor or any sarcasm. We should pair our approach with human analysts to examine the contextual references. To improve the effectiveness of our sentiment analysis, we should go beyond the polarity
35 of “positive”, “negative”, and “neutral” to classify sentiments. We should use more fine-grained categories like “angry”, “happy”, “frustrated”, “sad”, “neutral”, etc.
36
REFERENCES
Abdulla, N. a, Ahmed, N. a, Shehab, M. a, & Al-ayyoub, M. (2013). Arabic Sentiment Analysis. Jordan Conference on Applied Electrical Engineering and Computing
Technologies (AEECT´13), 6(12), 1–6.
https://doi.org/10.1109/AEECT.2013.6716448
Barbosa, L., & Feng, J. (2010). Robust Sentiment Detection on Twitter from Biased
and Noisy Data. Coling, (August), 36–44.
https://doi.org/10.1016/j.sedgeo.2006.07.004
Berger, A. L., Pietra, S. A. Della, & Pietra, V. J. Della. (1996). A Maximum Entropy Approach to Natural Language Processing. Computational Linguistics, 22, 39– 71. https://doi.org/10.3115/1075812.1075844
Bollen, J., Mao, H., & Zeng, X. (2011). Twitter mood predicts the stock market.
Journal of Computational Science, 2(1), 1–8.
https://doi.org/10.1016/j.jocs.2010.12.007
Brody, S., & Diakopoulos, N. (2011). Cooooooooooooooollllllllllllll !!!!!!!!!!!!!! Using Word Lengthening to Detect Sentiment in Microblogs *** Preprint Version. Computational Linguistics, (2010), 562–570.
Chopra, F. K., & Bhatia, R. (2016). Sentiment Analyzing by Dictionary based Approach, 152(5), 32–34.
Choy, M., Cheong, M. L. F., Laik, M. N., & Shung, K. P. (2011). A sentiment analysis of Singapore Presidential Election 2011 using Twitter data with census correction. Retrieved from http://arxiv.org/abs/1108.5520
Cruz, L., Ochoa, J., Roche, M., & Poncelet, P. (2016). Dictionary-based sentiment analysis applied to specific domain using a web mining approach. CEUR
Workshop Proceedings, 1743(1), 80–88. Retrieved from
https://www.scopus.com/inward/record.uri?eid=2-s2.0-85006153487&partnerID=40&md5=41cabb33e2943f3a8d12e6af0668841d Freund, L., & Cellary, W. (2014). Advances in The Human Side of Service
Engineering. In 5th International Conference on Applied Human Factors and
Ergronomics.
Goyal, A., & Daumé III, H. (2011). Generating Semantic Orientation Lexicon Using Large Data and Thesaurus. Proceedings of the 2nd Workshop on Computational
Approaches to Subjectivity and Sentiment Analysis, 37–43.
Harb, A., Planti, M., Roche, M., & Cedex, N. (2008). Web Opinion Mining : How to extract opinions from blogs ? To cite this version : Web Opinion Mining : How to extract opinions from blogs ? Categories and Subject Descriptors.
Hatzivassiloglou, V., & McKeown, K. R. (1997). Predicting the semantic orientation of adjectives. Proceedings of the 35th Annual Meeting on Association for
Computational Linguistics -, 174–181. https://doi.org/10.3115/976909.979640
37 applications. The Cartographic Journal, 42(1), 3–4. https://doi.org/10.1179/000870405X52702
Kaushik, C., & Mishra, A. (2014). A Scalable, Lexicon Based Technique for Sentiment Analysis. International Journal in Foundations of Computer Science &
Technology, 4(5), 35–56. https://doi.org/10.5121/ijfcst.2014.4504
Lee, H., & Bhd, C. ePulze S. (2011). Chinese Sentiment Analysis Using Maximum Entropy. Sentiment Analysis …, (72), 89–93. Retrieved from http://acl.eldoc.ub.rug.nl/mirror/W/W11/W11-37.pdf#page=105
MacEachren, A. M., & Kraak, M. J. (2011). Exploratory Cartographic Visualisation: Advancing the Agenda. The Map Reader: Theories of Mapping Practice and
Cartographic Representation, 23(4), 83–88.
https://doi.org/10.1002/9780470979587.ch11
Medhat, W., Hassan, A., & Korashy, H. (2014). Sentiment analysis algorithms and applications: A survey. Ain Shams Engineering Journal, 5(4), 1093–1113. https://doi.org/10.1016/j.asej.2014.04.011
Moreno-Ortiz, A., & Fernández-Cruz, J. (2015). Identifying Polarity in Financial Texts for Sentiment Analysis: A Corpus-based Approach. Procedia - Social and
Behavioral Sciences, 198(Cilc), 330–338.
https://doi.org/10.1016/j.sbspro.2015.07.451
Mullen, T., & Collier, N. (2004). Sentiment analysis using support vector machines with diverse information sources. In EMNLP (pp. 412–418). Barcelona, Spain. Neethu, M. S., & Rajasree, R. (2013). Sentiment analysis in twitter using machine
learning techniques. 2013 Fourth International Conference on Computing,
Communications and Networking Technologies (ICCCNT), 1–5.
https://doi.org/10.1109/ICCCNT.2013.6726818
Nigam, K., John, L., & McCallum, A. (1999). Using Maximum Entropy For Text Classification. Journal of Chemical Information and Modeling.
Pak, A., & Paroubek, P. (2010). Twitter as a Corpus for Sentiment Analysis and Opinion Mining. In Proceedings of the Seventh Conference on International
Language Resources and Evaluation, 1320–1326.
https://doi.org/10.1371/journal.pone.0026624
Pang, B., & Lee, L. (2006). Opinion Mining and Sentiment Analysis. Foundations and
Trends® in InformatioPang, B., & Lee, L. (2006). Opinion Mining and Sentiment Analysis. Foundations and Trends® in Information Retrieval, 1(2), 91–231.
doi:10.1561/1500000001n Retrieval, 1(2), 91–231.
https://doi.org/10.1561/1500000001
Pang, B., Lee, L., & Vaithyanathan, S. (2002). Thumbs up?: sentiment classification using machine learning techniques. Proceedings of the Conference on Empirical
Methods in Natural Language Processing, 79–86.
https://doi.org/10.3115/1118693.1118704
38 The Development and Psychometric Properties of LIWC2007. LIWC2007
Manuel, 1–22. https://doi.org/10.1068/d010163
Pultar, E., Raubal, M., Cova, T. J., & Goodchild, M. F. (2009). Dynamic GIS case studies: Wildfire evacuation and volunteered geographic information.
Transactions in GIS, 13(SUPPL. 1), 85–104.
https://doi.org/10.1111/j.1467-9671.2009.01157.x
Rhyne, T. M., MacEachren, A. M., Gahegan, M., Pike, W., Brewer, I., Cai, G., … Hardisty, F. (2004). Geovisualization for Knowledge Construction and Decision Support. IEEE Computer Graphics and Applications, 24(1), 13–17. https://doi.org/10.1109/MCG.2004.1255801
Santos, C. N. Dos, & Gatti, M. (2014). Deep Convolutional Neural Networks for Sentiment Analysis of Short Texts. Coling, (August), 69–78.
Suresh, A., & Bharathi, C. R. (2016). Sentiment Classifi cation using Decision Tree Based Feature Selection Sentiment Classi fi cation using Decision Tree Based Feature Selection. International Journal of Control Theory and Applications,
9(36), 419–425.
Troussas, C., Virvou, M., Espinosa, K. J., Llaguno, K., & Caro, J. (2013). Sentiment analysis of Facebook statuses using Naïve Bayes Classifier for language learning.
4th International Conference on Information, Intelligence, Systems and Applications (IISA), 198–205.
Tsytsarau, M., & Palpanas, T. (2012). Survey on mining subjective data on the web.
Data Mining and Knowledge Discovery, 24(3), 478–514.
https://doi.org/10.1007/s10618-011-0238-6
Tumasjan, A., Sprenger, T., Sandner, P., & Welpe, I. (2010). Predicting elections with Twitter: What 140 characters reveal about political sentiment. Proceedings of the
Fourth International AAAI Conference on Weblogs and Social Media, 178–185.
https://doi.org/10.1074/jbc.M501708200
Turney, P. D. (2002). Thumbs up or thumbs down? Semantic Orientation applied to Unsupervised Classification of Reviews. Proceedings of the 40th Annual Meeting
of the Association for Computational Linguistics (ACL), (July), 417–424.
https://doi.org/10.3115/1073083.1073153
Wang, H., Can, D., Kazemzadeh, A., Bar, F., & Narayanan, S. (2012). A System for Real-time Twitter Sentiment Analysis of 2012 U.S. Presidential Election Cycle.
Proceedings of the 50th Annual Meeting of the Association for Computational Linguistics, (July), 115–120. https://doi.org/10.1145/1935826.1935854
Wang, Y.-Y., & Acero, A. (2007). Maximum Entropy Model Parameterization with TF*IDF Weighted Vector Space Model. IEEE Automatic Speech Recognition and
Understanding Workshop, 213–218. Retrieved from
http://cogsys.imm.dtu.dk/thor/projects/multimedia/textmining/node5.html Wilson, T., Wiebe, J., & Hoffman, P. (2005). Recognizing contextual polarity in
39 Yu, L. C., Wu, J. L., Chang, P. C., & Chu, H. S. (2013). Using a contextual entropy model to expand emotion words and their intensity for the sentiment classification of stock market news. Knowledge-Based Systems, 41, 89–97. https://doi.org/10.1016/j.knosys.2013.01.001
Zeitzoff, T. (2011). Using Social Media to Measure Conflict Dynamics. Journal of
40
ANNEX
A. Python script for connecting with Twitter API and sentiment analysis
from __future__ import absolute_import, print_function import tweepy
import dataset
from textblob import TextBlob from tweepy import OAuthHandler from tweepy import Stream
from tweepy.streaming import StreamListener import json
import re import sys
from sqlalchemy.exc import ProgrammingError from geopy.geocoders import Nominatim from geopy.exc import GeocoderTimedOut
#Twitter OAuth key
consumer_key ="4pWHutE2ZjsxKzQ3mkBNLV4xY" consumer_secret =
"1iqXjJOR9hzmP0ppPcdUC10ygNtRFFdIYq8d3CY6mSsQMnbDbw"
access_token ="262541721-pnsraIrVxNi4LXqysD9UDBEy6cjTE1UjXwcwTZCQ" access_secret ="GGKsYkYiRu06UHSxP3VCHJgHJJ2GVOFVYo2BwGh5hKv7P" #Convert emoji and smiley (non unicode character) into "?". Otherwise non unicode character cannot be processed.
non_bmp_map = dict.fromkeys(range(0x10000, sys.maxunicode + 1), 0xfffd)
Location_Filter = True # If true boundary extent filter is considered. If false all tweets from around the world is considered.
41 #keyword = ["england", "castellon", "Nokia", "London", "Nepal", "happy", "sad", "good", "bad"]
keyword = [""]
geolocator = Nominatim() #OSM geocoding service handler. To use other services consult geopy.geocoders
extent = [-87.63, 24.52, -79.72, 31.00]
location = None #Initialize global variable location as none. If not initialized, gives error.
class MyListener(StreamListener): def on_status(self, status): #print (status)
if status.retweeted: #Ignores retweets return
#Checks for keywords in tweets for word in keyword:
if word in status.text.lower(): #print(status.text.translate(non_bmp_map)) id_str = status.id_str description = status.user.description loc = status.user.location text = status.text.translate(non_bmp_map) #print ("No Error in Text")
clean_text = ' '.join(re.sub("(@[A-Za-z0-9]+)|([^0-9A-Za-z \t])|(\w+:\/\/\S+)"," ",text).split()) #Remove urls, mentions, etc. coords = status.coordinates
geo = status.geo
name = status.user.screen_name user_created = status.user.created_at followers = status.user.followers_count
