SODIUM AND POTASSIUM CONTENT IN SPORTS
SUPPLEMENTS BASED ON WHEY PROTEIN
Conteúdo de sódio e potássio em suplementos esportivos a base de
proteínas do soro de leite
Thalles Pedrosa Lisboa1*, Rafael Arromba de Sousa1
ABSTRACT
Different brands of three sports supplement types containing whey protein were evaluated: 15 whey protein supplements, 4 hypercaloric supplements and 7 protein bars. A sample preparation procedure was studied employing microwave-assisted wet digestion in order to determine the sodium and potassium contents using Flame Atomic Emission Spectrometry (Flame Photometry). The sodium concentrations obtained were in the ranges of 0.30 to 5.9 mg/g, 0.52 to 2.8 mg/g and 2.3 to 5.0 mg/g for whey protein supplements, hypercaloric supplements and protein bars respectively. The potassium concentrations varied from 1.3 to 13 mg/g, 0.47 to 5.4 mg/g and 1.7 to 12 mg/g for the same samples, respectively. The ratio between sodium and potassium levels, a parameter associated with incident hypertension, was calculated, showing that for some samples the values exceeded the World Health Organization recommendation. The developed method has presented high analytical frequency, with good accuracy and precision, making it suitable for application in quality control routines.
Keywords: minerals, micronutrients, hypercaloric supplements, protein bar
supplements, flame photometry.
RESUMO
Diferentes marcas de três tipos de suplementos esportivos à base de proteína de soro de leite foram avaliadas: 15 do tipo à base de proteína de soro de leite, 4
1 Universidade Federal de Juiz de Fora, Instituto de Ciências Exatas, Departamento de Química, Rua José Lourenço Kelmer, s/n, São Pedro, 36036-900, Juiz de Fora, MG, Brasil. E-mail: thallespl_jf@ hotmail.com.
* Autor para correspondência Recebido / Received: 21/08/2019 Aprovado / Approved: 11/02/2020
“hipercalóricos” e 7 barras de proteína. Um procedimento de preparo de amostras foi estudado empregando digestão ácida assistida por micro-ondas para determinar os teores de sódio e potássio usando Espectrometria de Emissão Atômica com Chama (Fotometria de Chama). As concentrações de sódio obtidas variaram na faixa de: 0,30 a 5,9 mg/g, de 0,52 a 2,8 mg/g e de 2,3 a 5,0 mg/g para suplementos a base de proteínas do soro de leite, suplementos hipercalóricos e suplementos em barra de proteína, respectivamente. Enquanto as concentrações de potássio, variaram de: 1,3 a 13 mg/g, de 0,47 a 5,4 mg/g e de 1,7 a 12 mg/g para as mesmas amostras, respectivamente. A razão entre os níveis de sódio e potássio, um parâmetro associado à hipertensão incidente, foi calculada e mostrou que, para algumas amostras, os valores excederam a recomendação da Organização Mundial de Saúde. O método desenvolvido apresentou alta frequência analítica, com boa exatidão e precisão sendo adequado para aplicação em rotinas de controle de qualidade.
Palavras-chave: minerais, micronutrientes, suplementos hipercalóricos,
suplementos proteicos em barra, fotometria de chama.
INTRODUCTION
In recent years, a significant increase in the consumption of dietary supplements has been observed (BRIZIO et al., 2013; MARRERO et al., 2013). This is a worldwide trend associated with stereotyped patterns of perfect bodies, and affects all age groups, independent of gender or social class (CASTRO et al., 2016). Different supplements are usually used by athletes with the aim of improving sports performance, including those with an ergogenic effect (GOMES et al., 2005; GOSTON; CORREIA, 2010; MAIA et al., 2019). Among the most used are those that are formulated based on macro and micronutrients in different proportions, making them suitable for different purposes (NABUCO et al., 2016). In particular, whey protein supplements have a high content of essential branched-chain amino acids, high calcium content, and bioactive peptides (HARAGUCHI et al., 2006; GALATI et al., 2017; TAVANO et al., 2017).
In Brazil, the National Sanitary Surveillance Agency (ANVISA) regulates food supplements through several normative resolutions, among them those for supplements indicated for athletes (BRASIL, 2010;
BRASIL, 2018). Many of these supplements are sold in a wide variety of brands and prices, and some are marketed illegally (ANVISA, 2012). The presence of low-quality products in the market, as reported by the National Institute of Metrology, Quality and Technology (INMETRO, 2014), and the excessive consumption without adequate professional accompaniment (NEVES et al., 2017), may pose risks to the health of consumers (MAXIMIANO; SANTOS, 2017; SCHULER; ROCHA, 2018).
Nowadays, arterial hypertension is a public health problem and is considered to be the main preventable risk factor for the development of stroke and myocardial infarction (ZHANG et al., 2013; XI et al., 2015). In order to prevent arterial hypertension (BRASIL, 2014; DU et al., 2014), the World Health Organization (WHO) suggests consumption of less than 2 g of sodium (Na) per day, corresponding to approximately 5 g of sodium chloride (NaCl). Together with the suggestion of reduced Na intake, the WHO also suggests a minimum daily intake of 3.51 g of potassium (K), which has been recognized as a protective factor for hypertension because it induces the loss of body water and sodium (WHO, 2013; DU et al., 2014).
On the other hand, the ratio between sodium and potassium concentrations has a stronger association with incident hypertension than the Na or K intake alone. For high Na/K ratios, the risk of hypertension is higher than in smaller ratios (DU et al., 2014), and according to the WHO, this ratio in healthy diets should remain less than or equal to 1, which is also consistent with other international recommendations such as the Dietary Guidelines of Americans (ZHANG et al., 2013). Therefore, it is of great importance to determine mineral levels of the sodium and potassium macronutrients in this type of product.
In this context, the present study aimed to evaluate the concentrations of sodium and potassium and the concentration ratio of these minerals in samples of food supplements based on whey proteins. As an analytical technique, it was chosen the Flame Atomic Emission Spectrometry (Flame Photometry), a technique widely used for the determination of sodium and potassium in similar samples (PERRONE et al., 2014), while for the sample preparation it was used microwave-assisted wet digestion. The proposed method is simple, robust, and presents potential for use in routine analyses.
MATERIALS AND METHODS Instruments, materials, and reagents
All measurements were performed with a Flame Atomic Emission Spectrometer (F AES), also known as a Flame Photometer (Digimed, model DM-61), containing absorption filters for reading of sodium at the wavelength of 590 nm and reading of potassium at 766 nm. The measurements were performed simultaneously with resolution of 0.1 mg/L, response time of 8 seconds, and aspiration velocity of (5.8 ± 0.1) mL/ min. Microwave-assisted wet digestion was carried out with a Berghof SpeedWave 4 microwave oven equipped with 12
high-pressure vials (DAP-30) of Teflon-PTFE (polytetrafluoroethylene). All the reagents used were of analytical grade. The solutions were prepared using deionized water obtained with an Elga Purelab Option-Q system (model LA611, UK). Nitric acid (Sciavicco Comércio e Indústria Ltda., 65% v/v) was also used for the preparation of samples and solutions. The analytical curve was prepared from Na and K 100 mg/L stock solution (Digimed). All the glassware was cleaned in a 10 % (v/v) nitric acid bath for 24 h, then rinsed with deionized water at least three times and dried at room temperature.
Samples
A total of 26 samples of sports supplements were obtained from local markets of Juiz de Fora, Brazil. Samples were of the following types: 15 samples of whey protein supplements (named W-01 to W-15); 4 samples of supplements based on proteins and carbohydrates, marketed as hypercaloric (named H-01 to H-04); and 7 samples of protein bars (named P-01 to P-07). All samples were packed in previously appropriate cleaned vials. The protein bar samples were crushed and placed in an oven (Odontobras EL 1.3, Brazil) at 60 °C for 48 h. The samples were then pulverized with the aid of an agate mortar and pestle and stored in previously cleaned flasks.
Microwave-assisted wet digestion
For the determination of metals in sports supplements, the procedure used for the digestion of the samples was adapted from the literature (SORIANO et al., 2007; MORET et al., 2011; MARRERO et al., 2013). The procedure consisted of weighing 250 mg of the dried samples directly in the PTFE flasks in which 6.0 mL of concentrated nitric acid was added. This mixture was placed in the microwave oven where the heating program
described in Table 1 was applied. After this, the digested products obtained were diluted to 25.0 mL in volumetric flasks with deionized water.
Performance parameters
The limits of detection (LOD) and quantification (LOQ) of the method were calculated by multiplying the value of the standard deviation (10 measures of signal absorbance of the microwave blank digestions) by 3.3 and 10 (LOD and LOQ, respectively). Then, the result was divided by the slope of the calibration curve. A correction factor was used considering the sample mass used and the final volume of the digested samples (MIMURA et al., 2016). The precision of the method was verified using the relative standard deviation (RSD), while the accuracy was also evaluated through analysis of a sample of standard reference material of non-fat powdered milk (NIST SRM 1549), containing sodium concentration of 1.69 ± 0.03 g/100 g and potassium concentration of 0.497 ± 0.010 g/100 g (NIST, 2012). To evaluate the existence of any significant matrix effect, that is, selectivity, two quantification methods were compared: standard addition and external calibration. These methods were compared by evaluating the angular coefficients of the corresponding analytical curves.
The samples were further evaluated using Inductively Coupled Plasma Mass Spectrometry (Agilent 7900 ICP-MS, Agilent Technologies) in order to check the method’s accuracy using a calibration curve in the range
of 0.5 to 1000 µg/L. The analysis conditions were based on the application note of Agilent Technologies for the routine determination of trace metallic components in food CRMs (SAKAI et al., 2014).
RESULTS AND DISCUSSION
Analytical optimization and performance parameters
The multi-element analytical curves with analyte concentrations varying in the range of 1.0 to 15.0 mg/L were prepared in 2% v/v nitric acid, shown in Figure 1, and used to calculate the LOD and LOQ values of the sports supplements samples. The LOD and LOQ were 0.03 and 0.10 mg/g for sodium, and 0.05 and 0.16 mg/g for potassium, respectively.
Figure 1 – External calibration curves in 2%
v/v nitric acid for the determination of Na and K in samples of sports supplements
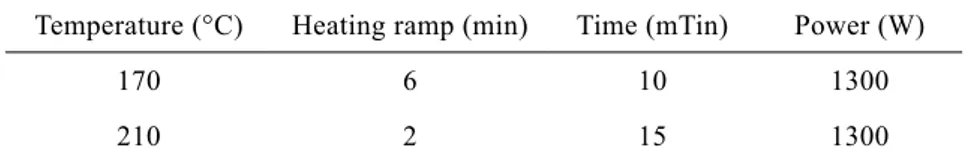
Table 1 – Microwave oven heating program used for the acid digestion of sports supplements
Temperature (°C) Heating ramp (min) Time (mTin) Power (W)
170 6 10 1300
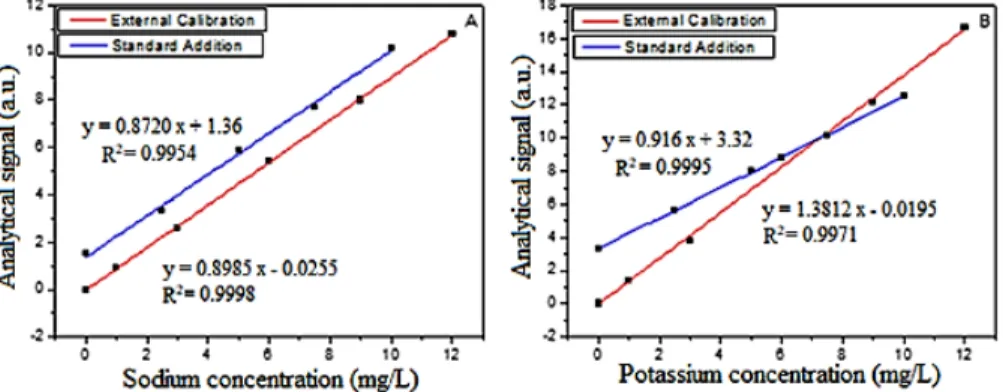
According to the data shown in Figure 2, there were no significant matrix effects for sodium determination, since a correlation of 97% between the angular coefficients was observed. For the potassium measurements, the difference between the angular coefficients indicated the presence of a matrix effect, so that the measurements were performed through the standard addition method, which is a contour alternative to the observed interference.
Although alkali metals are easily atomized in flames, it is normal to observe matrix effects when using flame photometry. Since the gas mixture used by the flame photometer, air-butane, reaches maximum temperatures between 1700 to 1900 °C, it does not present enough energy to atomize any sample. Thus, some divergences could be expected between the properties of complex matrices and those of the standard solutions. Chemical interferences or physical effects (arising from differences in viscosity, surface tension, and vapor pressure), have a significant and direct influence on the measurement of the analytical signal (OKUMURA et al., 2004).
Measurement precision was also evaluated through repeatability assays. The
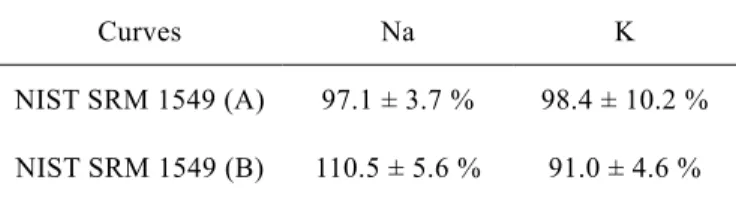
relative standard deviation remained below 5% for the sodium and potassium analysis. This way, considering both analytes’ concentration levels and the samples’ complexity, it can be inferred there was high precision of the measurements. The method’s accuracy was confirmed by the determination of the analytes in a standard reference material of non-fat powdered milk (NIST SRM 1549). The reference material was prepared according to the procedure used for the sports supplement samples. The results obtained are shown in Table 2.
According to the Commission Decision of 12 August 2002 of the Commission of the European Communities, the acceptable recovery limits according to the analyte concentration range can vary from 80 to 110% (COMMISSION OF THE EUROPEAN COMMUNITIES, 2002). Thus, the results indicate that the method has good accuracy and may be used for quantification analysis.
A p p l i c a t i o n o f m e t h o d s f o r t h e determination of Na and K in 26 food supplement samples
For sodium analysis, external calibration was used, while for potassium calibration the standard addition method was employed.
Figure 2 – External calibration and standard addition curves for: (A) sodium and (B) potassium
However, independent of the quantification method, since flame photometry presents high analytical frequency, it was possible to analyze an average of up to 60 replicates per hour.
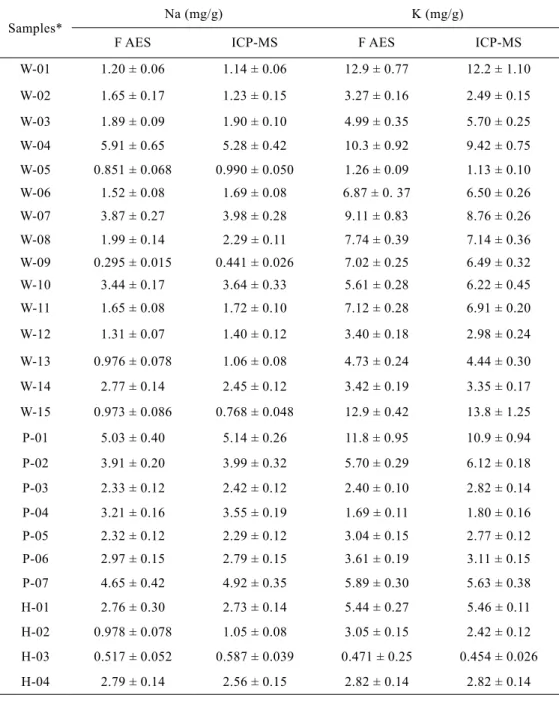
The samples were also evaluated using ICP-MS in order to check the method’s accuracy based on a statistical comparison among the obtained concentrations (Flame Photometry x ICP-MS). The results are presented in Table 3.
The data in Table 3 showed it was possible to quantify both analytes in all the investigated samples with acceptable accuracy. Statistical comparison was performed by the F test between the variances of sodium and potassium concentrations obtained by Flame Photometry and ICP-MS. The calculated F-values obtained were 1.034 for the sodium variance and 1.030 for potassium, while the critical F-value is 1.955. Thus, it can be stated that at 95% confidence level the variances of the results obtained by the different techniques are statistically comparable. Regarding the analytes’ concentrations, they were compared using Student’s t-test with grouped variance. The calculated t-values were 0.207 and 1.911 for sodium and potassium, respectively, while the critical t-value is 2.060. Thus, it can be stated with 95% confidence level that the mean concentrations are statistically comparable.
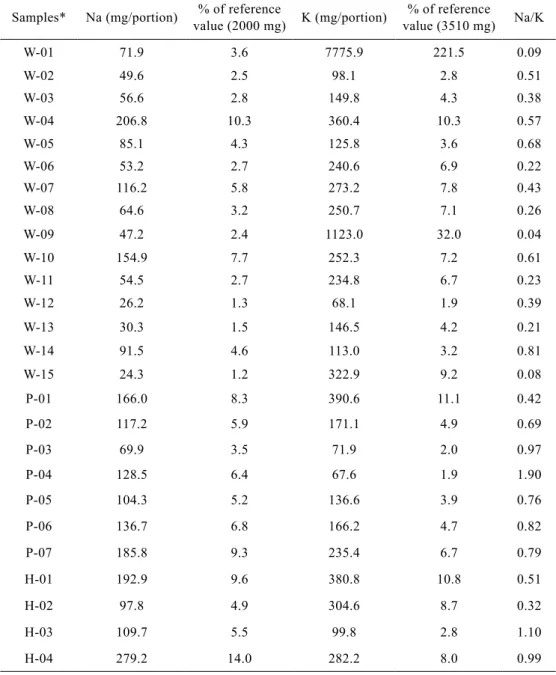
In relation to the results of the sodium and potassium concentrations obtained with the method, the ratio between the
micronutrients for the samples studied was calculated. The calculated ratios, shown in Table 4, took into consideration the portions indicated for consumption on the labels of the supplements. For whey protein supplements, the indicated portions ranged from 20 to 100 g, while the hypercaloric supplements ranged from 70 to 212 g and, protein bar supplements ranged from 30 to 46 g per portion.
In general, the sodium concentrations (values per portion, according to each brand) were high compared to the indications of the WHO for daily consumption (maximums of 2000 and 3510 mg for sodium and potassium, respectively)(WHO, 2013), since it is still to be considered that sodium and potassium are micronutrients common in the daily diet. On the other hand, evaluating the results based on the concentration ratios showed that for the whey protein supplements, the values did not exceed the limit considered adequate. For the hypercaloric supplements and protein bars, the values found were close and even higher than the target, which indicates the need for greater care with the consumption of these products.
For protein bar samples, the ratio of sodium and potassium concentrations ranged from 0.42 to 1.90, and two samples (P-03 and P-04) presented disturbing values. Regarding the hypercaloric supplement samples, half of them presented worrying values (H-03 and H-04). The whey protein samples can be considered adequate in relation to the
Table 2 – Recovery values of the standard reference material of non-fat powdered milk (NIST
SRM 1549) for: (A) external calibration curve; (B) standard addition curve (n = 3)
Curves Na K
NIST SRM 1549 (A) 97.1 ± 3.7 % 98.4 ± 10.2 % NIST SRM 1549 (B) 110.5 ± 5.6 % 91.0 ± 4.6 %
Table 3 – Results for sodium and potassium determination by Flame Photometry and ICP-MS
in different samples of sports supplements
Samples* Na (mg/g) K (mg/g)
F AES ICP-MS F AES ICP-MS
W-01 1.20 ± 0.06 1.14 ± 0.06 12.9 ± 0.77 12.2 ± 1.10 W-02 1.65 ± 0.17 1.23 ± 0.15 3.27 ± 0.16 2.49 ± 0.15 W-03 1.89 ± 0.09 1.90 ± 0.10 4.99 ± 0.35 5.70 ± 0.25 W-04 5.91 ± 0.65 5.28 ± 0.42 10.3 ± 0.92 9.42 ± 0.75 W-05 0.851 ± 0.068 0.990 ± 0.050 1.26 ± 0.09 1.13 ± 0.10 W-06 1.52 ± 0.08 1.69 ± 0.08 6.87 ± 0. 37 6.50 ± 0.26 W-07 3.87 ± 0.27 3.98 ± 0.28 9.11 ± 0.83 8.76 ± 0.26 W-08 1.99 ± 0.14 2.29 ± 0.11 7.74 ± 0.39 7.14 ± 0.36 W-09 0.295 ± 0.015 0.441 ± 0.026 7.02 ± 0.25 6.49 ± 0.32 W-10 3.44 ± 0.17 3.64 ± 0.33 5.61 ± 0.28 6.22 ± 0.45 W-11 1.65 ± 0.08 1.72 ± 0.10 7.12 ± 0.28 6.91 ± 0.20 W-12 1.31 ± 0.07 1.40 ± 0.12 3.40 ± 0.18 2.98 ± 0.24 W-13 0.976 ± 0.078 1.06 ± 0.08 4.73 ± 0.24 4.44 ± 0.30 W-14 2.77 ± 0.14 2.45 ± 0.12 3.42 ± 0.19 3.35 ± 0.17 W-15 0.973 ± 0.086 0.768 ± 0.048 12.9 ± 0.42 13.8 ± 1.25 P-01 5.03 ± 0.40 5.14 ± 0.26 11.8 ± 0.95 10.9 ± 0.94 P-02 3.91 ± 0.20 3.99 ± 0.32 5.70 ± 0.29 6.12 ± 0.18 P-03 2.33 ± 0.12 2.42 ± 0.12 2.40 ± 0.10 2.82 ± 0.14 P-04 3.21 ± 0.16 3.55 ± 0.19 1.69 ± 0.11 1.80 ± 0.16 P-05 2.32 ± 0.12 2.29 ± 0.12 3.04 ± 0.15 2.77 ± 0.12 P-06 2.97 ± 0.15 2.79 ± 0.15 3.61 ± 0.19 3.11 ± 0.15 P-07 4.65 ± 0.42 4.92 ± 0.35 5.89 ± 0.30 5.63 ± 0.38 H-01 2.76 ± 0.30 2.73 ± 0.14 5.44 ± 0.27 5.46 ± 0.11 H-02 0.978 ± 0.078 1.05 ± 0.08 3.05 ± 0.15 2.42 ± 0.12 H-03 0.517 ± 0.052 0.587 ± 0.039 0.471 ± 0.25 0.454 ± 0.026 H-04 2.79 ± 0.14 2.56 ± 0.15 2.82 ± 0.14 2.82 ± 0.14
Table 4 – Concentration of sodium and potassium in relation to the manufacturers’ recommended
portions, percentage of reference value, and the ratio between the micronutrient concentrations
Samples* Na (mg/portion) value (2000 mg) K (mg/portion)% of reference value (3510 mg)% of reference Na/K
W-01 71.9 3.6 7775.9 221.5 0.09 W-02 49.6 2.5 98.1 2.8 0.51 W-03 56.6 2.8 149.8 4.3 0.38 W-04 206.8 10.3 360.4 10.3 0.57 W-05 85.1 4.3 125.8 3.6 0.68 W-06 53.2 2.7 240.6 6.9 0.22 W-07 116.2 5.8 273.2 7.8 0.43 W-08 64.6 3.2 250.7 7.1 0.26 W-09 47.2 2.4 1123.0 32.0 0.04 W-10 154.9 7.7 252.3 7.2 0.61 W-11 54.5 2.7 234.8 6.7 0.23 W-12 26.2 1.3 68.1 1.9 0.39 W-13 30.3 1.5 146.5 4.2 0.21 W-14 91.5 4.6 113.0 3.2 0.81 W-15 24.3 1.2 322.9 9.2 0.08 P-01 166.0 8.3 390.6 11.1 0.42 P-02 117.2 5.9 171.1 4.9 0.69 P-03 69.9 3.5 71.9 2.0 0.97 P-04 128.5 6.4 67.6 1.9 1.90 P-05 104.3 5.2 136.6 3.9 0.76 P-06 136.7 6.8 166.2 4.7 0.82 P-07 185.8 9.3 235.4 6.7 0.79 H-01 192.9 9.6 380.8 10.8 0.51 H-02 97.8 4.9 304.6 8.7 0.32 H-03 109.7 5.5 99.8 2.8 1.10 H-04 279.2 14.0 282.2 8.0 0.99
concentration ratio of sodium and potassium.
CONCLUSIONS
Considering the current Brazilian regulations, which require a declaration of sodium content in food products, the results obtained employing acid digestion and Flame Photometry (a relatively simple and cost-effective technique) showed that the method is adequate for the analysis of whey protein-based dietary supplements. Compared to other instrumental techniques, such as those based on plasma, photometry offers advantages (low instrumental and operational cost) for the determination of minerals such as Na and K in samples of supplements. The method was suitable for routine analyses with high analytical frequency.
Regarding the studied samples, the sodium levels found may be considered high for some samples, since such micronutrient is present in most of the foods in our diet. Thus, the monitoring analysis of dietary supplements is relevant and necessary.
ACKNOWLEDGMENTS
This work was financially supported by Coordenação de Aperfeiçoamento de Pessoal de Nível Superior (CAPES), Fundação de Amparo à Pesquisa do Estado de Minas Gerais (FAPEMIG, CEX-APQ-02056-14), and Conselho Nacional de Desenvolvimento Científico e Tecnológico (CNPq). The authors also thank Dr. Fábio Ferreira da Silva and Agilent Technologies for their assistance with the ICP-MS analysis.
REFERENCES
ANVISA. Agência Nacional de Vigilância Sanitária. Anvisa alerta para risco de
consumo de suplemento alimentar.
Portal ANVISA. 2012. Disponível em: http://portal.anvisa.gov.br/noticias/-/
asset_publisher/FXrpx9qY7FbU/content/ anvisa-alerta-para-risco-de-consumo-de-suplemento-alimentar/219201/pop_ up?inheritRedirect=false
BRASIL. Ministério da Saúde. Agência Nacional de Vigilância Sanitária. Instrução Normativa IN nº 28, de 26 de julho de 2018. Estabelece as listas de constituintes, de limites de uso, de alegações e de rotulagem complementar dos suplementos alimentares.
Diário Oficial da União: seção 1, Brasília,
DF, n. 144, p. 141, 27 jul. 2018.
BRASIL. Ministério da Saúde. Agência Nacional de Vigilância Sanitária. Resolução RDC nº 18, de 27 de abril de 2010. Aprova o Regulamento Técnico sobre Alimentos para Atletas. Diário Oficial da União: seção 1, Brasília, DF, n. 79, p. 211, 28 abr. 2010. BRASIL. Ministério da Saúde. Secretaria de Atenção à Saúde. Guia Alimentar para
a População Brasileira. 2. ed., 1. reimpr.
Brasília: Ministério da Saúde, 2014.
BRIZIO, P. et al. Heavy metals occurrence in Italian food supplements. E3S Web
Conference, v. 1, n. 15006, 2013.
DOI: 10.1051/e3sconf/20130115006. CASTRO, J. B. P. D. et al. Food, body and subjectivities in Physical Education and Nutrition: Rancidity of adiposity and the rise of muscles. Demetra: Food, Nutrition &
Health, v. 11, n. 3, p. 803-824, 2016. DOI:
10.12957/demetra.2016.21995.
DU, S. et al. Understanding the patterns and trends of sodium intake, potassium intake, and sodium to potassium ratio and their effect on hypertension in China. The
American Journal of Clinical Nutrition,
v. 99, n. 2, p. 334-343, 2014. DOI: 10.3945/ ajcn.113.059121.
COMMISSION OF THE EUROPEAN COMMUNITIES. 2002/657/EC: Commission Decision of 12 August 2002 implementing Council Directive 96/23/EC concerning the performance of analytical methods and the interpretation of results. Official Journal of
the European Communities, 2002.
GALATI, P. C. et al. Caracterização do consumo de suplementos nutricionais e de macronutrientes em praticantes de atividade física em academias de Ribeirão Preto – SP.
Revista Brasileira de Nutrição Esportiva,
v. 11, n. 62, p. 10, 2017.
GOMES, M. R. et al. Considerações sobre cromo, insulina e exercício físico. Revista
Brasileira de Medicina do Esporte, v. 11,
p. 262-266, 2005.
GOSTON, J. L.; CORREIA, M. I. T. D. Intake of nutritional supplements among people exercising in gyms and influencing factors.
Nutrition, v. 26, n. 6, p. 604-611, 2010.
DOI: 10.1016/j.nut.2009.06.021.
HARAGUCHI, F. K. et al. Proteínas do soro do leite: Composição, propriedades nutricionais, aplicações no esporte e benefícios para a saúde humana. Revista de Nutrição, v. 19, p. 479-488, 2006.
INMETRO. Instituto Nacional de Metrologia, Qualidade e Tecnologia. Programa de
Análise de Produtos: Relatório final sobre
a análise de suplementos proteicos para atletas – Whey Protein. Rio de Janeiro: INMETRO, 2014. Disponível em: http:// www.inmetro.gov.br/consumidor/produtos/ Relatorio_Whey_Final.pdf
MAIA, A. C. F. et al. Insatisfação com a imagem corporal e fatores associados em clientes de uma loja de suplementos
alimentares. Revista Brasileira de Nutrição
Esportiva, v. 13, n. 79, p. 397-405, 2019.
MARRERO, J. et al. Inductively coupled plasma optical emission spectrometric determination of fifteen elements in dietary supplements: Are the concentrations declared in the labels accurate? Microchemical
J o u r n a l , v. 1 0 8 , p . 8 1 - 8 6 , 2 0 1 3
DOI: 10.1016/j.microc.2012.12.013.
MAXIMIANO, C. M. B. F.; SANTOS, L. C. Consumo de suplementos por praticantes de atividade física em academias de ginástica da cidade de Sete Lagoas – MG. Revista
Brasileira de Nutrição Esportiva, v. 11,
n. 61, p. 93-101, 2017.
MIMURA, A. M. S. et al. Optimization of ultrasound-assisted extraction of Cr, Cu, Zn, Cd, and Pb from sediment, followed by FAAS and GFAAS analysis. Journal of AOAC
International, v. 99, n. 1, p. 252-259, 2016.
DOI: 10.5740/jaoacint.15-0090.
MORET, S. et al. Levels of creatine, organic contaminants and heavy metals in creatine dietary supplements. Food
Chemistry, v. 126, n. 3, p. 1232-1238, 2011.
DOI: 10.1016/j.foodchem.2010.12.028. NABUCO, H. C. G.; RODRIGUES, V. B.; RAVAGNANI, C. F. C. Fatores associados ao uso de suplementos alimentares entre atletas: Revisão sistemática. Revista
Brasileira de Medicina do Esporte, v. 22,
n. 5, p. 412-419, 2016. DOI: 10.1590/1517-869220162205154808.
NEVES, D. C. G. D. et al. Consumo de suplementos alimentares: Alerta à saúde pública. Oikos: Revista Brasileira de
Economia Doméstica, v. 28, n. 1, p. 224-238,
NIST. National Institute of Standards & Technology. Certitificate of Analysis. Standard Reference Material 1549. Gaithersburg: NIST, 2012. 4 p.
OKUMURA, F. et al. Experimentos simples usando fotometria de chama para ensino de princípios de espectrometria atômica em cursos de química analítica. Química Nova, v. 27, n. 5, p. 832-836, 2004. DOI: 10.1590/ S0100-40422004000500026.
PERRONE, Í. T. et al. Processing and physico-chemical characterization of whole whey powder. Revista do Instituto de Laticínios
Cândido Tostes, v. 69, n. 5, p. 323-333, 2014.
DOI: 10.14295/2238-6416.v69i5.299. SAKAI, K.; TAKAHASHI, J.; McCURDY, E. Application of the Agilent 7900 ICP-MS
with Method Automation function for the routine determination of trace metallic components in food CRMs – Application note. [s. l.]: Agilent Technologies, 2014.
Disponível em: https://www.agilent.com/ cs/library/applications/5991-4556EN_ AppNote7900_ICP-MS_food_CRMs.pdf SCHULER, A. C.; ROCHA, R. E. R. Fatores associados à utilização de suplementos alimentares por universitários. Revista
Brasileira de Nutrição Esportiva, v. 12,
n. 73, p. 590-597, 2018.
SORIANO, S.; PEREIRA NETO, A. D.;
CASSELLA, R. J. Determination of Cu, Fe, Mn and Zn by flame atomic absorption spectrometry in multivitamin/multimineral dosage forms or tablets after an acidic extraction. Journal of Pharmaceutical and
Biomedical Analysis, v. 43, n. 1, p. 304-310,
2007. DOI: 10.1016/j.jpba.2006.06.009. TAVANO, O. L. et al. Composição e digestibilidade proteica de suplementos alimentícios contendo proteína de soro de leite (whey protein). Revista do Instituto
de Laticínios Cândido Tostes, v. 72, n. 3,
p. 131-138, 2017. DOI: 10.14295/2238-6416. v72i3.591.
WHO. World Health Organization. WHO
issues new guidance on dietary salt and potassium. 2013. Disponível em: https://
www.who.int/mediacentre/news/notes/2013/ salt_potassium_20130131/en/
XI, L. et al. Associations between serum potassium and sodium levels and risk of hypertension: a community-based cohort study. Journal of Geriatric Cardiology:
JGC, v. 12, n. 2, p. 119-126, 2015. DOI:
10.11909/j.issn.1671-5411.2015.02.009. ZHANG, Z. et al. Association between usual sodium and potassium intake and blood pressure and hypertension among U.S. adults: NHANES 2005-2010. PLoS ONE, v. 8, n. 10, p. e75289, 2013. DOI: 10.1371/ journal.pone.0075289.