SOFTWARE
LA‑iMageS: a software for elemental
distribution bioimaging using LA–ICP–MS data
Hugo López‑Fernández
1*, Gustavo de S. Pessôa
2,3, Marco A. Z. Arruda
2,3, José L. Capelo‑Martínez
4,5,
Florentino Fdez‑Riverola
1, Daniel Glez‑Peña
1and Miguel Reboiro‑Jato
1Abstract
The spatial distribution of chemical elements in different types of samples is an important field in several research areas such as biology, paleontology or biomedicine, among others. Elemental distribution imaging by laser ablation inductively coupled plasma mass spectrometry (LA–ICP–MS) is an effective technique for qualitative and quantitative imaging due to its high spatial resolution and sensitivity. By applying this technique, vast amounts of raw data are generated to obtain high‑quality images, essentially making the use of specific LA–ICP–MS imaging software that can process such data absolutely mandatory. Since existing solutions are usually commercial or hard‑to‑use for average users, this work introduces LA‑iMageS, an open‑source, free‑to‑use multiplatform application for fast and automatic generation of high‑quality elemental distribution bioimages from LA–ICP–MS data in the PerkinElmer Elan XL format, whose results can be directly exported to external applications for further analysis. A key strength of LA‑iMageS is its substantial added value for users, with particular regard to the customization of the elemental distribution bioimages, which allows, among other features, the ability to change color maps, increase image resolution or toggle between 2D and 3D visualizations.
Keywords: Elemental distribution, Laser ablation, LA–ICP–MS imaging, Software
© The Author(s) 2016. This article is distributed under the terms of the Creative Commons Attribution 4.0 International License (http://creativecommons.org/licenses/by/4.0/), which permits unrestricted use, distribution, and reproduction in any medium, provided you give appropriate credit to the original author(s) and the source, provide a link to the Creative Commons license, and indicate if changes were made. The Creative Commons Public Domain Dedication waiver (http://creativecommons.org/ publicdomain/zero/1.0/) applies to the data made available in this article, unless otherwise stated.
Background
Advances in technology, including software, new genera-tions of instruments, and the fastest electronic devices, allow the application of image-forming techniques that capture the complexity of a sample in a single image by considering a dynamic or static system. Such techniques include electron/ion microscopy, satellite imaging, tomography, NMR and, more recently, mass spectrom-etry based on molecular or elemental-based techniques [1–4]. Also, mass spectrometry imaging (MSI) increased its application in several science areas, since improve-ments in instrumentation, sample preparation and image software has been carried out [5]. In studies of biological systems, different classes of biomolecules were assessed with spatial resolution at the microscale. The main strat-egies of MSI involve matrix-assisted laser desorption/
ionization mass spectrometry (MALDI–MS) as well as secondary ion mass spectrometry (SIMS).
In this context, laser ablation inductively coupled plasma mass spectrometry (LA–ICP–MS) has been widely used to qualitative or quantitative imaging [6–10]. In brief, LA–ICP–MS consists of a hyphenated technique where a laser unit is coupled to ICP–MS equipment. The laser unit is composed of an active medium (the most popular are Nd:YAlG lasers operated at 266 or 213 nm, or the ArF laser at 193 nm) which will produce a pulse with enough energy to ablate the sample, as well as other components, such as a resonator cavity and optical cam-era, among others [11, 12]. The ablated material is then transported to the ICP–MS through a gas (currently Ar, in addition to others), allowing an analysis of the sam-ple. The source of ICP–MS produces ions, which are separated by their mass-to-charge ratio in the mass spec-trometer. Ion intensities of each element are recorded against time during the laser scanning. These data are subsequently converted to pixels and an image is then
Open Access
*Correspondence: [email protected]
1 ESEI: Escuela Superior de Ingeniería Informática, University of Vigo, Edificio Politécnico, Campus Universitario As Lagoas s/n, 32004 Ourense, Spain
Coupling a laser unit with ICP equipment is now such a common task that various companies are com-mercializing this hyphenated technique. In fact, our research group has recently demonstrated in a tutorial review how to obtain bioimaging from elemental dis-tribution by using MatLab software [13]. Nevertheless, such a strategy does not match the speed of data acqui-sition, since several hours are needed for the initial data acquisition process, while several days are required for their subsequent processing and image building. Although different solutions such as IMAGENA [14], Origin [15], PMOD [16], Maya vi2 [17], SMAK [18], or Microsoft Excel 2007 Macros [19], have been success-fully used for generating images from LA–ICP–MS data, they still suffer from major drawbacks: (1) most of them are not freely available (e.g., IMAGENA, Ori-gin, PMOD), (2) most of them are general-purpose programs requiring users to adapt data and learn spe-cific skills (e.g., programming languages and coding knowledge), or (3) they are not specifically designed to run automated analysis workflows and require a lot of user intervention. In this scenario, there is a clear gap to develop a freely-available software that can auto-matically produce accurate images and make the LA– ICP–MS application more popular and friendly in its imaging mode.
This is precisely the direction of this study, which proposes the LA-iMageS software to easily process all the data generated by LA–ICP–MS in the PerkinElmer Elan XL format, ensuring a fast processing workflow (data processing is done in few seconds after insert-ing the data) as well as the generation of elemen-tal distribution images (with a quality comparable to those obtained through MatLab). To demonstrate the usefulness of our LA-iMageS application, a diver-sity of systems/samples were used as examples, such as Arabidopsis thaliana seeds and histological slides from human tissues, working in two or three dimen-sions. In addition to the multitude of applications, the LA-iMageS proposal produces a link with different fields of scientific research (e.g., metallomics, medi-cine, biology, environmental and geology, among oth-ers), enabling a suitable space for transdisciplinary collaborations.
Methods
The LA-iMageS program is a graphical application that automates the data processing and elemental distribution visualization of LA–ICP–MS bioimaging. The overall architecture of LA-iMageS can be seen in Fig. 1.
(*.xl) as input, which is commonly generated by ICP–MS instrument control software from PerkinElmer, such as Elan 6 × 00 or Elan DRC-e. Each input dataset should be placed in a folder containing the XL files corresponding to each data line taken by the ICP–MS instrument. Each line file must contain a number that indicates the order in which it has been acquired by the ICP–MS instru-ment. For instance, in a dataset with ten lines, a valid set of names can be: line 1.xl, line 2.xl, line 3.xl, line 4.xl, line
5.xl, line 6.xl, line 7.xl, line 8.xl, line 9.xl, and line 10.xl.
Additionally, the dataset folder may include two optional files: parameters.conf, containing the ICP–MS data acquisition parameters, and positions.txt, containing the physical position of each line.
Data acquisition parameters
The optional parameters.conf file is used by the LA-iMageS software to automatically load acquisition param-eters. If this file is not present in the dataset’s directory, the user must manually introduce them. However, expe-rience demonstrates that it is a good practice to save the acquisition parameters along with data line files.
The data acquisition parameters that can be specified in this file are the following:
• Standard the standard element in the dataset. Inter-nal standard is an element used to normalize the results and to overcome instrumental oscillation. The other elements will be normalized using this element as standard. Users must choose a specific element to be monitored, for example, a known matrix element in the sample or those intentionally added by the user. The chosen element should minimize the varia-bility of the ablation process, which can be caused by local differences in tissue thickness and/or different interaction between the laser and the sample surface, allowing the observed signal to correspond to an ele-mental concentration in a specific location.
• Ablation speed speed set by the user in the laser oper-ational mode as continuous firing. This parameter relates to the spot size, which is determined by the laser beam diameter, and by the frequency, which cor-responds to the repetition rate of the laser. Usually, the value of ablation speed used is lower than spot size. • Acquisition time refers to the time needed for the
acquisition of one point considering all the elements monitored by the ICP–MS. This parameter is intrin-sically correlated to ICP–MS parameters, such as the number of isotopes monitored, sweeps, number of replicates and dwell (or residence) time. The
acquisi-tion time should not be higher than 1.0 s, since the elemental distribution information would be lost. • Space interval represents the distance among the
center of two lines. The lowest space interval results in the highest image resolution.
Data lines positions
The positions.txt file can be used to specify the physical position of each line in the instrument during the abla-tion process. This informaabla-tion is important for the ele-mental data extraction process explained below, since data acquisition can be made with laser position in the horizontal or vertical profile.
This file is optional and is used by the LA-iMageS soft-ware to read the position of each line and determine whether they are horizontal or vertical: if each line has the same X position while the initial and final Y-positions are different, it means that it is vertical; otherwise, if each line has the same Y-position while the initial and final X-positions are different, it means that it is horizontal. If this file is not present in the dataset’s directory, then LA-iMageS will consider the lines to be horizontal and will automatically generate their positions based on the acquisition parameters.
Since this file can be easily generated by ICP–MS instrument control software, we strongly encourage keeping a positions file along with the data lines files. Elemental data extraction
Elemental data is extracted from the input dataset in XL format, using the two optional configuration files if nec-essary. LA-iMageS parses input data in order to obtain
one two-dimensional matrix per element in the data-set, which stores the analyte distribution in the sample. Acquisition parameters are used along each positions file for axis definition.
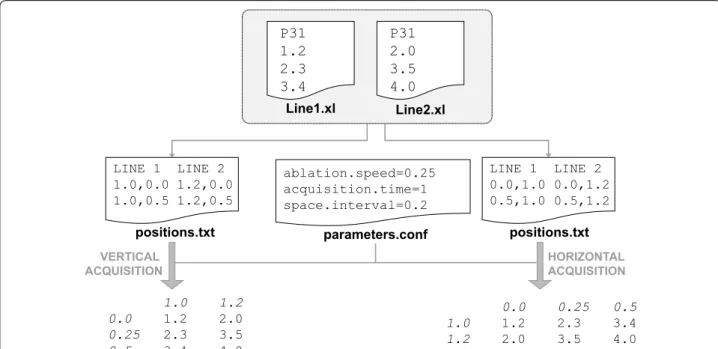
For instance, when data is acquired using the laser in the horizontal position, acquisition time and ablation speed parameters are used for x-axis definition: line measurements are separated by intervals of acquisition time multiplied by ablation speed. Conversely, the y-axis is simply defined by the spacing among the lines (i.e., space interval parameter). When data is acquired using the laser in the vertical position, the x-axis and y-axis are opposite to those in the horizontal mode, as Fig. 2 illustrates.
After the elemental data extraction process, each ele-ment is normalized by the specified standard eleele-ment, dividing its intensity matrix by that of the standard. Data visualization
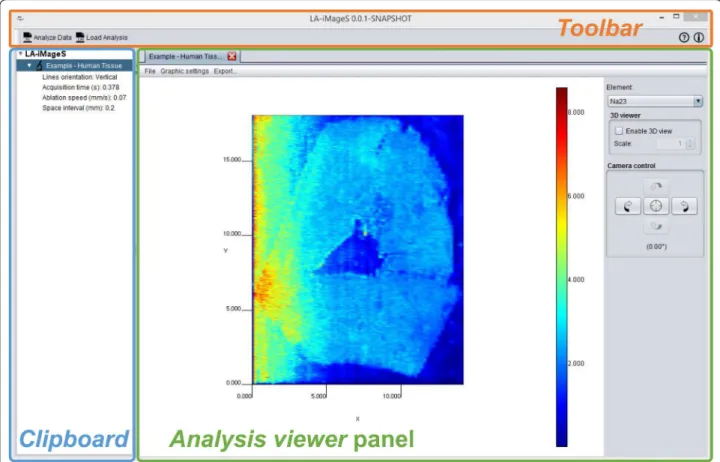
The main user interface of LA-iMageS (Fig. 3) is organ-ized into three main sections: the Toolbar, the Clipboard, and the Analysis viewer. Through the toolbar, users can access the main functions of LA-iMageS, where ‘data analysis’ is the most important operation. On the clip-board tree, users can find a list of loaded datasets. Finally, users can explore elemental data through the Analysis
viewer panel.
The most important section is the Analysis viewer panel, which consists of a 2D/3D representation of the current element distribution with a menu bar and a right sidebar providing access to several configuration options. It is important to stress out that 3D visualization reflects AIBench framework
LA-iMage
S
LA-ICP-MS data (*.xl files) parameters.conf positions.txt Data source(Elemental data extraction)
Operations
(Normalization, interpolation, etc.)
2D/3D element
visualization Export
Images (*.png) Element data (*.csv)
the signal intensity of each analyte only, and not the real topology of the sample.
The right sidebar allows users to select the element tribution that is being currently displayed, enable or dis-able the 3D view, and control the camera position.
The menu bar contains three submenus: (1) File, which allows saving the current analysis; (2) Graphical Settings, which enables the customization of the elemental distri-bution image; and (3) Export, which provides exporting facilities.
Tuning up the elemental distribution image
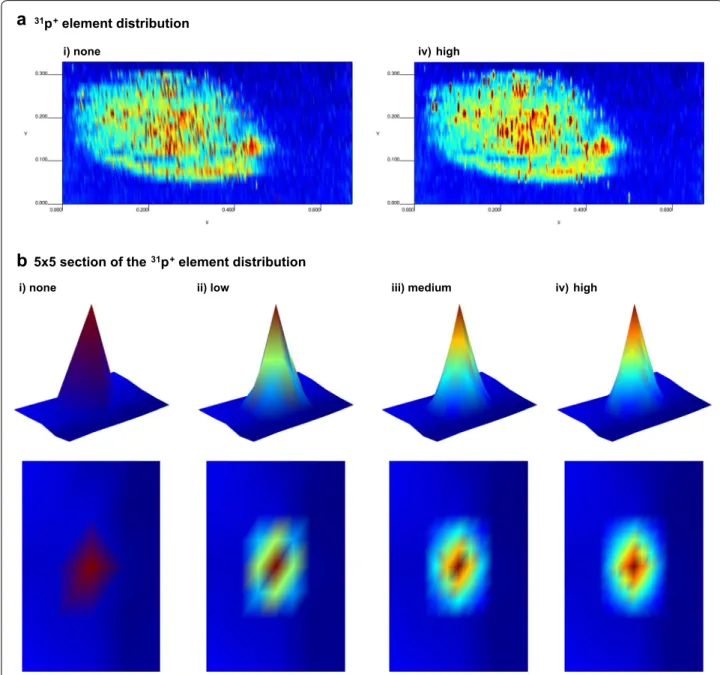
Elemental distribution images can be tuned up through-out the Graphical Settings submenu. A very useful fea-ture of this submenu is the interpolation level, since it allows creating new data points by interpolation within the range of the original set of data points, thus increas-ing image quality. Figure 4 illustrates how interpolation can help to improve image resolution.
Another important aspect to obtain good images is the color map adjustment. LA-iMageS allows customizing the color palette used to represent the image, as well as the range of values of the color map. Since each element has its own intensity range, this latter option is especially useful to obtain comparable images of different elemen-tal distributions by setting a color map within the same range of values for each element (Fig. 5).
Data export
After exploring data in the LA-iMageS, it is expected that users can employ their results in other complementary applications such as a word processor or another analy-sis package. To fulfill these needs, both elemental distri-butions (i.e., the data matrices) and images can be easily saved throughout the Export submenu of the Analysis
viewer panel. While elemental distributions are exported
using comma-separated values (CSV) files, 2D/3D bioim-ages are exported into portable network graphics (PNG) files.
When exporting data, users can choose to save only the element shown in the Analysis viewer panel, or all the elements of the dataset in a row with the same export configuration.
Implementation
The LA-iMageS software is implemented in Java using the AIBench framework [20]. It is provided as a self-contained, multiplatform Java standalone application. LA-iMageS is an open source project hosted on Github. The code architecture is interface driven, so developers can easily integrate new data formats and/or functions. The jzy3D and the Apache Commons Math Java librar-ies are also integrated within the project to render 2D/3D images and to perform mathematical operations (e.g., bilinear interpolation).
Fig. 2 Elemental data extraction process. In this example, 31P+ distribution is extracted from two line files using two positions files, one that defines
Results and discussion
With the goal of demonstrating the usefulness and fea-tures of LA-iMageS, this section presents a case study showing the 31P+ and 63Cu+ distribution in Arabidopsis thaliana seed. For a better comprehension of the use of
the software, all steps regarding image edition are prop-erly addressed in Additional file 4, and the dataset used in the case study can be found in Additional file 2.
Case study dataset
A correct image analysis depends on a good balance between laser speed and ICP–MS acquisition. As we have discussed in our previous work [13], the quality of the images can be improved with optimization of several LA and ICP–MS parameters. Data are usually obtained by scanning the sample surface as parallel lines in order to show the elemental distribution in the sample, and each line ablated is then recorded in different files. Several file formats can be used by the manufacturer to acquire data. As previously explained, LA-iMageS accepts ICP– MS data in the PerkinElmer Elan XL format, where data are organized as rows and columns. Each row repre-sents one intensity value at a time interval determined
by parameters that influence the acquisition time (e.g., residence time, number of replicates, sweeps or readings, among others) of the ICP–MS, considering all m/z meas-ured. The first column indicates the time, while subse-quent columns show the results for each ion monitored. Using LA-iMageS, the user needs to indicate the local path where data were saved, and the acquisition param-eters to automatically obtain the corresponding image.
In our example, the speed ablation was 10 µm s−1 and
the ICP–MS acquisition time for each point was settled at 0.270 s. For providing the y-coordinate resolution, the distance among the lines was 15 µm for image building. All LA–ICP–MS instrumental conditions are shown in Table 1. The acquisition of two-dimensional images was performed in accordance to the method previously pro-posed [9, 13].
Thus, the XL files obtained from the ICP–MS acquisi-tion were copied from an instrument computer control-ler (Additional file 2). Each line generated through the ablation process resulted in one different file, and 23 lines were needed for mapping the entire sample surface, gen-erating 23 XL files (considering the distance among the lines, as previously indicated).
Elemental distribution of the Arabidopsis thaliana seed In order to facilitate comprehension of the case study, a summary is presented in Additional file 4 (slide 1), show-ing all steps involved in the image buildshow-ing process. First, a view of the initial software panel is presented (slide 2), where the “Analyze Data” option is used to start the image building. This option shows a dialog box (slide 3), allow-ing users to select the folder containallow-ing the input XL files (slides 4 and 5) and introduce the ablation parameters (standard, ablation speed, acquisition time, and space
interval). It is important to remember that these param-eters could be stored in the parameter.conf file along with input XL files, to avoid the need for users to manually introduce them. A first view of the image is readily gen-erated using default parameters, with additional edition steps required to obtain a good representation (slide 6).
To obtain an optimal image, the element intensity must be adjusted (slides 7–9) in accordance to the ratio between the analyte 31P+ and standard 12C+. This is
achieved by customizing both the color map range and
ii) low iii) medium iv) high
i) none
iv) high i) none
b
5x5 section of the 31p+element distributionFig. 4 Effect of interpolations. a 31P+ elemental distribution image in Arabidopsis thaliana seed (Additional file 2) using different interpolation levels:
i no interpolation and iv high. b Detail of a 5 × 5 section of the 31P+ elemental distribution (Additional file 3) using different interpolation levels: i no
the color map palette. The color map range (slide 7) can be edited by clicking the sequence “Graphic set-tings” → “Range mode” → “Custom”, which enables a
dialog (slide 8) to set the minimum and maximum color data levels (in this case study, 0.007 and 0.025, respec-tively). As illustrated in Fig. 5, each element can have a
Fig. 5 Effect of the range of values used for the color map for three elements from histological slides of a human sample (Additional file 1). Images on the left correspond to color maps generated using the corresponding element distribution’s range of values. Images on the right correspond to
particular range of intensities, and the user must seek the best relation for obtaining the desired output.
Another way to improve the image is smoothing or interpolation, which results in better image resolution. By default, no interpolation is applied to the images but LA-iMageS allows users to apply three different levels: low, medium, and high. To improve the resolution of the image in this case study, the highest level is selected by clicking the sequence “Graphic settings” → “Interpola-tion level” → ”High” (slides 10 and 11).
After carrying out these important editing steps (Fig. 6), the image is ready to be exported as a PNG file for further use in external applications (slides 12–15). By using the “Export” → “As image” menu options (slide 12), a new dialog box appears (slide 13) allowing users to set the size of the image in pixels. By clicking the “OK” but-ton, the image is stored in the selected directory (slide 14), and can now be easily visualized or edited using any computer with Windows, Linux, or Mac operating sys-tems (slide 15).
Alternatively, elemental distributions can be also saved as CSV files (slides 16–20) so that they can be further used as input in general-purpose scientific applications such as Matlab or Excel. Users can export the intensity ratio values between analyte and standard into a CSV file
mat (Excel compatible CSV, used in this case study, or Libre/Open Office compatible CSV) or by defining a cus-tom format (slide 17). By clicking the “OK” button, the data is saved in the selected directory (slides 18 and 19). Finally, this CSV file is opened with Excel (slide 20).
A particularly useful feature of the LA-iMageS soft-ware is the possibility of saving the image configuration, so that it can be edited later or even reused in future experiments (slide 21–30). This can be done by using the “File” → “Save analysis” menu options, which opens a new dialog to select the folder and file with .lai exten-sion (slides 22 and 23). This way, if LA-iMageS software is closed, the image edition can be retaken later at the same status. To recover the image (slides 25–30), users must use the “Load analysis” option of the toolbar (slide 25) and select the previously saved file (Seed.lai in our case study).
Finally, LA-iMageS provides additional features allow-ing a high degree of image customization. These features, illustrated in Additional file 4 (slides 32–55), include: (1) image rotation (slides 32–34), (2) three-dimensional ele-mental distribution visualization (slides 35–37), (3) axis hiding (slides 38–39), (4) restart image settings to the original conditions (slides 40–41), (5) element selection (slides 42–47), (6) color bar hiding (slides 48 to 51), and (7) axis tick lines hiding (slides 52–55).
Conclusions
This work has presented LA-iMageS as a new open-source software for rapid processing and visualization of LA–ICP–MS data. Our application fully automates the process of generating elemental distribution images from LA–ICP–MS data. LA-iMageS is completely free and provides a friendly graphical user interface designed to avoid the need for a bioinformatics expert to use it.
Finally, LA-iMageS is open to further extension, such as supporting new data formats, including new opera-tions, or improving those currently available.
Availability and requirements
• Project name: LA-iMageS.
• Project home page: http://www.la-images.net • Project source code repository: http://github.com/
sing-group/la-images
• Operating system(s): Platform independent. • Programming language: Java.
• License: GNU GPL v3.
• Any restrictions to use by non-academics: None. For proper use, guidance and maintenance, please con-tact [email protected].
Instrument settings
Nebulizer Meinhard
Spray chamber Cyclonic
RF power (W) 1300
Nebulizer gas flow (L min−1) 1.0
Auxiliary gas flow (L min−1) 2.0
Data acquisition parameters
Reading mode Peak hopping
Detector mode Pulse
Sweeps 3
Dwell time (ms) 30
Integration time (ms) 270 (for each point)
Detector dead time (ns) 60
Lens voltage (V) Automatic mode
Monitored isotopes 12C, 63Cu and 31P
Laser conditions
Wavelength of Nd:YAG laser (nm) 213 Laser ablation intensity (%) 50
Frequency (Hz) 20
Spot size (µm) 12
Scan speed (µm s−1) 10
Resolution—X axis (µm) 2.7
Authors’ contributions
HLF, MRJ, DGP and FFR designed and implemented the LA‑iMageS software. GSP, MAZA and JLCM provided the original idea for LA‑iMageS as well as valu‑ able guidance, testing and feedback throughout all the implementation. All authors read and approved the final manuscript.
Author details
1 ESEI: Escuela Superior de Ingeniería Informática, University of Vigo, Edificio Politécnico, Campus Universitario As Lagoas s/n, 32004 Ourense, Spain. 2 Group of Spectrometry, Sample Preparation and Mechanization (GEPAM), Institute of Chemistry, University of Campinas, UNICAMP, PO Box 6154, Campi‑ nas, SP 13084‑62, Brazil. 3 National Institute of Science and Technology for Bio‑ analytics, Institute of Chemistry, University of Campinas, UNICAMP, Campinas, SP 13083‑862, Brazil. 4 UCIBIO‑REQUIMTE, Chemistry Department, Faculty of Science and Technology, University NOVA of Lisbon, 2829‑516 Monte da Caparica, Portugal. 5 ProteoMass Scientific Society, Madan Parque, Rua dos Inventores, 2825‑182 Caparica, Portugal.
Acknowledgements
The authors thank the Fundação de Amparo a Pesquisa do Estado de São Paulo (FAPESP, São Paulo, Brazil), the Conselho Nacional de Desenvolvimento Additional files
Additional file 1. Dataset corresponding to LA–ICP–MS analysis of a human tissue used to illustrate LA‑iMageS features.
Additional file 2. Case study dataset corresponding to LA–ICP–MS analysis of a Arabidopsis thaliana seed.
Additional file 3. Dataset corresponding to a 5 × 5 section of 31P+ ele‑ ment from case study dataset (Additional file 2) to reproduce Fig. 4b
Additional file 4. Tutorial describing the steps to reproduce the case study and perform a full LA‑iMageS analysis.
Científico e Tecnológico (CNPq, Brasília, Brazil), the Coordenação de Aperfeiçoamento de Pessoal de Nível Superior (CAPES, Brasília, Brazil), and the INOU‑16‑05 project from the Provincial Council of Ourense for finan‑ cial support and fellowships. Dr. Capelo acknowledges support given by the Associate Laboratory for Green Chemistry LAQV which is financed by national funds from FCT/MEC (UID/QUI/50006/2013) and co‑financed by the ERDF under the PT2020 Partnership Agreement (POCI‑01‑0145‑FEDER ‑ 007265), and by the Unidade de Ciências Biomoleculares Aplicadas‑UCIBIO which is financed by national funds from FCT/MEC (UID/Multi/04378/2013) and co‑financed by the ERDF under the PT2020 Partnership Agreement (POCI‑01‑0145‑FEDER‑007728). H. López‑Fernández is supported by a post‑ doctoral fellowship from Xunta de Galicia. SING group thanks CITI (Centro de Investigación, Transferencia e Innovación) from University of Vigo for hosting its IT infrastructure.
Competing interests
The authors declare that they have no competing interests. Received: 4 July 2016 Accepted: 10 November 2016
References
1. Wood ST, Dean BC, Dean D (2013) A linear programming approach to reconstructing subcellular structures from confocal images for auto‑ mated generation of representative 3D cellular models. Med Image Anal 17:337–347. doi:10.1016/j.media.2012.12.002
2. Kokhanovsky AA, Davis AB, Cairns B et al (2015) Space‑based remote sensing of atmospheric aerosols: the multi‑angle spectro‑polarimetric frontier. Earth Sci Rev 145:85–116. doi:10.1016/j.earscirev.2015.01.012
3. Wehrl HF, Schwab J, Hasenbach K et al (2013) Multimodal elucida‑ tion of choline metabolism in a murine glioma model using magnetic resonance spectroscopy and 11C‑choline positron emission tomography. Cancer Res 73:1470–1480. doi:10.1158/0008‑5472.CAN‑12‑2532
5. McDonnell LA, Heeren RMA (2007) Imaging mass spectrometry. Mass Spectrom Rev 26:606–643. doi:10.1002/mas.20124
6. Muñoz JJ, Drigo SA, Barros‑Filho MC et al (2015) Down‑regulation of SLC8A1 as a putative apoptosis evasion mechanism by modulation of calcium levels in penile carcinoma. J Urol 194:245–251. doi:10.1016/j. juro.2014.11.097
7. Becker JS, Zoriy MV, Pickhardt C et al (2005) Imaging of copper, zinc, and other elements in thin section of human brain samples (hippocampus) by laser ablation inductively coupled plasma mass spectrometry. Anal Chem 77:3208–3216. doi:10.1021/ac040184q
8. Maciel BCM, Barbosa HS, Pessôa GS et al (2014) Comparative prot‑ eomics and metallomics studies in Arabidopsis thaliana leaf tissues: evaluation of the selenium addition in transgenic and nontransgenic plants using two‑dimensional difference gel electrophoresis and laser ablation imaging: proteomics 2014. Proteomics 14:904–912. doi:10.1002/ pmic.201300427
9. da Silva MAO, Arruda MAZ (2013) Laser ablation (imaging) for mapping and determining Se and S in sunflower leaves. Metallomics 5:62–67. doi:10.1039/C2MT20154B
10. Oliveira SR, Arruda MAZ (2015) Application of laser ablation (imag‑ ing) inductively coupled plasma mass spectrometry for mapping and quantifying Fe in transgenic and non‑transgenic soybean leaves. J Anal Spectrom 30:389–395. doi:10.1039/C4JA00276H
11. Becker JS (2007) Inorganic mass spectrometry. Wiley, Chichester 12. Pozebon D, Scheffler GL, Dressler VL, Nunes MAG (2014) Review of the
applications of laser ablation inductively coupled plasma mass spectrom‑ etry (LA–ICP–MS) to the analysis of biological samples. J Anal Spectrom 29:2204–2228. doi:10.1039/C4JA00250D
13. de Pessôa S, Capelo‑Martínez JL, Fdez‑Riverola F et al (2016) Laser abla‑ tion and inductively coupled plasma mass spectrometry focusing on
and analysis—an interactive software tool handling LA–ICP–MS data. Int J Mass Spectrom 307:232–239. doi:10.1016/j.ijms.2011.03.010
15. Nemes P, Barton AA, Li Y, Vertes A (2008) Ambient molecular imaging and depth profiling of live tissue by infrared laser ablation electrospray ionization mass spectrometry. Anal Chem 80:4575–4582. doi:10.1021/ ac8004082
16. Matusch A, Fenn LS, Depboylu C et al (2012) Combined elemental and biomolecular mass spectrometry imaging for probing the inventory of tissue at a micrometer scale. Anal Chem 84:3170–3178. doi:10.1021/ ac203112c
17. Austin C, Smith TM, Bradman A et al (2013) Barium distributions in teeth reveal early‑life dietary transitions in primates. Nature 498:216–219. doi:10.1038/nature12169
18. Jackson BP, Bugge D, Ranville JF, Chen CY (2012) Bioavailability, toxicity, and bioaccumulation of quantum dot nanoparticles to the amphipod Leptocheirus plumulosus. Environ Sci Technol 46:5550–5556. doi:10.1021/ es202864r
19. Uerlings R, Matusch A, Weiskirchen R (2016) Reconstruction of laser ablation inductively coupled plasma mass spectrometry (LA–ICP–MS) spatial distribution images in Microsoft Excel 2007. Int J Mass Spectrom 395:27–35. doi:10.1016/j.ijms.2015.11.010
20. Glez‑Peña D, Reboiro‑Jato M, Maia P et al (2010) AIBench: a rapid application development framework for translational research in biomedicine. Comput Methods Prog Biomed 98:191–203. doi:10.1016/j. cmpb.2009.12.003