I
MESTRADO EM ECONOMIA INTERNACIONAL E ESTUDOS
EUROPEUS
TRABALHO FINAL DE MESTRADO
DISSERTAÇÃO
THE EVOLUTION OF TRADE FLOWS BETWEEN PORTUGAL
AND CHINA: AN INTER-INDUSTRY APPROACH
Ji Zhang
LISBOA
SETEMBRO 2016
II
MESTRADO EM ECONOMIA INTERNACIONAL E ESTUDOS
EUROPEUS
TRABALHO FINAL DE MESTRADO
DISSERTAÇÃO
THE EVOLUTION OF TRADE FLOWS BETWEEN PORTUGAL
AND CHINA: AN INTER-INDUSTRY APPROACH
Ji Zhang
Orientação: Professor Doutor João Carlos Lopes
LISBOA
SETEMBRO 2016
III
Abstract
After the policy of reform and opening-up, during the last 3 decades, China was the world’s fastest-growing major country, with growth rate averaging over 10%. And China has become the biggest country of international trade and the second biggest economy in the world.
On the other hand, after joining the European Union, despite of the great recession of 2008/2009 and the Euro Zone crisis between 2010 and 2013, the Portuguese economy has a significant growth in the last few decades.
In addition, the trade between Portugal and China also expanded a lot. The growth of trade between two countries was very significant.
The object of this investigation is the trade flows between Portugal and China particularly in the global value chains. As we know, the European Union is the biggest trade partner of China with the annual value about 521 billion Euros in 2015. Portugal, as a member of the European Union, plays an important role in the bilateral trading. This research involves the analysis of the trade flows in total gross value and gross value by sectors and the vertical specialization in global value chains, in order to explain the main characteristics of the evolution of trade flows between them. It is decided to use the Leontief Input-Output Model and the Vertical Specialization for the analysis of the data from the World Input-Output Database (WIOD).
Key-words: Trade flows; Vertical specialization; Global value chains;
Input-Output analysis; Portugal; China
IV
Index
1. Introduction---1
2. Trade flows between Portugal and China---3
2.1 Global trade patterns: 1995-2015---3
2.1.1 Gross value---3
2.1.2 Weight in total exports---5
2.2 Trade by sector---7
2.2.1 Gross exports from Portugal to China---7
2.2.2 Weight of exports Portugal/China versus Portugal/world in each sector---12
2.2.3 Gross exports from China to Portugal---16
2.2.4 Weight of exports China/Portugal versus China/world in each sector---20
3. Trade in value added and vertical specialization between Portugal and China---23
3.1 Theoretical and methodological framework---23
3.2 Empirical results---25
3.2.1 Direct foreign content of domestic production---25
3.2.2 Direct foreign content of exports---26
3.2.3 Total foreign content of exports---28
4. Explanation of the possible error of the original data from WIOD---31
5. Conclusions---32
References---33
1
1. Introduction
In the recent few decades, the global trade has changed the whole world. The world is becoming integrated, and everyone depends more and more on each other because of the fast growing fragmentation of production activities. Each country concentrates on the production where it has the abundant productive factors. This is named by Richard Baldwin (2006) as the “second unbundling”. After that, the booming global trade contributes to the extremely fast growth of the world. And Global Value Chains (GVC) became the paradigm for the production of most goods and services around the world. Production is nowadays vertically fragmented across different countries (Amador and Stehrer (2014)).
China, with the policy of reform and opening-up starting from the 80s, became to export more and more products to the rest of world and to play an important role in the global trade because of its low costs and cheap labor. As one of the largest economies in the world, the European Union becomes the first trade partner of China.
Meanwhile, Portugal, as one of the important members of the EU, despite of its small size in geography and economy, grew a lot in the recent decades with its concentration on the global trade. Nowadays the exports contribute more and more to the Portuguese economy.
Considering the two facts above, a study of the trade flows between Portugal and China could be very interesting.
The research is based on the data of World Input-Output Database (WIOD) and UN Comtrade. Created by the European Commission, available in http://www.wiod.org/, WIOD is the first public database that contains new information and opportunities to analyse the global trade flows and fragmentation by sectors. The WIOD provides time-series of world input-output tables for forty countries worldwide and the rest of the world, covering the period from 1995 to 2011 (Timmer (2012)). Moreover, UN Comtrade is a repository of official trade statistics and relevant analytical tables. It contains annual trade statistics starting from 1962 and monthly trade statistics since 2010, available in http://www.comtrade.un.org/.
2
To analyze, it is decided to take the years of 1995, 1999, 2004, 2008, 2009 and 2011. Because the year of 1995 was the first year that the WIOD begins. The year of 1999 was the year when Portugal joined the Euro Zone. The year of 2004 was the year when the largest single expansion of the European Union happened which is called the “2004 enlargement of the European Union”. The year of 2008 was the year when the global financial crisis happened. And the year of 2009 was the second year of the financial crisis. Finally, the year of 2011 was the year that the WIOD ends.
Basically there are two ways to analyze the trade flows between Portugal and China: the gross value and the added value. Within Chapter 2, the analysis is based on the gross value and there are two parts. The first part is global value patterns: 1995-2015. The second part is trade by sector. The top ten sectors will be introduced both in value and in percentage. In Chapter 3, on the other way, the analysis is based on the added value in order to make a better understanding of the positions of the two countries in the global value chains (GVC). In this article, the concept of vertical specialization is used to analysis the added value. We use both direct foreign content of exports applied by Feenstra and Hanson (1999) and total (direct and indirect) foreign content of exports proposed by Hummels et al (2001) as two measures. Lately in Chapter 4, we are going to note out some possible errors in the data of WIOD, particularly in some exports of services from Portugal to China. Finally, Chapter 5 concludes, with the main findings as well as some limitations and possible future lines of research indicated.
3
2. Trade flows between Portugal and China 2.1 Global trade patterns: 1995-2015
2.1.1 Gross Value
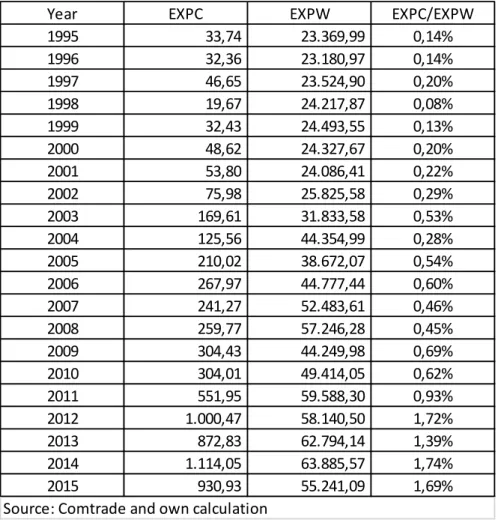
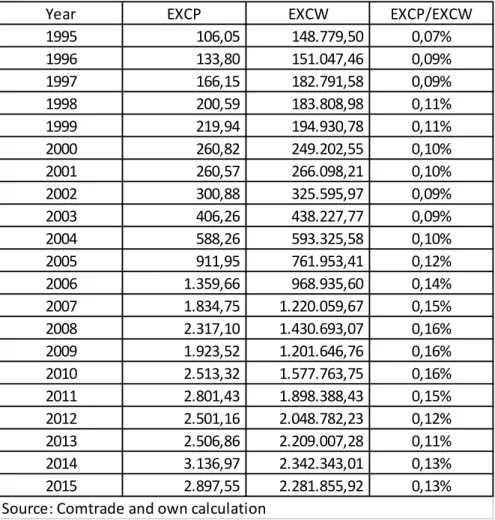
In table 1 and table 2, “EXPC” means the exports from Portugal to China, “EXPW” means the exports from Portugal to the rest of the world, “EXCP” means the exports from China to Portugal and “EXCW” means the exports from China to the rest of the world.
Table 1: Exports from Portugal to China (million US$)
As we can see from the table 1, from 1995 to 2015, the exports from Portugal to China (EXPC) grew every year except 1996, 1998, 2004, 2007, 2013 and 2015. And during the two decades, EXPC has increased by about thirty times which was very significant. Along all the years, we can see that there were two biggest jumps in the year 2003 and
Year EXPC EXPW EXPC/EXPW
1995 33,74 23.369,99 0,14% 1996 32,36 23.180,97 0,14% 1997 46,65 23.524,90 0,20% 1998 19,67 24.217,87 0,08% 1999 32,43 24.493,55 0,13% 2000 48,62 24.327,67 0,20% 2001 53,80 24.086,41 0,22% 2002 75,98 25.825,58 0,29% 2003 169,61 31.833,58 0,53% 2004 125,56 44.354,99 0,28% 2005 210,02 38.672,07 0,54% 2006 267,97 44.777,44 0,60% 2007 241,27 52.483,61 0,46% 2008 259,77 57.246,28 0,45% 2009 304,43 44.249,98 0,69% 2010 304,01 49.414,05 0,62% 2011 551,95 59.588,30 0,93% 2012 1.000,47 58.140,50 1,72% 2013 872,83 62.794,14 1,39% 2014 1.114,05 63.885,57 1,74% 2015 930,93 55.241,09 1,69% Source: Comtrade and own calculation
4
the year 2012. On the other hand, the exports from Portugal to the rest of the world (EXPW) only grew more or less two times in the same period, which is a big contrast comparing to EXPC.
What’s more, considering the last column, the weight of EXPC in EXPW grew dramatically from 0.14% in 1995 to 1.69% in 2015. Although the growth was very great, the exports from Portugal to China did not consider to be an important part in the total exports of Portugal.
Table 2: Exports from China to Portugal (million US$)
In terms of the exports from China to Portugal (EXCP), from 1995 to 2015, it expanded about twenty-seven times, which was quite remarkable. And in the same time, the exports from China to the rest of the world (EXCW) also grew about fifteen times. For the last two decades, the ratio of EXCP in EXCW increased from 0.07% in 1995 to 0.13% in 2015 (see Table 2).
Year EXCP EXCW EXCP/EXCW
1995 106,05 148.779,50 0,07% 1996 133,80 151.047,46 0,09% 1997 166,15 182.791,58 0,09% 1998 200,59 183.808,98 0,11% 1999 219,94 194.930,78 0,11% 2000 260,82 249.202,55 0,10% 2001 260,57 266.098,21 0,10% 2002 300,88 325.595,97 0,09% 2003 406,26 438.227,77 0,09% 2004 588,26 593.325,58 0,10% 2005 911,95 761.953,41 0,12% 2006 1.359,66 968.935,60 0,14% 2007 1.834,75 1.220.059,67 0,15% 2008 2.317,10 1.430.693,07 0,16% 2009 1.923,52 1.201.646,76 0,16% 2010 2.513,32 1.577.763,75 0,16% 2011 2.801,43 1.898.388,43 0,15% 2012 2.501,16 2.048.782,23 0,12% 2013 2.506,86 2.209.007,28 0,11% 2014 3.136,97 2.342.343,01 0,13% 2015 2.897,55 2.281.855,92 0,13% Source: Comtrade and own calculation
5
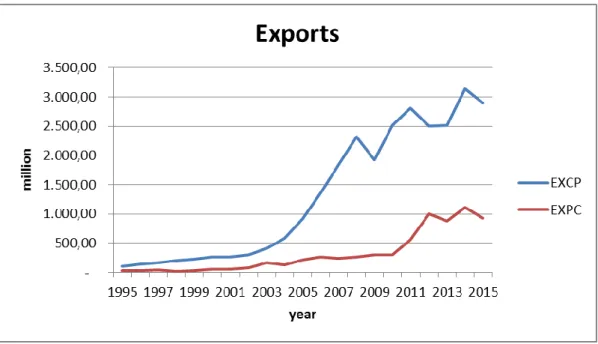
Figure 1: Exports from Portugal to China and from China to Portugal
Source: Comtrade and own Calculation
In Figure 1, comparing EXPC and EXCP, EXCP is quite larger than EXPC, which means China has a big trade surplus with Portugal. From the very beginning, the exports from China to Portugal were bigger than the ones from Portugal and the difference became larger and larger. For example, in 2015 (the last year of this study), EXCP is almost three times of EXPC. But in terms of evolutions, both two had almost the same trend. When the exports from China to Portugal decreased, the exports from Portugal to China also decreased. When the exports from Portugal to China increased, the same thing happened to the ones from China to Portugal. And they both reached the peaks at the same time.
2.1.2 Weight in total exports
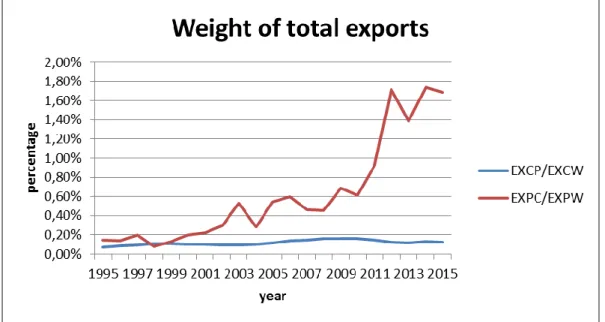
In another view, in Figure 2, EXPC/EXPW expanded a lot along these years from 0.14% in 1995 to 1.69% in 2015. This means that the weight of EXPC in EXPW has a
6
significant increase, but in terms of absolute value, it was still a small part of the total exports of Portugal.
Figure 2: Weight of exports from Portugal to China in total exports and Weight of exports from China to Portugal in total exports
Source: Comtrade and own Calculation
Nevertheless, the occupation of EXCP in EXPW only has a small growth and continued seeming always the same level (Figure 2, blue line). The ratio was 0.07% in 1995 and 0.13% in 2015. It was always a small value in the total exports of China which means that the exports from China to Portugal were not an important component never. Comparing Figure 1 and Figure 2, the exports from Portugal to China were smaller than the exports from China to Portugal, but the weight of exports from Portugal to China in total exports was much bigger than the one from China. It implies that along the two decades, the growth of total exports of Portugal were smaller than China.
7
2.2 Trade by sector
2.2.1 Gross exports from Portugal to China
From table 3 to table 26, the unit of the data is million US$. The years of 1995, 1999, 2004, 2008, 2009 and 2011 are chosen for the analysis. And the top ten sectors with biggest values are shown. From Table 3 to Table 26, “T” means total, “Z” means exports are for domestic production, and “Y” means exports are for final consumption. Table 3: Exports Portugal/China: weight of top 10 sectors-1995
In 1995, the top 10 sectors of exports from Portugal to China in gross value are c30-Renting of Equipment and Other Business Activities, c28-Financial Intermediation, c34-Other Community, Social and Personal Services, c14-Electrical and Optical Equipment, c9-Chemical and Chemical Products, c4-Textiles and Textiles Products, c31-Pulbic Admin and Defense, Compulsory Social Security, c6-Wood and Products of Wood and Cork, c2-Mining and Quarrying and c13-Machinery, Nec.(see table 3) Among them, the top 3 sectors (c30, c28 and c34) represent 68% of whole exports from Portugal to China. And then come c14 with 6%, c9 with 4% and c4 with 3%. It means that the majority of the exports from Portugal to China is services.
In terms of destination of exports, the major part of exports from Portugal to China in 1995 was for the domestic production of China. It was 224.69 million US$ for domestic production but was only 59.79 million for the final consumption of China.
Sector Rank Value % Rank Value % Rank Value %
c30-Renting of M&Eq and Other Business Activities 1 78,67 28% 1 73,06 33% 4 5,61 9%
c28-Financial Intermediation 2 76,23 27% 2 60,11 27% 1 16,12 27%
c34-Other Community, Social
and Personal Services 3 36,31 13% 3 24,28 11% 2 12,04 20% c14-Electrical and Optical Equipment 4 17,05 6% 4 13,67 6% 6 3,38 6%
c9-Chemicals and Chemical Produts 5 12,69 4% 5 10,25 5% 8 2,44 4%
c4-Textiles and Textile Produts 6 9,56 3% 10 3,04 1% 3 6,51 11%
c31-Public Admin and Defence;
Compulsory Social Security 7 7,74 3% 6 7,15 3% 11 0,59 1% c6-Wood and Produts of Wood and Cork 8 5,70 2% 7 5,67 3% 29 0,03 0%
c2-Mining and Quarrying 9 5,23 2% 8 5,22 2% 32 0,01 0%
c13-Machinery, Nec 10 5,19 2% 17 1,04 0% 5 4,16 7%
Others 30,11 11% 21,21 9% 8,90 15%
Total 284,48 100% 224,69 100% 59,79 100%
Source: WIOD and own calculations
8
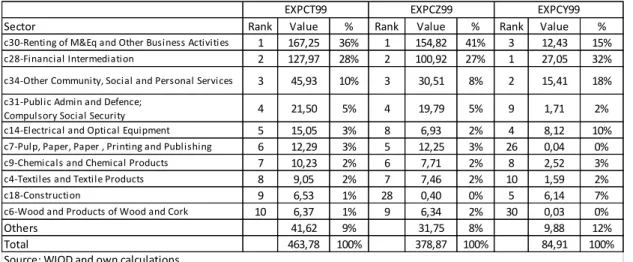
Table 4: Exports Portugal/China: weight of top 10 sectors-1999
From Table 4, as we can see, in 1999, the total amount of exports from Portugal to China increased a lot comparing to the amount of the year 1995. In 1995 it was 284.48 million US$ and 463.78 million in 1999. The biggest industry was still c30-Renting of Equipment and Other Business Activities with 167.25 million US$. But the principal destination of exports of c30 was the domestic consumption. The percentage of the top 3 sectors (c30-36%, c28-28%, c34-10%) increased to 74% in total exports. And another service c31-Public Admin and Defense increased to the fourth place, occupying 5% of whole exports. It implied that the services were very important components in the exports from Portugal to China.
On the other hand, in these sectors such as c14-Electrical and Optical Equipment, c9-Chemicals and Chemical Products and c4-Textiles and Textile Products, although the amounts of trade remained the same, the weight of the percentage decreased.
The principal exports from Portugal to China in 1999 was for domestic production with 378.87 million US$. And just 84.91 million was for the final consumption of China.
Sector Rank Value % Rank Value % Rank Value %
c30-Renting of M&Eq and Other Business Activities 1 167,25 36% 1 154,82 41% 3 12,43 15%
c28-Financial Intermediation 2 127,97 28% 2 100,92 27% 1 27,05 32%
c34-Other Community, Social and Personal Services 3 45,93 10% 3 30,51 8% 2 15,41 18%
c31-Public Admin and Defence;
Compulsory Social Security 4 21,50 5% 4 19,79 5% 9 1,71 2% c14-Electrical and Optical Equipment 5 15,05 3% 8 6,93 2% 4 8,12 10%
c7-Pulp, Paper, Paper , Printing and Publishing 6 12,29 3% 5 12,25 3% 26 0,04 0%
c9-Chemicals and Chemical Products 7 10,23 2% 6 7,71 2% 8 2,52 3%
c4-Textiles and Textile Products 8 9,05 2% 7 7,46 2% 10 1,59 2%
c18-Construction 9 6,53 1% 28 0,40 0% 5 6,14 7%
c6-Wood and Products of Wood and Cork 10 6,37 1% 9 6,34 2% 30 0,03 0%
Others 41,62 9% 31,75 8% 9,88 12%
Total 463,78 100% 378,87 100% 84,91 100%
Source: WIOD and own calculations
9
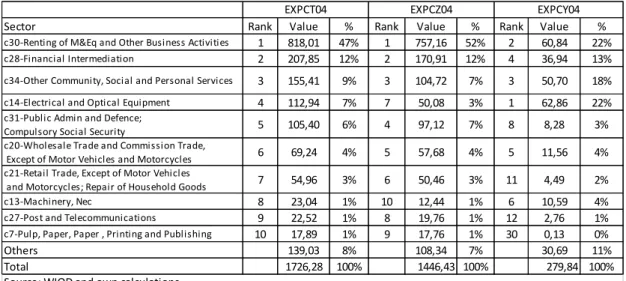
Table 5: Exports Portugal/China: weight of top 10 sectors-2004
In 2004, the exports from Portugal to China (1726.28 million US$) was already more or less four times of the value of the year 1999 (463.78 million US$). The top 3 sectors (c30-47%, c28-12%, c34-9%) continued reinforcing its percentage in the exports from Portugal to China with total 68%. The sector of c14-Electrical and Optical Equipment also increased a lot both in the percentage and in the absolute value. And it is noted that these sectors like c20-Wholesale Trade and Commission Trade and c21-Retail Trade became to play an important role in the exports from Portugal to China. But the weight was still small. And as it can be seen that besides the top 10 sectors, all the others sectors only had 8% of the weight with 139.03 million US$ which means the exports from Portugal to China was unbalanced. Moreover, considering the destination of exports, 1446.43 million US$ was intermediate goods and 279.84 million was for the final consumption (see Table 5).
Sector Rank Value % Rank Value % Rank Value %
c30-Renting of M&Eq and Other Business Activities 1 818,01 47% 1 757,16 52% 2 60,84 22%
c28-Financial Intermediation 2 207,85 12% 2 170,91 12% 4 36,94 13%
c34-Other Community, Social and Personal Services 3 155,41 9% 3 104,72 7% 3 50,70 18%
c14-Electrical and Optical Equipment 4 112,94 7% 7 50,08 3% 1 62,86 22%
c31-Public Admin and Defence;
Compulsory Social Security 5 105,40 6% 4 97,12 7% 8 8,28 3% c20-Wholesale Trade and Commission Trade,
Except of Motor Vehicles and Motorcycles 6 69,24 4% 5 57,68 4% 5 11,56 4% c21-Retail Trade, Except of Motor Vehicles
and Motorcycles; Repair of Household Goods 7 54,96 3% 6 50,46 3% 11 4,49 2% c13-Machinery, Nec 8 23,04 1% 10 12,44 1% 6 10,59 4%
c27-Post and Telecommunications 9 22,52 1% 8 19,76 1% 12 2,76 1%
c7-Pulp, Paper, Paper , Printing and Publishing 10 17,89 1% 9 17,76 1% 30 0,13 0%
Others 139,03 8% 108,34 7% 30,69 11%
Total 1726,28 100% 1446,43 100% 279,84 100%
EXPCT04 EXPCZ04 EXPCY04
10
Table 6: Exports Portugal/China: weight of top 10 sectors-2008
In Table 6 of the year 2008, the exports from Portugal to China decreased almost 36% with the total value of 111.19 million US$. And suddenly the original top 3 service sectors disappeared from the top 10 list. Instead, the sector of c14-Electrical and Optical Equipment became the largest industry which exports to China with 283.61 million US$. Even it was the largest in all sectors, it was smaller than c30 in the year 2004 (818.01 million US$, see in Table 5). After c14, c27-Post and Telecommunications also had a large amount of exports from Portugal to China, ranking the second place in the top 10 list. What’s more, c15-Transport Equipment, C12-Basic Metals and Fabricated Metal, c3-Food, Beverages and Tobacco and c5-Leather, Leather and Footwear appeared in the top 10 list for the first time. In another point of view, all the other sectors took 42% of the total exports which was much bigger comparing to 8% in the year of 2004 (see Table 5). And it seems that the difference of amount between intermediate goods (772.38 million US$) and final consumption goods (338.8 million US$) became smaller than in the year of 2004.
Sector Rank Value % Rank Value % Rank Value %
c14-Electrical and Optical Equipment 1 283,61 26% 1 213,09 28% 1 70,52 21%
c27-Post and Telecommunications 2 171,25 15% 2 142,64 18% 3 28,61 8%
c4-Textiles and Textile Products 3 42,94 4% 10 5,92 1% 2 37,02 11%
c9-Chemicals and Chemical Products 4 32,94 3% 3 32,79 4% 18 0,15 0%
c13-Machinery, Nec 5 26,98 2% 5 12,85 2% 5 14,12 4%
c15-Transport Equipment 6 26,39 2% 7 9,73 1% 4 16,66 5%
c6-Wood and Products of Wood and Cork 7 22,55 2% 4 22,50 3% 22 0,05 0%
c12-Basic Metals and Fabricated Metal 8 16,89 2% 8 8,03 1% 8 8,86 3%
c3-Food, Beverages and Tobacco 9 12,67 1% 24 0,14 0% 6 12,54 4%
c5-Leather, Leather and Footwear 10 12,27 1% 14 1,95 0% 7 10,32 3%
Others 462,71 42% 322,75 42% 139,97 41%
Total 1111,19 100% 772,38 100% 338,80 100%
Source: WIOD and own calculations
11
Table 7: Exports Portugal/China: weight of top 10 sectors-2009
After one year, in 2009, the exports from Portugal to China decreased for another time almost 58%, which were only 643.67 million US$. C14-Electrical and Optical Equipment still ranked in the first place with 164.65 million US$. Comparing to the year of 2008, the rising of sector of c15-Transport Equipment was very significant. The sectors of c7-Pulp, Paper, Printing and Publishing and c2-Mining and Quarrying also increased a lot. And the others sectors only occupied 10% of the total exports. In terms of destination of exports, the intermediate goods were 432.06 million US$ and the final consumption goods were 211.61 million (see Table 7).
Therefore, the financial and economic crisis indeed affected a lot the exports from Portugal to China in 2009.
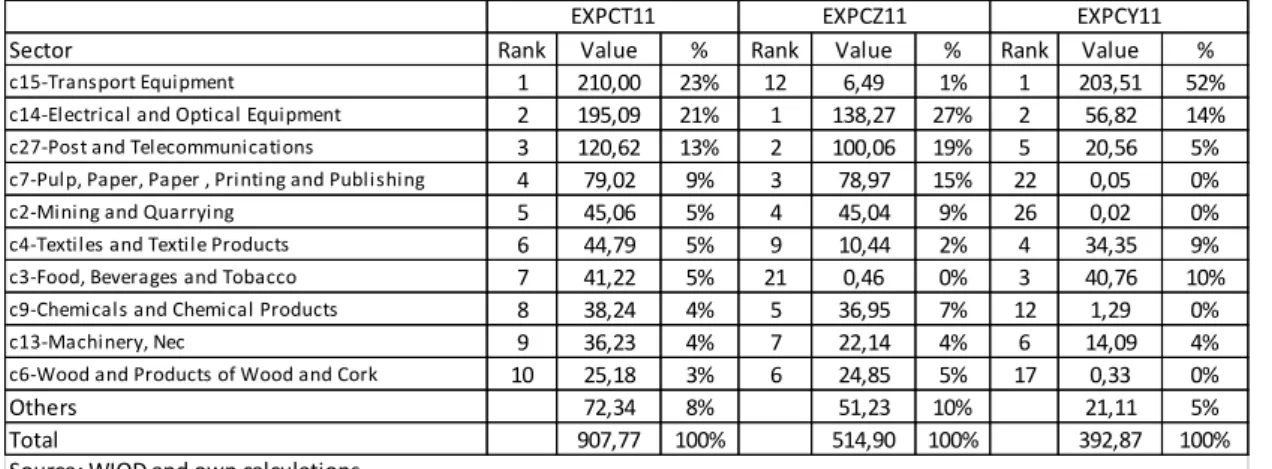
Table 8: Exports Portugal/China: weight of top 10 sectors-2011
Sector Rank Value % Rank Value % Rank Value %
c14-Electrical and Optical Equipment 1 164,65 26% 1 113,50 26% 2 51,15 24%
c27-Post and Telecommunications 2 116,63 18% 2 97,05 22% 4 19,58 9%
c15-Transport Equipment 3 74,65 12% 8 15,20 4% 1 59,45 28%
c7-Pulp, Paper, Paper , Printing and Publishing 4 50,99 8% 3 50,93 12% 22 0,06 0%
c2-Mining and Quarrying 5 41,97 7% 4 41,95 10% 26 0,02 0%
c4-Textiles and Textile Products 6 41,16 6% 11 7,05 2% 3 34,12 16%
c9-Chemicals and Chemical Products 7 31,94 5% 5 31,79 7% 19 0,14 0%
c13-Machinery, Nec 8 29,49 5% 7 15,80 4% 5 13,70 6%
c6-Wood and Products of Wood and Cork 9 16,77 3% 6 16,51 4% 15 0,26 0%
c3-Food, Beverages and Tobacco 10 13,26 2% 26 0,07 0% 6 13,19 6%
Others 62,15 10% 42,21 10% 19,94 9%
Total 643,67 100% 432,06 100% 211,61 100%
Source: WIOD and own calculations
EXPCT09 EXPCZ09 EXPCY09
Sector Rank Value % Rank Value % Rank Value %
c15-Transport Equipment 1 210,00 23% 12 6,49 1% 1 203,51 52%
c14-Electrical and Optical Equipment 2 195,09 21% 1 138,27 27% 2 56,82 14%
c27-Post and Telecommunications 3 120,62 13% 2 100,06 19% 5 20,56 5%
c7-Pulp, Paper, Paper , Printing and Publishing 4 79,02 9% 3 78,97 15% 22 0,05 0%
c2-Mining and Quarrying 5 45,06 5% 4 45,04 9% 26 0,02 0%
c4-Textiles and Textile Products 6 44,79 5% 9 10,44 2% 4 34,35 9%
c3-Food, Beverages and Tobacco 7 41,22 5% 21 0,46 0% 3 40,76 10%
c9-Chemicals and Chemical Products 8 38,24 4% 5 36,95 7% 12 1,29 0%
c13-Machinery, Nec 9 36,23 4% 7 22,14 4% 6 14,09 4%
c6-Wood and Products of Wood and Cork 10 25,18 3% 6 24,85 5% 17 0,33 0%
Others 72,34 8% 51,23 10% 21,11 5%
Total 907,77 100% 514,90 100% 392,87 100%
Source: WIOD and own calculations
12
In 2011 (see Table 8), the exports from Portugal to China recovered and the total amount reached 907.77 million US$. The sector C15-Transport Equipment has surpassed C14-Electrical and Optical Equipment and ranked first with 210.00 million US$. And this almost tripled the value of the year of 2009. C14-Electrical and Optical Equipment ranked second with 195.09 million US$ which was also bigger than in the year of 2009.The other sectors remained around the original level, accounting 8%. Nevertheless, the exports from Portugal to China for final consumption reached 398.87 million, reducing the difference with the exports for domestic production of China (514.90 million US$).
2.2.2 Weight of exports Portugal/China versus Portugal/world in each sector
Firstly, it is declared that the weight in Chapter 2.2.2 is the ratio of the exports from Portugal to China over the exports from Portugal to the world in each sector.
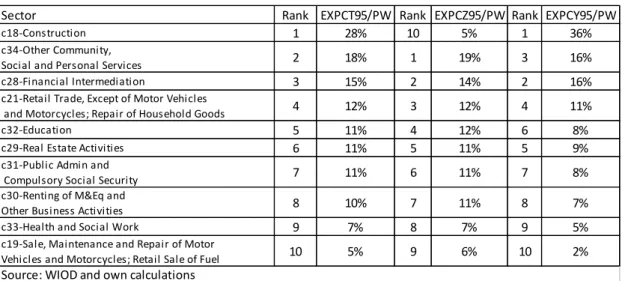
Table 9: Exports Portugal/China versus Portugal/world in each sector-1995
In 1995, the exports of c18-Construction to China accounted the biggest percentage of the exports to the world of this industry, representing 28%. C34-Other community, Social and Personal Service represented 18%. Then came c28-Financial Intermediation with 15%, c21-Retail Trade with 12%, c32-Education with 11%, c29-Real Estate Activities with 11% and c31-Public Admin and Compulsory Social Security with 11%. On the other hand, c18 had more weight in final consumption (36%) than in
Sector Rank EXPCT95/PW Rank EXPCZ95/PW Rank EXPCY95/PW
c18-Construction 1 28% 10 5% 1 36%
c34-Other Community,
Social and Personal Services 2 18% 1 19% 3 16%
c28-Financial Intermediation 3 15% 2 14% 2 16%
c21-Retail Trade, Except of Motor Vehicles
and Motorcycles; Repair of Household Goods 4 12% 3 12% 4 11%
c32-Education 5 11% 4 12% 6 8%
c29-Real Estate Activities 6 11% 5 11% 5 9%
c31-Public Admin and
Compulsory Social Security 7 11% 6 11% 7 8%
c30-Renting of M&Eq and
Other Business Activities 8 10% 7 11% 8 7%
c33-Health and Social Work 9 7% 8 7% 9 5%
c19-Sale, Maintenance and Repair of Motor
Vehicles and Motorcycles; Retail Sale of Fuel 10 5% 9 6% 10 2%
13
intermediate goods (5%). C-28 also had more weight in final consumption (16%) than in intermediate goods (14%). However, all the other sectors had more weight in intermediate goods than final consumption. In summary, the exports to China of construction industry and some other services played an important role in the total exports of each sector in Portugal (see in Table 9).
Table 10: Exports Portugal/China versus Portugal/world in each sector-1999
In Table 10 of the year 1999, the export to China in c18-Construction has already accounted more than a half of the total exports of Portugal to world with a weight of 52%. And as it showed that it has more weight in final consumption (61%) than in intermediate goods (16%). All those implied that the construction industry became a key industry between the two countries. C34-Other community, Social and Personal Services occupied 24% of the total exports, taking the second place. After came c28-Financial Intermediation with 22%. C31-Public Admin and Defense represented 21% and c32-Education 20%. They all increased comparing to the data of the year 1995 (see in Table 9). It meant that the exports to China were more important than in 1995.
Sector Rank EXPCT99/PW Rank EXPCZ99/PW Rank EXPCY99/PW
c18-Construction 1 52% 6 16% 1 61%
c34-Other Community, Social
and Personal Services 2 24% 1 23% 3 24%
c28-Financial Intermediation 3 22% 2 22% 2 24%
c31-Public Admin and Defence;
Compulsory Social Security 4 21% 3 21% 4 19%
c32-Education 5 20% 4 21% 5 16%
c30-Renting of M&Eq and
Other Business Activities 6 19% 5 19% 6 13%
c29-Real Estate Activities 7 13% 7 15% 8 6%
c21-Retail Trade, Except of Motor Vehicles
and Motorcycles; Repair of Household Goods 8 13% 8 14% 7 11%
c33-Health and Social Work 9 9% 9 10% 9 5%
c27-Post and Telecommunications 10 2% 10 2% 12 1%
14
Table 11: Exports Portugal/China versus Portugal/world in each sector-2004
In Table 11 of the year 2004, there were four sectors representing more or less half in the total exports of each sector, which were c31-Public Admin and Defense (55%), c32-Education (52%), c30-Renting of Equipment (50%) and c34-Other Community, Social and Personal Services (48%). These services mentioned were already key sectors of the exports from Portugal to China instead of the c18-Construction (17%). The rise of service sectors was really a big change not only because they exceeded the construction industry but also because they had really big weight in the total exports in each sector.
Table 12: Exports Portugal/China versus Portugal/world in each sector-2008
In Table 12 of the year 2008, c27-Post and Telecommunications occupied 12.89% in the first place. C14-Eletrical and Optical Equipment occupied 4.15% in the second place. There were only four sectors with a weight more than 1% of the total exports of each sector. All the service sectors disappeared from the top 10 list. And
C18-Sector Rank EXPCT04/PW Rank EXPCZ04/PW Rank EXPCY04/PW
c31-Public Admin and Defence;
Compulsory Social Security 1 55% 1 56% 1 49%
c32-Education 2 52% 2 53% 4 44%
c30-Renting of M&Eq and
Other Business Activities 3 50% 3 51% 3 47%
c34-Other Community, Social and Personal Services 4 48% 4 48% 2 49%
c21-Retail Trade, Except of Motor Vehicles
and Motorcycles; Repair of Household Goods 5 36% 5 46% 6 11%
c28-Financial Intermediation 6 26% 6 25% 5 32%
c18-Construction 7 17% 7 24% 7 5%
c29-Real Estate Activities 8 14% 8 17% 8 4%
c19-Sale, Maintenance and Repair of Motor Vehicles
and Motorcycles; Retail Sale of Fuel 9 7% 9 8% 9 4%
c20-Wholesale Trade and Commission Trade,
Except of Motor Vehicles and Motorcycles 10 5% 11 6% 11 3%
Source: WIOD and own calculations
Sector Rank EXPCT08/PW Rank EXPCZ08/PW Rank EXPCY08/PW
c27-Post and Telecommunications 1 12,89% 1 12,83% 1 13,21%
c14-Electrical and Optical Equipment 2 4,15% 2 4,95% 2 2,79%
c6-Wood and Products of Wood and Cork 3 1,19% 5 1,22% 15 0,12%
c9-Chemicals and Chemical Products 4 1,02% 4 1,31% 24 0,02%
c2-Mining and Quarrying 5 0,97% 7 0,98% 10 0,28%
c1-Agriculture, Hunting, Forestry and Fishing 6 0,97% 3 1,98% 17 0,08%
c13-Machinery, Nec 7 0,82% 6 1,02% 5 0,69%
c4-Textiles and Textile Products 8 0,79% 9 0,74% 4 0,80%
c5-Leather, Leather and Footwear 9 0,62% 8 0,91% 6 0,59%
c18-Construction 10 0,39% 10 0,29% 7 0,56%
15
Construction only ranked the 10th place with only 0.39% of the total exports in construction. It showed that China was no longer a very important trade partner like before except in c27-Post and Telecommunications.
Table 13: Exports Portugal/China versus Portugal/world in each sector-2009
In 2009, after the financial crisis, c27-Post and Telecommunications ranked the first place by 10.51% and C2-Mining and Quarrying ranked the second place by 8.44%. Comparing to the year 2008, in terms of weight in total exports of each sector, all sectors grew except c27-Post and Telecommunications. All the top 10 sectors had a weight more than 1% or near 1%. Despite the financial crisis, actually there was a good trend for the exports from Portugal to China. (see Table 13)
Table 14: Exports Portugal/China versus Portugal/world in each sector-2011
Finally, in the last year 2011, as we can see in Table 14, C27-Posted and Telecommunications continued ranking the first place with 10.74% of occupation in
Sector Rank EXPCT09/PW Rank EXPCZ09/PW Rank EXPCY09/PW
c27-Post and Telecommunications 1 10,51% 1 10,45% 1 10,83%
c2-Mining and Quarrying 2 8,44% 2 8,49% 10 0,49%
c14-Electrical and Optical Equipment 3 4,09% 3 4,62% 2 3,27%
c15-Transport Equipment 4 1,48% 11 0,62% 3 2,32%
c7-Pulp, Paper, Paper , Printing and Publishing 5 1,36% 7 1,40% 21 0,05%
c9-Chemicals and Chemical Products 6 1,34% 6 1,87% 25 0,02%
c6-Wood and Products of Wood and Cork 7 1,22% 10 1,24% 6 0,68%
c13-Machinery, Nec 8 1,19% 5 1,91% 5 0,83%
c4-Textiles and Textile Products 9 0,99% 9 1,25% 4 0,95%
c1-Agriculture, Hunting, Forestry and Fishing 10 0,95% 4 2,35% 19 0,08% Source: WIOD and own calculations
Sector Rank EXPCT11/PW Rank EXPCZ11/PW Rank EXPCY11/PW
c27-Post and Telecommunications 1 10,74% 1 10,64% 1 11,25%
c2-Mining and Quarrying 2 8,95% 2 9,00% 12 0,52%
c14-Electrical and Optical Equipment 3 4,79% 3 5,37% 3 3,80%
c15-Transport Equipment 4 4,12% 15 0,31% 2 6,83%
c7-Pulp, Paper, Paper , Printing and Publishing 5 2,08% 6 2,17% 26 0,03%
c6-Wood and Products of Wood and Cork 6 1,81% 9 1,83% 8 0,87%
c9-Chemicals and Chemical Products 7 1,59% 7 1,97% 18 0,24%
c13-Machinery, Nec 8 1,44% 5 2,40% 7 0,89%
c4-Textiles and Textile Products 9 1,06% 10 1,16% 6 1,04%
c3-Food, Beverages and Tobacco 10 1,05% 19 0,19% 4 1,10% Source: WIOD and own calculations
16
the total exports of this sector. Comparing to the year 2009, the top 10 sectors didn’t changed a lot. But it is to be noted that the weight of c15-Transport Equipment rose from 1.48% in 2009 to 4.12% in 2011.
2.2.3 Gross exports from China to Portugal
Table 15: Exports China/Portugal: weight of top 10 sectors -1995
In terms of gross value, in the first year, 1995, c14-Electrical and Optical Equipment ranked first (34.23 million US$), following by c22-Hotels and Restaurants (28.15 million US$) and C4-Texitles and Textile Products (27.37 million US$). All the top 10 sectors had a weight of 82%. And the total exports from China to Portugal were 197.37 million US$. Considering the destination, we can find that the exports for final consumption (103.42 million) were bigger than the exports for domestic production (93.97 million US$). (see Table 15)
Sector Rank Value % Rank Value % Rank Value %
c14-Electrical and Optical Equipment 1 34,23 17% 2 11,50 12% 1 22,73 22%
c22-Hotels and Restaurants 2 28,15 14% 1 20,06 21% 4 8,09 8%
c4-Textiles and Textile Products 3 27,37 14% 5 9,12 10% 2 18,26 18%
c12-Basic Metals and Fabricated Metal 4 18,81 10% 4 10,03 11% 3 8,79 8%
c27-Post and Telecommunications 5 12,77 6% 3 10,66 11% 11 2,11 2%
c1-Agriculture, Hunting, Forestry and Fishing 6 10,53 5% 7 3,90 4% 6 6,63 6%
c10-Rubber and Plastics 7 9,79 5% 6 4,91 5% 7 4,88 5%
c5-Leather, Leather and Footwear 8 9,22 5% 16 1,18 1% 5 8,04 8%
c13-Machinery, Nec 9 5,86 3% 15 1,41 1% 9 4,45 4%
c34-Other Community, Social and Personal Services 10 5,83 3% 8 3,89 4% 13 1,94 2%
Others 34,83 18% 17,33 18% 17,50 17%
Total 197,39 100% 93,97 100% 103,42 100%
Source: WIOD and own calculations
17
Table 16: Exports China/Portugal: weight of top 10 sectors -1999
In 1999, c14-Electrical and Optical Equipment still ranked first (44.62 million US$). The second was c4-Textiles and Textile Products (33.59 million US$) and the third was c20-Wholesale Trade (33.52 million US$). The top 10 sectors had a weight of 80% of the total exports from China to Portugal. The total exports grew to 274.48 million US$ instead of 197.39 million US$ in the year 1995. Nevertheless, the exports for domestic production (156.33 million US$) exceeded the exports for final consumption (118.15 million US$). (see Table 16)
Table 17: Exports China/Portugal: weight of top 10 sectors -2004
In Table 17 for the year 2004, it was a big surprise that c30-Renting of M&Eq and Other Business Activities became the first industry (199.27 million US$) in the exports from China to Portugal. However, it was only 15.82 million US$ in the year of 1999.
Sector Rank Value % Rank Value % Rank Value %
c14-Electrical and Optical Equipment 1 44,62 16% 2 21,65 14% 1 22,97 19%
c4-Textiles and Textile Products 2 33,59 12% 5 14,28 9% 2 19,31 16%
c20-Wholesale Trade and Commission Trade,
Except of Motor Vehicles and Motorcycles 3 33,52 12% 1 28,94 19% 12 4,57 4% c22-Hotels and Restaurants 4 20,43 7% 4 14,54 9% 6 5,88 5%
c10-Rubber and Plastics 5 18,73 7% 7 10,34 7% 4 8,40 7%
c12-Basic Metals and Fabricated Metal 6 15,87 6% 6 10,35 7% 7 5,53 5%
c30-Renting of M&Eq and Other Business Activities 7 15,82 6% 3 14,66 9% 16 1,16 1%
c9-Chemicals and Chemical Products 8 13,40 5% 8 10,13 6% 13 3,27 3%
c27-Post and Telecommunications 9 11,95 4% 9 9,96 6% 15 1,99 2%
c13-Machinery, Nec 10 11,38 4% 15 1,42 1% 3 9,95 8%
Others 55,18 20% 20,05 13% 35,13 30%
Total 274,48 100% 156,33 100% 118,15 100%
Source: WIOD and own calculations
EXCPT99 EXCPZ99 EXCPY99
Sector Rank Value % Rank Value % Rank Value %
c30-Renting of M&Eq and Other Business Activities 1 199,27 29% 1 184,65 40% 5 14,62 6%
c14-Electrical and Optical Equipment 2 114,86 17% 2 59,73 13% 1 55,12 24%
c4-Textiles and Textile Products 3 71,41 10% 3 37,08 8% 2 34,34 15%
c34-Other Community, Social and Personal Services 4 48,10 7% 5 31,51 7% 4 16,58 7%
c9-Chemicals and Chemical Products 5 41,49 6% 4 36,12 8% 12 5,36 2%
c13-Machinery, Nec 6 39,04 6% 12 4,84 1% 3 34,20 15%
c27-Post and Telecommunications 7 35,49 5% 6 29,59 6% 11 5,91 3%
c12-Basic Metals and Fabricated Metal 8 33,13 5% 7 26,46 6% 10 6,67 3%
c10-Rubber and Plastics 9 24,39 4% 8 15,27 3% 9 9,12 4%
c1-Agriculture, Hunting, Forestry and Fishing 10 12,47 2% 9 8,82 2% 13 3,65 2%
Others 75,90 11% 32,55 7% 43,35 19%
Total 695,56 100% 466,63 100% 228,92 100%
EXCPT04 EXCPZ04 EXCPY04
18
And it was followed by c14-Electrical and Optical Equipment (114.86 million US$) and c4-Textiles and Textile Products (71.41 million US$). The other sectors continued growing. The top 10 sectors had a weight of 89% in the total exports from Portugal to China. The total exports were twice bigger than the total exports in 1999 (see in Table 16). What’s more, the exports for domestic production (466.63 million US$) were much bigger than the ones for final consumption (228.92 million US$).
Table 18: Exports China/Portugal: weight of top 10 sectors -2008
In 2008, c14-Electrical and Optical Equipment (582.70 million US$) took the first place for another time. And the second was c12-Basic Metals and Fabricated Metal (205.11 million US$). The third was c14-Textiles and Textile Products (172.31 million US$). The top 10 sectors had a weight of 87% of the total exports from China to Portugal. Considering the value of total exports, it was a big jump. It was 695.56 million US$ in 2004, but it already reached 1753.88 million US$ in 2008. Moreover, the difference between the exports for domestic production and final consumption was smaller than before. The exports for domestic production were 945.28 million US$ and the exports for final consumption were 808.60 million US$. (see Table 18)
Sector Rank Value % Rank Value % Rank Value %
c14-Electrical and Optical Equipment 1 582,70 33% 1 285,82 30% 1 296,88 37%
c12-Basic Metals and Fabricated Metal 2 205,11 12% 2 190,76 20% 10 14,34 2%
c4-Textiles and Textile Products 3 172,31 10% 4 77,66 8% 3 94,65 12%
c13-Machinery, Nec 4 129,35 7% 6 34,05 4% 2 95,30 12%
c9-Chemicals and Chemical Products 5 122,19 7% 3 109,50 12% 11 12,70 2%
c15-Transport Equipment 6 105,54 6% 10 21,01 2% 4 84,53 10%
c3-Food, Beverages and Tobacco 7 65,00 4% 25 1,49 0% 5 63,51 8%
c10-Rubber and Plastics 8 51,82 3% 5 34,89 4% 8 16,93 2%
c34-Other Community, Social and Personal Services 9 49,08 3% 8 32,55 3% 9 16,53 2%
c5-Leather, Leather and Footwear 10 41,27 2% 21 2,69 0% 6 38,58 5%
Others 229,52 13% 154,87 16% 74,65 9%
Total 1753,88 100% 945,28 100% 808,60 100%
Source: WIOD and own calculations
19
Table 19: Exports China/Portugal: weight of top 10 sectors -2009
In Table 19 of the year 2009, c14-Electrical and Optical Equipment occupied 32% of the total exports from China to Portugal, with the value of 459.45 million US$, ranking the first place. Then it came c4-Textiles and Textile Products (172.74 million US$), ranking the second place and c13-Machinery (104.96 million US$), ranking the third place. After the financial crisis in 2008, all sectors decreased a little comparing to the last year. The total exports decreased from 1753.88 million US$ in 2008 to 1449.29 million US$ in 2009. And the difference between the exports for domestic production and for final consumption remained small.
Table 20: Exports China/Portugal: weight of top 10 sectors -2011
In 2011, c14-Electrical and Optical Equipment (529.25 million US$) still remained in the first place. And the second place was c15-Transporte Equipment (254.36 million
Sector Rank Value % Rank Value % Rank Value %
c14-Electrical and Optical Equipment 1 459,45 32% 1 255,61 34% 1 203,84 30%
c4-Textiles and Textile Products 2 172,74 12% 3 69,06 9% 2 103,68 15%
c13-Machinery, Nec 3 104,96 7% 9 24,86 3% 3 80,10 12%
c9-Chemicals and Chemical Products 4 87,90 6% 2 77,37 10% 11 10,52 2%
c3-Food, Beverages and Tobacco 5 80,76 6% 26 0,97 0% 4 79,79 12%
c12-Basic Metals and Fabricated Metal 6 76,13 5% 4 62,45 8% 10 13,68 2%
c15-Transport Equipment 7 64,21 4% 14 13,92 2% 5 50,29 7%
c27-Post and Telecommunications 8 55,61 4% 5 46,40 6% 12 9,22 1%
c10-Rubber and Plastics 9 47,76 3% 7 30,30 4% 8 17,46 3%
c34-Other Community, Social and Personal Services 10 43,19 3% 8 28,66 4% 9 14,54 2%
Others 256,57 18% 151,27 20% 105,30 15%
Total 1449,29 100% 760,86 100% 688,43 100%
Source: WIOD and own calculations
EXCPT09 EXCPZ09 EXCPY09
Sector Rank Value % Rank Value % Rank Value %
c14-Electrical and Optical Equipment 1 529,25 25% 1 246,64 24% 1 282,61 27%
c15-Transport Equipment 2 254,36 12% 6 53,12 5% 2 201,24 19%
c4-Textiles and Textile Products 3 195,95 9% 5 82,29 8% 5 113,67 11%
c13-Machinery, Nec 4 160,15 8% 8 45,01 4% 4 115,13 11%
c9-Chemicals and Chemical Products 5 159,59 8% 2 138,35 13% 8 21,25 2%
c12-Basic Metals and Fabricated Metal 6 121,44 6% 3 108,86 10% 12 12,58 1%
c3-Food, Beverages and Tobacco 7 120,00 6% 24 1,70 0% 3 118,30 11%
c20-Wholesale Trade and Commission Trade,
Except of Motor Vehicles and Motorcycles 8 106,18 5% 4 91,65 9% 11 14,53 1% c10-Rubber and Plastics 9 64,50 3% 9 41,02 4% 7 23,49 2%
c27-Post and Telecommunications 10 62,07 3% 7 51,73 5% 14 10,34 1%
Others 309,43 15% 177,08 17% 132,35 13%
Total 2082,94 100% 1037,44 100% 1045,49 100%
Source: WIOD and own calculations
20
US$). The third place was c4-Textiles and Textile Products (195.95 million US$). The top 10 industries occupied 85% of the total exports from China to Portugal. And it was obvious that the exports have recovered from the financial crisis with the total amount of 2082.94 million US$. In terms of the destination of exports, the exports for final consumption (1045.49 million US) overpassed the ones for domestic production (1037.44 million US$). (see Table 20)
2.2.4 Weight of exports China/Portugal versus China/world in each sector
Table 21: Exports China/Portugal versus China/world in each sector -1995
In 1995, in terms of weight in the total exports of certain sector, c27-Post and Telecommunications ranked the first place, which was 1.61%. The weights of others sectors were all under 1%. It meant that there was not an important sector in the exports from China to Portugal. (see Table 21)
Table 22: Exports China/Portugal versus China/world in each sector -1999
Sector Rank EXCPT95/CW Rank EXCPZ95/CW Rank EXCPY95/CW
c27-Post and Telecommunications 1 1,61% 1 1,61% 1 1,63%
c22-Hotels and Restaurants 2 0,76% 2 0,92% 2 0,52%
c17-Electricity, Gas and Water Supply 3 0,55% 3 0,60% 3 0,45%
c30-Renting of M&Eq and Other Business Activities 4 0,38% 4 0,38% 4 0,38%
c34-Other Community, Social and Personal Services 5 0,17% 5 0,16% 8 0,19%
c1-Agriculture, Hunting, Forestry and Fishing 6 0,16% 12 0,10% 5 0,24%
c10-Rubber and Plastics 7 0,14% 7 0,12% 9 0,17%
c12-Basic Metals and Fabricated Metal 8 0,14% 11 0,11% 6 0,21%
c28-Financial Intermediation 9 0,13% 8 0,12% 10 0,13%
c11-Other Non-Metallic Mineral 10 0,12% 21 0,04% 7 0,21% Source: WIOD and own calculations
Sector Rank EXCPT99/CW Rank EXCPZ99/CW Rank EXCPY99/CW
c27-Post and Telecommunications 1 1,10% 1 0,99% 3 2,64%
c22-Hotels and Restaurants 2 0,85% 2 0,75% 5 1,30%
c17-Electricity, Gas and Water Supply 3 0,70% 3 0,61% 4 1,42%
c13-Machinery, Nec 4 0,38% 16 0,07% 8 1,17%
c1-Agriculture, Hunting, Forestry and Fishing 5 0,33% 8 0,15% 2 4,03%
c10-Rubber and Plastics 6 0,31% 6 0,20% 9 1,11%
c3-Food, Beverages and Tobacco 7 0,31% 24 0,03% 19 0,56%
c30-Renting of M&Eq and Other Business Activities 8 0,30% 4 0,28% 1 9,77%
c20-Wholesale Trade and Commission Trade,
Except of Motor Vehicles and Motorcycles 9 0,30% 5 0,26% 7 1,18% c16-Manufacturing, Nec; Recycling 10 0,27% 22 0,03% 17 0,66% Source: WIOD and own calculations
21
In Table 22 of the year 1999, comparing to the year 1995, it didn’t change a lot. The first place was also c27-Post and Telecommunications. The second place was c22-Hotel and Restaurants. All the top 10 sectors had a weight less than 1% except c27 with 1.10%.
Table 23: Exports China/Portugal versus China/world in each sector -2004
In 2004, c30 turned to be the first place with 1.02% of occupation. And c27-Post and Telecommunications became the second place with 1.00%. All the others had a weight less than 1%. From the 4th to the 10th, the weight was even less than 0.2% in the total exports of China in each sector. It is noted that c3-Food and Beverages and Tabaco was not in the top 10 anymore (see in Table 23).
Table 24: Exports China/Portugal versus China/world in each sector -2008
In Table 24 of the year 2008, c33-Health and Social Work, which never was in the list, became the first with 1.46%. The second was c34-Other Community, Social and
Sector Rank EXCPT04/CW Rank EXCPZ04/CW Rank EXCPY04/CW
c30-Renting of M&Eq and Other Business Activities 1 1,02% 1 1,02% 1 1,04%
c27-Post and Telecommunications 2 1,00% 2 1,00% 2 1,01%
c34-Other Community, Social and Personal Services 3 0,44% 3 0,46% 3 0,42%
c28-Financial Intermediation 4 0,19% 5 0,19% 4 0,21%
c1-Agriculture, Hunting, Forestry and Fishing 5 0,19% 4 0,24% 8 0,13%
c9-Chemicals and Chemical Products 6 0,15% 6 0,18% 13 0,07%
c6-Wood and Products of Wood and Cork 7 0,15% 7 0,18% 15 0,07%
c22-Hotels and Restaurants 8 0,14% 9 0,14% 6 0,14%
c10-Rubber and Plastics 9 0,13% 10 0,13% 7 0,13%
c13-Machinery, Nec 10 0,12% 15 0,05% 5 0,15%
Source: WIOD and own calculations
Sector Rank EXCPT08/CW Rank EXCPZ08/CW Rank EXCPY08/CW
c33-Health and Social Work 1 1,46% 1 1,46% 1 1,46%
c34-Other Community, Social and Personal Services 2 0,48% 3 0,46% 2 0,53%
c27-Post and Telecommunications 3 0,46% 2 0,46% 3 0,47%
c1-Agriculture, Hunting, Forestry and Fishing 4 0,25% 4 0,27% 5 0,22%
c3-Food, Beverages and Tobacco 5 0,19% 24 0,03% 6 0,22%
c6-Wood and Products of Wood and Cork 6 0,19% 5 0,22% 15 0,10%
c22-Hotels and Restaurants 7 0,18% 6 0,20% 8 0,15%
c12-Basic Metals and Fabricated Metal 8 0,17% 7 0,18% 17 0,09%
c11-Other Non-Metallic Mineral 9 0,16% 10 0,16% 7 0,17%
c17-Electricity, Gas and Water Supply 10 0,16% 8 0,17% 11 0,12% Source: WIOD and own calculations
22
Personal Services (0.48%). C27- Post and Telecommunications (0.46%) took the third place.
Table 25: Exports China/Portugal versus China/world in each sector -2009
In 2009, c33-Healt and Social Work still occupied the first place, but the percentage dropped to 1.17%. And c27-Post and Telecommunication (0.79%), which was in the third place last year, became the second. C34-Other Community, Social and Personal Services (0.51%) nearly kept the same as to the occupation of the last year. (see Table 25)
Table 26: Exports China/Portugal versus China/world in each sector -2011
In 2011 (Table 26), C9-Chemical and Chemical Products became the first with only 0.11%. The second place was c25-Air Transport (0.09%). 2011 was a year when a big decrease happened in the weight of the total exports in each sector. Because all the top 10 sectors had a weight near 0.10% or less than 0.10% which was really low.
Sector Rank EXCPT09/CW Rank EXCPZ09/CW Rank EXCPY09/CW
c33-Health and Social Work 1 1,17% 1 1,17% 1 1,17%
c27-Post and Telecommunications 2 0,79% 2 0,79% 2 0,79%
c34-Other Community, Social and Personal Services 3 0,51% 3 0,49% 3 0,55%
c22-Hotels and Restaurants 4 0,25% 4 0,38% 10 0,14%
c3-Food, Beverages and Tobacco 5 0,25% 25 0,02% 4 0,29%
c1-Agriculture, Hunting, Forestry and Fishing 6 0,19% 5 0,30% 14 0,10%
c28-Financial Intermediation 7 0,18% 7 0,18% 6 0,19%
c17-Electricity, Gas and Water Supply 8 0,18% 6 0,19% 7 0,16%
c26-Other Supporting and Auxiliary Transport
Activities; Activities of Travel Agencies 9 0,14% 11 0,15% 9 0,14% c6-Wood and Products of Wood and Cork 10 0,14% 8 0,16% 16 0,10% Source: WIOD and own calculations
Sector Rank EXCPT11/CW Rank EXCPZ11/CW Rank EXCPY11/CW
c9-Chemicals and Chemical Products 1 0,11% 7 0,15% 8 0,04%
c25-Air Transport 2 0,09% 14 0,10% 2 0,07%
c10-Rubber and Plastics 3 0,07% 15 0,08% 3 0,06%
c12-Basic Metals and Fabricated Metal 4 0,07% 13 0,10% 15 0,02%
c15-Transport Equipment 5 0,06% 12 0,10% 4 0,06%
c11-Other Non-Metallic Mineral 6 0,06% 19 0,06% 1 0,07%
c4-Textiles and Textile Products 7 0,05% 11 0,10% 7 0,04%
c14-Electrical and Optical Equipment 8 0,05% 18 0,07% 6 0,04%
c6-Wood and Products of Wood and Cork 9 0,05% 17 0,08% 14 0,02%
c27-Post and Telecommunications 10 0,05% 1 0,55% 18 0,01% Source: WIOD and own calculations
23
3. Trade in value added and vertical specialization between Portugal and China 3.1 Theoretical and methodological framework
Since the 30s in the 20th century, input-output analysis has been used to study the economy in a sectoral perspective, by W. Leontief. He applied the IO model in US economy (Leontief, 1951) and later received the Nobel Prize because of his pioneering work, in 1973. In his theory, several coefficients are introduced, i.e., technological coefficient, import coefficient, etc. Since this paper is about imports and exports, we focus more in the import coefficient. Instead of calculate the coefficient in each sector, we do it in the total value but distinguish the origin of imports, namely, two certain countries Portugal and China or the rest of world, that are:
Import coefficient of Portugal =
∑𝑛𝑗=1𝑖𝑚𝑊𝑃𝑗
∑𝑛𝑗=1𝑥𝑃𝑗 = A
(1)
Where im𝑾𝑷𝒋 means the imports from the rest of the world of sector j of Portugal and
x𝑷𝒋 means the production of Portugal of sector j.
Import coefficient of Portugal from China =
∑𝑛𝑗=1𝑖𝑚𝐶𝑃𝑗
∑𝑛𝑗=1𝑥𝑃𝑗 = B
(2)
Where im𝑪𝑷𝒋 means the imports from China of sector j of Portugal and x𝑷𝒋 means the production of Portugal of sector j.
Import coefficient of China =
∑𝑛𝑗=1𝑖𝑚𝑊𝐶𝑗
∑𝑛𝑗=1𝑥𝐶𝑗 = C
(3)
Where im𝑾𝑪𝒋 means the imports from the rest of the world of sector j of China and
x𝑪𝒋 means the production of China of sector j.
Import coefficient of China from Portugal =
∑𝑛𝑗=1𝑖𝑚𝑃𝐶𝑗
24
Where im𝑷𝑪𝒋 means the imports from Portugal of sector j of China and x𝑪𝒋 means the
production of China of sector j.
All these four coefficients (equation 1, 2, 3 and 4) together can show us the direct foreign content of domestic production of Portugal and China.
And furthermore, one of the significant economic trends of the last decades is the strong growth of international trade flows (Amador et al., 2008). Globalization has been associated with the development of a new organizational paradigm of international production (Daudin et al., 2011). The production is divided in several countries and from there it came the concept of global value chains (GVC). To check out what is the positon of a country, vertical specialization (VS) was introduced in Hummels et al. (1998) and latterly perfected in Hummels et al. (2001). It can be written as:
𝑉𝑆
𝑘𝑗=
𝑖𝑚𝑝𝑜𝑟𝑡𝑒𝑑 𝑖𝑛𝑝𝑢𝑡𝑠𝑜𝑢𝑡𝑝𝑢𝑡* exports = ∑
(
𝑀𝑖𝑗 𝑋𝑗 𝑌𝑗
)
𝑛𝑖=1
= ∑
𝑛𝑖=1𝑎
𝑖𝑗𝑀𝑋
𝑗 (5) Where k means the country and i, j = 1, 2,..., n. 𝑀𝑖𝑗 is the value of imported intermediate product i in sector j, 𝑋𝑗 is the value of exports of sector j, 𝑌𝑗 is the total output of sector j, 𝑎𝑖𝑗𝑀 is the import coefficient.Consequently, the vertical specialization of the country k is the sum of the 𝑉𝑆𝑘𝑖 in all 𝑠𝑒𝑐𝑡𝑜𝑟𝑠 𝐼, 𝑡ℎ𝑎𝑡 𝑖𝑠:
𝑉𝑆
𝑘= ∑
𝑛𝑖=1𝑉𝑆
𝑘𝑖 (6)In order to facilitate the calculation and analysis, it is necessary to calculate the weight of 𝑉𝑆𝑘 in total exports of country k, presented in:
𝑉𝑆𝑘 𝑋𝑘
=
∑𝑛𝑖=1𝑉𝑆𝑘𝑖
∑𝑛𝑖=1𝑋𝑘𝑖 (7)
According to Hummels et al. (2001), if we introduce the input-output matrices and the import coefficient, then we have the equation below:
𝑉𝑆𝑋𝑘
𝑘
=
𝒖𝑨𝑴𝑿
25
Where u is a 1×n vector. 𝑨𝑴 is a n×n matrix, representing the direct imports, in which
every element is 𝒂𝒊𝒋𝑴. And X is a n×1 vector representing the exports.
In this measurement, only the directly imported intermediate inputs for production are considered, so it is called the direct vertical specialization (DVS) of country k. And this measurement will be used in the section 3.2.2.
Back to the famous economist Leontief, his biggest contribution is the Leontief inverse which combines both direct and indirect inputs. In this case, if we apply the Leontief inverse to the Equation (8), both the direct and indirect inputs can be calculated, that is:
𝑉𝑆𝑘 𝑋𝑘
=
𝒖𝑨𝑴[𝑰− 𝑨𝑫]−𝟏𝑿
𝑋𝑘
(9)
Where [𝑰 − 𝑨𝑫]−𝟏 is the Leontief inverse, I is a n×n matrix, 𝑨𝑫 is the n×n (domestic)
technological coefficient matrix.
This measurement including both direct and indirect inputs is called total vertical specialization (TVS) which will be applied in section 3.2.3.
For an application of this methodology to the Portuguese Rubber and Plastics Industry, see Lopes and Santos (2015).
3.2 Empirical results
3.2.1 Direct foreign content of domestic production
Table 27: Direct foreign content of domestic production of Portugal
In Table 27, the direct foreign content of domestic production of Portugal maintained almost the same level from 1995 to 2011. It started with 10.4005% in 1995, ended with 10.3435% in 2011 and reached the peak in 2008 with 12.7873%. On the other hand, the direct China’s content of Portugal had a significant increase from 0.0439% in 1995 to
Index 1995 1999 2004 2008 2009 2011
A 10,4005% 10,5312% 10,8599% 12,7873% 10,1125% 10,3435% B 0,0439% 0,0694% 0,1410% 0,2011% 0,1752% 0,2360% Source: WIOD and own calculations
26
0.236% in 2011. It only decreased in 2009 because of the great recession. It means that the imported input from China was increasing in exports of Portugal. (see A and B in Equation (1), (2)).
Table 28: Direct foreign content of domestic production of China
In Table 28 (see C and D in Equation (3), (4)), as we can see, the direct foreign content of China increased and reached the peak in 2004, and later started to decrease.In a total view, it expanded from 5.2477% in 1995 to 6.6300% in 2011.
The same thing happened to the direct Portugal’s content of China, but the decrease after 2004 was much more dramatic. (I suspect that the dramatic decline was because of the possible error of the original data from WIOD, please check my explanation in chapter 4)
3.2.2 Direct foreign content of exports
From Table 29 to Table 30, DVSpW means the Portuguese direct vertical specialization (with imports from the world) of exports to the world; DVSpC means the Portuguese direct vertical specialization (with imports from the world) of exports to China;
DVScpW means the Portuguese direct vertical specialization (with imports from China)
of exports to the world; DVScpC means the Portuguese direct vertical specialization (with imports from China) of exports to China.
DVScW means the Chinese direct vertical specialization (with imports from the world)
of exports to the world; DVScP means the Chinese direct vertical specialization (with imports from the world) of exports to Portugal; DVSpcW means the Chinese direct vertical specialization (with imports from Portugal) of exports to the world; DVSpcP means the Chinese direct vertical specialization (with imports from Portugal) of exports to Portugal.
Index 1995 1999 2004 2008 2009 2011
C 5,2477% 4,5707% 8,4962% 6,8906% 5,5314% 6,6300% D 0,0119% 0,0135% 0,0269% 0,0035% 0,0029% 0,0023% Source: WIOD and own calculations
27
Table 29: Direct foreign content of exports of Portugal
From Table 29, DVSpW increased from 1995 to 2008, but after the great recession it dropped until 18.9304% in 2011, which was almost in the same level of 1995 (19.1795%). In another word, the Portuguese direct vertical specialization (with imports from the world) of exports to the world came back to its original point after 17 years.
DVSpC also increased from 1995 to 2008, and decreased after the year 2008. But in
2011, the final year of this investigation, it (20.9106%) was more than twice of the initial value in 1995 (9.7424%). That means that exports from Portugal to China depended more and more on imported inputs. The biggest increase was in the year 2008 with 26.5176%. Before that, it was just 9.1303% in 2004.
Looking at DVScpW, it showed that the contribution of imports from China grew almost eight times in exports from Portugal to the world. The initial index was 0.0627%, and it ended with 0.4784%. This increase was very significant.
Finally, what we can see from DVScpC was a dramatic growth. In 17 years, it expanded from 0.0585% in 1995 to 0.6854% in 2011, which also can be considered to be a very big increase. And it was even bigger than DVScpW in 2011. This implies that the exports from Portugal to China had more imported input from China than the exports from Portugal to the world.
Index 1995 1999 2004 2008 2009 2011
DVSpW 19,1795% 20,1508% 21,7974% 24,1439% 18,6103% 18,9304% DVSpC 9,7424% 8,3326% 9,1303% 26,5176% 19,8069% 20,9106% DVScpW 0,0627% 0,1217% 0,2062% 0,4581% 0,3411% 0,4784% DVScpC 0,0585% 0,0705% 0,2526% 0,9642% 0,6365% 0,6854% Source: WIOD and own calculations
28
Table 30: Direct foreign content of exports of China
In Table 30, DVScW started to increase from 1995 to 2004, and after that it decreased and ended with 5.3448% in 2011, which was quite lower than the initial value (7.8192%). It showed that exports of China depended less on imports form the world. As to DVScP the evolution was almost the same, it grew from 1995 to 2004 and fell from 2004 to 2011. But in a longer view, as we can see, it still grew a little comparing the first year (7.0015%) and the last year (7.9503%). That means the exports from China to Portugal depended more on imported inputs.
DVSpcW and DVSpcP both increased from 1995 to 2004 and dropped a lot after. That
means that the imported inputs from Portugal became more and more unimportant in exports of China. (Again, I suspect that the dramatic decline after 2004 was because of the possible error of the original data from WIOD, please check my explanation in chapter 4).
It is also very important to note that the peak of increase of direct foreign content of exports of Portugal was in 2008, but the peak of China was in 2004. It is very clear that the reversion of Portugal in 2008 was because of the great recession. But the reversion of China in 2004 means that maybe there was a great transformation in China between 2004 and 2008. And “made in China” became more and more really “made in China”.
3.2.3 Total foreign content of exports
In Table 31, VST-PW means the total vertical specialization of exports from Portugal to the world; VST-PC means the total vertical specialization of exports from Portugal to China; VST-CW means the total vertical specialization of exports from China to the world; VST-CP means the total vertical specialization of exports from China to Portugal. Index 1995 1999 2004 2008 2009 2011 DVScW 7,8192% 6,7039% 13,4996% 9,6829% 7,8933% 5,3448% DVScP 7,0015% 6,1429% 11,3714% 9,7455% 7,4091% 7,9503% DVSpcW 0,0112% 0,0139% 0,0277% 0,0066% 0,0041% 0,0023% DVSpcP 0,0127% 0,0144% 0,0361% 0,0064% 0,0038% 0,0027% Source: WIOD and own calculations
29 Table 31: The total foreign content of exports
According to Table 31, from 1995 to 2011, VST-PW remained almost the same level. While VST-PC increased a lot during these years and there was a big jump in the year 2008. On the other hand, VST-CW reached top in 2006 and later decreased a little in the next few years. And as to VST-CP, it also reached the top in 2006 and then began to drop.
During the 17 years, the total foreign content of exports from Portugal to the world did not change a lot and remained just the same level. But the total foreign content of exports from Portugal to China almost doubled itself which was an extraordinary growth. In terms of the foreign content of exports from China to the world, it also increased and reached the peak in 2006. And the same thing happened to the total foreign content of exports from China to Portugal.
If we look at the medium value, VST-PW, VST-PC and VST-CP were almost the same but VST-CW was smaller than the others.
So in average, the total foreign content of exports from Portugal to the world, the one from Portugal to China and the one from China to Portugal were just the same with the value around 18%. But the total foreign content of exports from China to the world was smaller with only nearly 15%.
Year VST-PW VST-PC VST-CW VST-CP 1995 17,7577% 15,8734% 12,8292% 15,5760% 1996 17,6975% 14,8986% 11,5583% 14,3218% 1997 18,2969% 14,5779% 11,9999% 10,7911% 1998 18,1339% 14,4540% 10,4712% 13,5180% 1999 17,7584% 14,0687% 11,5685% 14,1754% 2000 19,6310% 16,1906% 14,0594% 17,8130% 2001 18,9816% 15,7819% 13,3362% 16,4810% 2002 18,2550% 15,0119% 14,3829% 18,1723% 2003 17,6975% 14,8756% 17,0845% 20,7822% 2004 18,4828% 15,2422% 20,0562% 24,1280% 2005 19,4340% 18,6735% 20,4901% 23,6469% 2006 20,3141% 16,8295% 20,8856% 24,8015% 2007 20,1494% 17,2632% 20,4213% 24,4451% 2008 21,3726% 36,5307% 19,2912% 25,2205% 2009 17,8698% 30,3753% 16,0849% 20,1114% 2010 17,8782% 31,8110% 18,1294% 21,9558% 2011 18,1237% 31,8393% 19,0311% 22,6840% Medium 18,7888% 18,0431% 15,6346% 18,9323%
30 Figure 3: The total foreign content of exports
Source: WIOD and won calculations
According to the Figure 3, VST-PC (red) is really attractive, because it grew a lot and became the biggest in all the four indexes. PW (blue) remained the same.
VST-CW and VST-CP grew and reached the top in around 2006 and then decreased. But VST-CP was almost always bigger than VST-CW.
As we can see, in terms of exports to the world, the total vertical specialization of Portugal and China were in the same level in the final years. They were both between 15% and 20%. Therefore, in certain meaning, Portugal and China were in the same positon. But we also need to see what part of the global value chains that two countries participated. Because profits can be very different if the participation in global value chains are in different sectors as in different phase of production.
On the other hand, in terms of exports between two countries, the total vertical specialization of Portugal was much bigger than the one of China in the final years. It implies that the exports from Portugal to China had more participation in the global value chains.
In addition, the vertical specifications of exports between the two countries were bigger than the one to the world. For example, in 2011, the red and purple were bigger than blue and green.
0% 5% 10% 15% 20% 25% 30% 35% 40% 1995 1996 1997 1998 1999 2000 2001 2002 2003 2004 2005 2006 2007 2008 2009 2010 2011
The total foreign content of exports
31
4. Explanation of the possible error of the original data from WIOT
Table 32: The exports of Portugal to China in 7 services (million US$)
After all the calculations, I found that there are some strange results that I have made. If you look at Table 6, Table 7 and Table 8, you may wonder why the exports from Portugal to China dropped such a lot. And the data is very different from the data from COMTRADE (see Table 1). Another thing is that the Portuguese content of exports of China decreased dramatically after 2008 which is also very wear (see Table 30). With a few analysis, it is found that there may be some mistake in the data of WIOD, particularly in the service industries of exports from Portugal to China.
As we can see from Table 32, it is pointed out 7 services, from 1995 to 2007, represented more or less 75% of the total exports from Portugal to China. But suddenly the weight of 7 services decreased until less than 0.1% in 2008 and stayed around 0.1% in the next three years. So, it appears that there is probably something wrong in the data of WIOD after 2007.
We have already contacted by email the authors of this database (through Professor M. Timmer) and finally we got his answer “From 2007 to 2008 there is a sharp drop in
the trade volume which can be explained by the global economic crisis and the decline of trade as a result thereof. Perhaps there is also a specific story for Portuguese bilateral trade with China, that I’m not aware of. I have also calculated your indicators using the data from the new WIOTs, that are due to be released by the end of October. It shows that the trade volume is much lower for the whole period in the new tables,
Financial Interm edi ation Real Estate Activities Renting of M&Eq and Other Business Activities Public Adm in and Defence; Com puls ory Social Education Health and Social Work Other Com m uni ty, Social and Personal Services Total 7 services Total exports from Portugal to China Total 7 services/ Total exports c28 c29 c30 c31 c32 c33 c34 1995 76,2 0,4 78,7 7,7 0,3 0,1 36,3 199,78 284,48 70,23% 1996 95,1 0,2 57,9 6,1 0,3 0,0 18,6 178,27 253,58 70,30% 1997 84,9 0,2 56,7 6,4 0,3 0,0 12,8 161,29 236,48 68,21% 1998 125,1 0,5 147,5 18,8 0,8 0,1 49,1 341,85 424,71 80,49% 1999 128,0 0,5 167,2 21,5 0,9 0,1 45,9 364,26 463,78 78,54% 2000 87,9 0,5 165,3 24,0 1,1 4,2 49,2 332,20 450,41 73,76% 2001 100,1 0,7 234,4 30,6 1,6 10,5 90,4 468,21 631,20 74,18% 2002 125,2 1,0 343,7 46,7 2,6 0,3 90,0 609,65 810,59 75,21% 2003 145,2 1,3 523,0 68,0 5,3 0,5 123,1 866,31 1162,00 74,55% 2004 207,9 1,9 818,0 105,4 7,5 0,7 155,4 1296,70 1726,28 75,12% 2005 151,2 1,0 481,9 55,0 5,5 0,5 237,0 932,06 1352,61 68,91% 2006 198,2 2,0 1086,3 97,1 8,2 0,7 237,8 1630,42 2118,67 76,95% 2007 272,1 2,8 1465,8 126,9 10,6 7,9 376,6 2262,77 2929,66 77,24% 2008 0,0 0,0 0,3 0,1 0,0 0,0 0,0 0,41 690,88 0,06% 2009 0,0 0,0 0,5 0,2 0,0 0,0 0,0 0,73 643,67 0,11% 2010 0,0 0,0 0,6 0,1 0,0 0,0 0,0 0,76 674,07 0,11% 2011 0,0 0,0 0,7 0,4 0,0 0,0 0,0 1,10 907,77 0,12%