Contents lists available atScienceDirect
Land Use Policy
journal homepage:www.elsevier.com/locate/landusepol
Spatial distribution and uncertainties of nitrogen budgets for agriculture in
the Tagus river basin in Portugal – Implications for effectiveness of
mitigation measures
M.R. Cameira
a,⁎, João Rolim
a, Fernanda Valente
b, Afonso Faro
a, Ulrike Dragosits
c,
Cláudia M.d.S. Cordovil
aaLEAF, Instituto Superior de Agronomia, Universidade de Lisboa, 1349-017, Lisboa, Portugal bCEF, Instituto Superior de Agronomia, Universidade de Lisboa, 1349-017, Lisboa, Portugal cNERC Centre for Ecology & Hydrology, Edinburgh, UK
A R T I C L E I N F O Key words:
Nitrates directive Vulnerable zones to nitrates N surplus
Spatialization Trend analysis Monte Carlo
A B S T R A C T
The present study describes a methodology to quantify the gross soil nitrogen balance (SNB) for agricultural land use in the Tagus Nitrate Vulnerable Zone (TVZ) between 1989 and 2016, including effects of implementation of the EC Nitrates Directive (ND, 91/676/EEC) since 2004. The study uses decadal information from National Agricultural Census at parish level and is supported by a Geographical Information System (GIS). The average SNB of the TVZ decreased significantly (p < 0.001) from 125 kg ha−1in 1989 to 63 kg ha−1in 2016 (on
average 1.8 kg ha−1yr−1). The N input via irrigation water was particularly high in seven municipalities where
it represents up to 35% of the total inputs. Using a Monte Carlo approach, the average uncertainty of the SNB was calculated at 12%. The most important sources of uncertainty were mineral fertilization, nitrate con-centration in groundwater used for irrigation and the percentage of farmers complying with ND measures. GIS analysis shows that, at the scale of municipalities, the SNB has decreased since the ND implementation in regions dominated by irrigated intensive crop production, while the SNB has stabilized in municipalities in the south of TVZ with intensive livestock production (75% of area). We conclude that the implementation of ND and national measures to reduce the SNB was not equally effective across the TVZ. Our results indicate that the most effective measures to reduce the SNB in the future are increasing compliance of farmers with the ND related measures and measures increasing the nitrogen use efficiency of livestock manures.
1. Introduction
Agricultural soils receive considerable amounts of mineral fertilizers and animal manures each year. An imbalance between these nitrogen (N) inputs and crop uptake will result in N surpluses and increased losses of N to different environmental compartments. Excess N in the environment affects soil, air and water quality, with negative impacts on climate, human health, and biodiversity (Sutton et al., 2011; Erisman et al., 2013).
Mitigation programmes and Directives have been implemented to reduce nitrogen loads to environmental compartments, namely to water bodies. A key strategic approach is the EU Water Framework Directive (WFD) (2000/60/EC) which aims to tackle pollution at source. With the objective of reducing water contamination through nitrates from agri-cultural sources, the European Community Nitrates Directive (ND)
(Council Directive, 1991/676/EEC) is one of the earliest pieces of EU legislation aimed at controlling pollution and improving water quality, thus supporting the aims of the WFD. The ND defines Vulnerable Zones as areas of land draining into ground and surface waters vulnerable to pollution from nitrogen compounds. These water bodies are identified making use of the following criteria: a) for surface freshwaters, in particular those used or intended for the abstraction of drinking water, if they contain or could contain, more than the concentration of nitrates laid down in accordance with Directive 75 /440/EEC (directive con-cerning the quality required of surface water intended for the abstrac-tion of drinking water); b) for groundwater, if they contain or could contain more than 50 mg L−1nitrates. The ND required that within two
years following the notification of the directive, the Member States (MS) establish Codes of Good Agricultural Practices (CGAP) to be im-plemented by the farmers on a voluntary basis, and Action Programs
https://doi.org/10.1016/j.landusepol.2019.02.028
Received 7 September 2018; Received in revised form 14 February 2019; Accepted 19 February 2019
⁎Corresponding author.
E-mail address:[email protected](M.R.,. Cameira).
0264-8377/ © 2019 The Authors. Published by Elsevier Ltd. This is an open access article under the CC BY-NC-ND license (http://creativecommons.org/licenses/BY-NC-ND/4.0/).
(AP) with mandatory measures for their vulnerable zones. Within four years of the establishment of AP, measures initially prescribed in the CGAP became mandatory. The ND was transposed into Portuguese legislation by decree law 235/97. The most recent AP, which covers the nine existing Nitrate Vulnerable Zones, was established in Ordinance 259/2012, where a set of mitigation measures defined by official au-thorities must be implemented by farmers (Annex I). However, reports by the MS regarding the status of their water bodies show that the ef-fects of the AP measures remain insufficient at the European scale (Bouraoui et al., 2011). Therefore, it is crucial to select more efficient nutrient management measures, by identifying the drivers of N im-balance in each case.
Nitrogen budgets (NB) facilitate the understanding of nutrient cy-cling in agro-ecosystems (Oenema et al., 2003) and are used to assess the efficacy of measures and policies regarding nutrient management and to identify surpluses. By accounting for the major N input and output fluxes (Cherry et al., 2012), a NB provides insight into links between agricultural N use and losses to the environment. Furthermore, as the NB can take account of current agricultural practice and be used to investigate the potential effectiveness of proposed mitigation mea-sures, future trends can be predicted and the impact of management practices upon the ecosystems assessed (Alvarez et al., 2014), enabling improvement of N use efficiency (NUE) (Spiertz, 2009).
Different approaches can be used to calculate N budgets and related N surpluses, depending on available data and the purpose of the study, with farm gate, soil-surface and soil-system approaches reported in previous studies (e.g.Oenema et al., 2003; vanBeek et al., 2003;Hoang and Alauddin, 2010). These approaches use different spatial boundaries of the agricultural system investigated. Whereas a farm-gate balance assesses the difference between N flows entering and leaving the farm, a soil surface balance quantifies the N flows entering the soil via the surface and leaving it via crop uptake (Oenema et al., 2003). The soil system approach also includes nutrients gains and losses within the soil (Hoang and Alauddin, 2010). These approaches can be applied at dif-ferent scales, for example a farm gate or a soil balance, can also be calculated at national scale (rather than an individual farm or catch-ment), without having access to detailed individual farm and field data. The data required for estimating a NB using the soil surface ap-proach are simpler and less uncertain than those required for the soil system approach. The soil surface balance can produce a gross or a net N surplus, depending on whether gaseous N emissions to the atmo-sphere during fertilizer application are included in the balance. The gross N surplus is the amount of N not being used by the production system, representing the risk of N losses to the environment (Hansen et al., 2012). It is the sum of the N losses to the water bodies, to the air and includes N accumulation in soil. According to the European En-vironment Agency (EEA), N surpluses above 25 Kg N ha−1 carry a
potential risk for aquifer contamination (EEA, 2018). However, this is a very generic and indicative value which does not take in account the specificity of different catchment properties or situations. Published studies using the soil surface balance include, among others,Alvarez et al. (2014)for a region of Argentina,Bechmann et al. (2014)for a small catchment in Nordic-Baltic countries,Poisvert et al. (2017)at the county (département) level in France,Jan et al. (2017)for 210 farms in Switzerland. De Girolamo et al. (2017) andLassaletta et al. (2012) apply the soil system NB for Italian and Spanish watersheds, respec-tively. The farm gate NB is considered by Lord et al. (2002) and Macgregor and Warren (2016)in the UK.
N balances at country scale, where both extensive and intensive agriculture systems are present, may dilute the N surplus results (Reinhard and Velthof, 2015) by averaging between intensive and ex-tensive regions. This can be an issue for meaningful results, depending of the purpose of the calculation. For example, if the objective is to determine potential loads to large rivers, a country scale evaluation may be adequate. On the other hand, if the objective is to finding hotspot of groundwater pollution, a cumulative value over a large and
potentially heterogeneous area will not be adequate.
For N budgets in Mediterranean regions, intensive irrigated agri-culture can play an important role for N surpluses (Arauzo et al., 2011), where the main source of irrigation is groundwater with high levels of nitrates, such as in a NVZ. Studies of N budgets in Mediterranean re-gions with strong influence of irrigation are scarce. Lassaletta et al. (2012)andDe Girolamo et al. (2017)present two detailed studies at the watershed level. Nevertheless, the N inputs associated with irrigation were not quantified. Also, it was not an objective of these studies to relate N surpluses with changes in agricultural management practices imposed by the ND. According tovan Grinsven et al. (2012), there are considerable differences in N surpluses and losses between countries and regions. There is also a lack of knowledge concerning the effects of spatial variation in N surplus at the watershed (Bartoli et al., 2012) and landscape levels (Drouet et al., 2012) and also at the individual NVZ level.Worrall et al. (2009)showed that 69% of the NVZs implemented in the EU during the 1990s showed no significant improvement in surface water nutrient concentrations, even after 15 years. Thus, they conclude that the control strategies need to be rethought, especially if the NVZs are small. On the other hand,Kristensen et al. (2016) em-phasised the importance of any policy framework to be adopted at local socio-economic and physical conditions since the opportunity and ability for farmers to respond to mitigation initiatives and other policy instruments varies considerably. Thus, a localized and detailed analysis of NBs provides a useful basis for further studying the N dynamics and transfer between the different environmental compartments, for de-signing effective spatially targeted mitigation measures (Hansen et al., 2017;Richard et al., 2018).
For Portugal, N surplus statistics are available only at country scale, based on Eurostat estimates (Eurostat, 2016). Recently, Portugal has been involved in the International Nitrogen Management System (INMS,Sutton et al., 2016), in the UNECE Task Force on Reactive Ni-trogen (http://www.clrtap-tfrn.org/), and in the H2020 Twinning project NitroPortugal coordinated by the University of Lisbon (grant number 692331). As a result of these collaborative opportunities, this study presents a methodology to quantify the N surpluses associated with agricultural practices as well as their evolution after the im-plementation of the EC Nitrates Directive. A case study is presented for the Tagus NVZ, located to the east and northeast of Lisbon, Portugal. The specific objectives were to (i) identify the main inputs of N in the NVZ, in particular to investigate the importance of N additions through groundwater used for irrigation; (ii) calculate time series of soil surface gross soil N surpluses (SNB) at a high spatial resolution (parish level) and quantify their uncertainties; (iii) identify statistically significant temporal trends of the N surpluses; (iv) analyse the spatial distribution of the N surpluses and identify critical areas and specific causes for any imbalances, and in particular to analyse intensively irrigated crop production vs livestock production areas. The results are discussed to assess the effectiveness of specific Action Program measures and the potential for improvement. In addition, some adjustments to current policies are proposed.
2. Materials and methods
2.1. Study area characterization
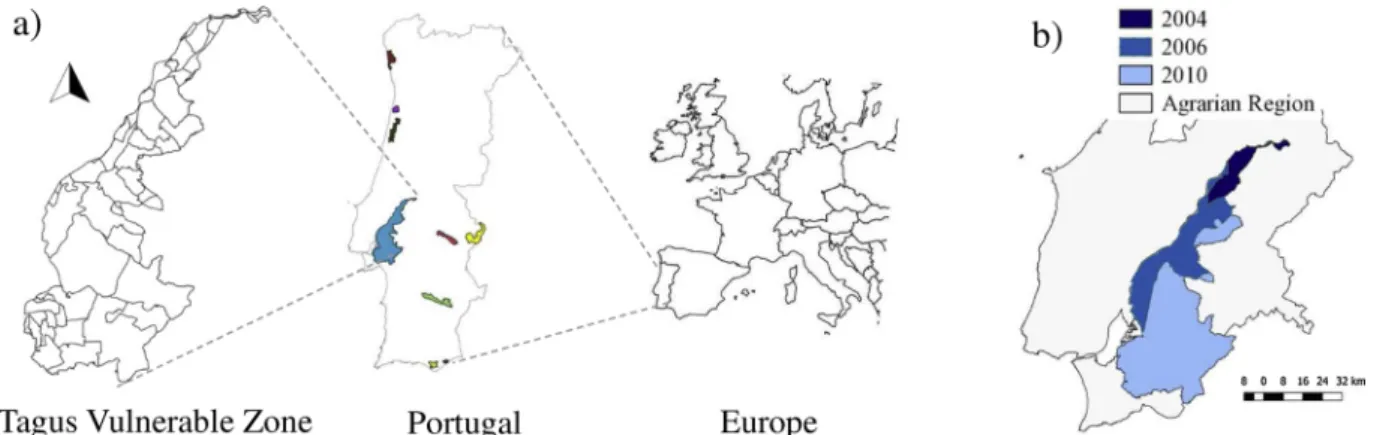
The Tagus Nitrate Vulnerable Zone (TVZ) is located in the catch-ment of the river Tagus in Portugal (Fig. 1a). A simplified N assessment of the Tagus catchment presented inCordovil et al. (2018)concludes that the sustainability of the Tagus River Basin can only be guaranteed through reductions in input loads complemented by an effective transnational management process of water flows.
The initial designated TVZ area (Ordinance 1100/2004) comprised 19 000 ha but was subsequently extended (Ordinance 1433/2006) to 100 000 ha. Another extension (Ordinance 1366/2010) increased the TVZ to 241 686 ha (Fig. 1b). Currently the TVZ contains 60% of the
total NVZ area in Portugal. It comprises 72 parishes organized into 20 municipalities. Agriculture accounts for the majority of land use and is of great economic importance in the area. The Utilized Agricultural Area (UAA) is on average 52%, slightly above the national and EU-28 averages (Table 1). Nevertheless, it varies between 6% and 83% among the municipalities in the TVZ. Irrigated land in the municipalities varies between 30 and 90% of the UAA, well above the national and the EU-28 average (Table 1). These figures highlight the importance of irrigated intensive agriculture in the study region. About 14% of the UAA is occupied by small farms with areas between 5 and 20 ha, 12% by farms with areas between 20 and 50 ha and 62% by farms larger than 50 ha. Table 1shows that the average farm area is considerably larger in the TVZ, compared to the whole country, which allowed the implementa-tion of mechanized agricultural practices and the intensive crop pro-duction in the region. The TVZ is part of the Agrarian Region of Riba-tejo e Oeste (Fig. 1b). It was at the level of the Agrarian Region that data were available and obtained to complement the decennial data at the parish level, since the former are available at a higher frequency (once every 1–5 years, depending on the variable).
The agricultural systems of the region have become more intensive during the past decades and currently the most common crops are ir-rigated grain maize and horticulture for industrial processing (mostly tomatoes), with the rest of the area under vineyards, olive groves and permanent pastures. About 48% of the soils in the TVZ are of high and moderate permeability (sandy texture - Regosols and sandy loam tex-ture - Haplic Podzols,FAO (2006)). The climate is Mediterranean with hot dry summers and mild wet winters, classified as Csa according to the Köppen system (Peel et al., 2007). Annual precipitation (30-year average) ranges from 697 mm in the north to 559 mm in the south of the TVZ. Long term daily mean and maximum air temperatures are 13 and 29 °C, respectively. About 90% of the landscape is flat and only in 6% of the territory there is a mild slope. The TVZ extends over a hydro-geologically complex area, comprising two layered aquifers separated by an aquitard, i.e., a geological layer with reduced permeability (Almeida et al., 2000). In the deeper semi-confined aquifer (5 to 50 m below soil surface) 17% of the wells from the national monitoring network (SNIR, 2017) record nitrate concentrations higher than
50 mg L−I, but concentrations have also been slowly increasing in wells
with low concentrations. Above the aquitard, in the upper aquifer (2 to 14 m below soil surface), 55% of the monitoring wells record nitrate concentrations higher than 50 mg L-1. This is considered to be a greater
threat than the lower aquifer due to its proximity to the soil surface which makes it react rapidly to agricultural management.
2.2. Data sources
The study covers a 27 years period, from 1989 to 2016. It was carried out using decadal information from the National Agricultural Census (INE, 2017) with detailed parish level data available for the years 1989, 1999 and 2009 (crop areas, irrigated areas and livestock populations). For the intermediate years 1995, 2005, 2013 and 2016, data were collected at the geographic level of the Agrarian Region and scaled down to the parish level. Crop yield data were collected at the level of the Agrarian Region (INE, 2017) for all the studied years.
Fertilizer sales data were considered the best available proxy for fertilizer use (Tomich et al., 2016;Poisvert et al., 2017). However, only overall country values (per unit of agricultural area) were available and collected (INE, 2017). Nitrate concentrations in irrigation water from groundwater and surface waters were taken from the National Water Resources Information System database (SNIR, 2017) and Nuncio (2013), respectively. Average irrigation volumes based on long time meteorological and crop data for the region were taken fromSousa and Morais (2011).
Geographical base data included the geographical boundaries of the parishes and municipalities as determined by the Portuguese Official Administrative Maps, CAOP (DGT (2017). The NVZ map and the water quality monitoring network data were made available by the National Environmental Information System (SNIAmb, 2017).
Several coefficients used in the calculations were extracted from local and European reports. Biological fixation of N by leguminous crops was estimated using coefficients found in LQARS (2006) and Baddeley et al. (2014). N input from crop residues left in and on the soil was estimated using information form the Rural Development National Agency DGADR (2017) andAgneessens et al. (2014).
Livestock excretion rates from the Intergovernmental Panel on Climate Change (IPCC,Dong et al., 2006) were used to estimate the N excreted by different livestock types. Country specific animal weights and emission factors from manure management obtained from the Portuguese Environment Agency report submitted under the UNECE convention (APA, 2016) were used to estimate ammonia emissions.
Data for the estimation of atmospheric N deposition were provided by the Co-operative Program for Monitoring and Evaluation of the Long-range Transmission of Air Pollutants in Europe (EMEP, 2017) at a 50 × 50 km resolution. Several studies rely on this source, e.g. Lassaletta et al. (2012);Dalgaard et al. (2012);Andersen et al. (2016); Poisvert et al. (2017).
Fig. 1. a) Location of the Tagus Nitrate Vulnerable Zone in Portugal and Europe; b) Evolution of the Tagus Nitrate Vulnerable Zone area. Table 1
Agriculture selected features in the TVZ compared with the national (Portuguese) and the EU-28 average, minimum and maximum values.
TVZ Portugal* EU-28* Minimum* Maximum* Average Farm area
(ha) 37 12. 14 1 (Malta) 152 (Czech R.) UAA (%) 52 47 46 9 (Finland) 76 (Denmark) Irrigated area (%
UAA) 60 13 6 0 (Est, IRL,Lux) 34 (Malta)
In addition, data from in situ experiments developed at several farms located in the TVZ were used to validate some of the estimates (Table 2).
2.3. Gross soil nitrogen balance
The gross soil nitrogen balance (SNB) was calculated annually for representative groups of crops, at the highest spatial resolution avail-able (parish level), using the soil surface balance method according with the OECD methodology (Oenema et al., 2003;Eurostat, 2016). The crop groups selected were grain maize, winter cereals, paddy rice, le-gume crops, vegetables for fresh consumption and processing, fruit trees, citrus trees, nut trees, olive trees and vineyards. The N surplus was calculated for the years 1989, 1995, 1999, 2005, 2009, 2013 and 2016. For the years 1995, 2005, 2013 and 2016, Eq. 1was used to downscale from agrarian region to parish level (as explained in Section 2.2). = + + Data P Data AR 2 Data P Data AR Data P Data AR (i) (i) (j) (j 1) (1)
where Data P is the data for the parish, Data AR is the data for the agrarian region, (i) indicates periods for which there are no detailed data and (j) indicates the periods with detailed data (j < i < j + 1).
The balance equation (Eq. 2) was applied separately for each crop group in each parish to calculate the N surplus at the highest spatial resolution possible (all terms in kg ha−1yr−1).
= + + + + +
Nsurplus MF MN IW AD BF CR EXP, (2)
where MF is the N in mineral fertilizers, MN is the livestock manure N, IW is the N in the irrigation water, AD is the atmospheric N de-position, BF is the biological N fixation, CR is the crop residues N and EXP is the N uptake by the crops.
The N surplus (in kg (ha UAA)−1) for each parish (N
SP) was
cal-culated as shown in Eq.3:
= = N N UAA SP i 1 10 surplus (i) P (3)
where UAAPis the utilized agricultural area of the parish (ha) and (i) is
the crop type.
Mineral fertilizer use at the parish level (MF, kg N yr−1) was
esti-mated based on the national trend, which was the best information available. Two periods were defined for this estimation, one before the designation of TVZ (pre-2004) when there were no limitations to fer-tilizer applications, nor other N-related rules the farmers were obliged to comply with, and the other period after the implementation of the NVZ Action Program. The estimation method started by considering that in the designation year (2004), the amounts of fertilizer applied were the maximum N application rates allowed in the TVZ for each crop group (Table 3), given that this is a highly productive area with in-tensive farming and irrigation. These values were extrapolated back-ward and forback-ward in time, taking account of the national trend which reflects the fluctuation in fertilizer sales. For the period after 2004, the following additional considerations were taken into account as imposed by the AP (Annex I, measures 4, 5 and 11): (1) The amount of mineral N applied to crops and estimated as describe above, was corrected by deducting the N entering via irrigation water and the N provided by the crop residues left in the field after the harvest of previous crops; (2) The maximum amount of manure applied was limited to 170 kg N ha−1and
it was assumed that all the farmers complied with this rule. The Por-tuguese Action program contains the maximum amounts of manure from different animal sources that can be applied to comply with this limit; (3) crop N requirements were satisfied by taking account of li-vestock manures first, and then, if needed, topped up with mineral N fertilizers; (4) It was assumed that in 2004 only 25% of the farmers in the TVZ improved the crop N fertilization requirements by following the Action Program measures, although these were mandatory, and that this percentage gradually increased to 75% for the most recent year (2016). From informal discussions with farmers in the area, it is clear that compliance is not at 100%, but it is not possible to quantify this with data.
Table 2
Information regarding irrigation and N management from farms located in the Tagus Vulnerable Zone. Farm
# Area(ha) Soiltexture Crop Irrigation Nitrogen (kg ha
−1) Yield
ton ha−1 Type Amount
(mm) Fertilization Irrigation water Previouscrops Cropexport Reference 1 1.0 sandy Forage maize Solid set 430 Mineral: 342
Organic: 140 0 58.2 283 18.5 Cameira et al. (2007) 2 1.0 silty loam Grain maize Level
Basin 350 217 30.7 – 321 12.7 Cameira et al. (2007)
3 8.0 sandy loam Grain maize Pivot 605 231 20 104 268 10.0 Sousa et al. (2007)
4 51.0 loam Forage maize Pivot 438 187 45 35 245 na Sousa et al. (2007)
5 3.6 sandy loam Potato Solid set 765 186 137 37 198 48 Sousa et al. (2007)
6 loam Paddy rice Basin Na 120 (9.5 mg NO3
L−1) na 115 5.6 Figueiredo (2011)
7 8.0 loam Tomato for
processing Drip 800 265 na na na 106 Damásio (2017)
8 35.0 silty loam Tomato for
processing Drip ≈ 637 241 na na 198 na Data from 2018 notpublished Na-not available.
Table 3
Maximum N application rates (total N) allowed in the Tagus Vulnerable Zone (Portuguese Action Program- Ordinance 83/2010).
Crop N fertilizer application rate (kg N ha−1) Crop N fertilizer application rate (kg N ha−1)
Grain maize 300 Fresh fruit orchards 107
Winter cereals 162 Citrus trees 200
Paddy rice 180 Nut trees 127
Fodder crops 128 Olive orchards 120
The manure derived N (MN, kg N yr−1) (Velthof et al., 2015) was
estimated by subtracting N losses due to NH3volatilization and NO3
-leaching in stables and manure storage facilities (LEloss) from the annual
N excretion (LE), i.e. pre-application to the soil surface. The calcula-tions were carried out using the Tier 1 method from the IPCC guidelines for national greenhouse gas inventories (Dong et al., 2006). Calcula-tions (Eqs.4, 5)were based on the assumption that 85% of the livestock population was housed year-round. It was assumed that the N produced in each parish was equally spread over the UAA of the parish, as farmers share their manure locally.
= LE N .N .TAM 1000 .365 i i rate i i ( ) ( ) ( ) (4) where LE is the N in the livestock excretion, N(i)is the number of
an-imals per livestock type, Nrate (i)is the IPCC Tier 1 rate of N excreted by
each livestock type (kg N (1000 kg animal.day)−1, TAM
(i)is the country
specific average animal mass, and (i) is the livestock type (cattle, pigs, sheep, goats and poultry).
The amount of N lost during manure storage was estimated as:
= + LEloss [LE (EF EF )] j i i j NH i j Lx i j ( , ) 3( . ) ( . ) (5) where (j) is the manure management system (liquid or solid), (i) is the livestock type, EFNH3is the volatilisation factor (dim), and EFLxis the
leaching factor (dim);
The excretion coefficients and emission factors which depend on the livestock type and on the manure management system used are shown in Table 4and are default values from Dong et al. (2006). For the leaching factor, an average value of 0.1 was used. Only for TAM, country specific data was used (APA, 2016).
The N supplied via irrigation (IW, kg N yr−1) may be an important
balance input in a NVZ where most of the irrigation relies on ground-water with high concentrations of NO3-. In most of the TVZ about 80%
of the irrigation water comes from groundwater, except for the southern part where this percentage decreases to 60%. For the esti-mation of this input (Eq. 6), long term annual irrigation volumes per crop were used together with the N-NO3concentrations in water from
the wells located in each parish or, if that was the case, from surface waters (reservoirs/dams).
=
NIrrig i( ) Irrig( )i.AC i( ). [N NO3].10 6 (6)
where Irrig(i)is the average irrigation volume (L m−2) applied per year
to the crop i, AC(i)is the area (m2) occupied by crop i in the parish, and
[N-NO3] is the nitrate N concentration (mg L-1) in the wells or surface
waters.
The calculations of atmospheric N deposition (AD, kg N yr−1) were
carried out by applying the N deposition rates provided by EMEP for the 50 x 50 km grid cells covering the TVZ, for the areas occupied by the different crops.
Biological N fixation by leguminous crops (BF, kg N yr−1) was
estimated using typical average values of 10.1, 165 and 133 kg N ha−1
for temporary pastures, permanent pastures and grain legume crops, respectively (LQARS, 2006;Baddeley et al., 2014).
After the harvest of crops such as cereals and vegetables, siderable amounts of stalks are left on the field, in some cases con-taining high concentrations of nitrogen in their tissues (Agneessens et al., 2014). To estimate the amount of N left on fields in the form of crop residues (CR, kg N yr−1), the most common crop sequences in the
TVZ were identified, and the data presented in Table 5for previous crops were considered as inputs for the current crops.
The export of N (EXP, kg N yr−1), i.e. the N uptake by crops, was
estimated from the statistics of crop productivity (INE, 2017) and the N concentration in the plants at the time of harvest provided in the lit-erature. This method was possible for maize, paddy rice, and tomatoes for industrial processing and potatoes (Sousa et al., 2007; Cameira et al., 2007and others presented inTable 2). For the remaining crops, no data were available regarding N content at the time of harvest. Thus, N export was calculated by Eq. 7:
=
N P N
P exp act upt
ref (7)
where Pactis the actual crop productivity (INE, 2017), and Nuptis the N
removal by crops for the reference productivity (Pref) (LQARS, 2006).
The assumptions and simplifications necessary to apply the de-scribed methodology can be sources of uncertainty for the N surplus and these are summarized below:
•
Spatial data for fertilizer practices for each crop type do not exist, so national trends were used and downscaled for the TVZ;•
The N in the manure produced in one parish was assumed to be used in that parish in the first instance. When the maximum allowed application rates were reached, the manure was distributed first to other parishes of the same municipality and then to the neighboring municipalities;•
The adherence of farmers to the measures proscribed in the Action Program is unknown. Therefore, expert judgement was used to es-timate this adherence;•
For some crops no coefficients are available to convert the produc-tion into N content. The method used was to combine scientific research, where available, with expert judgement. Few experimental data exist to validate these coefficients;•
N deposition estimates taken form the EMEP represent average va-lues for the 50 x 50 km grid and may underestimate atmospheric N input in municipalities with a high livestock density or intensive crop fertilization (Dalgaard et al., 2012), and overestimate for more extensive pastures. This is largely due to ammonia deposition de-creasing rapidly away from source areas, i.e. within a few km (e.g. Dragosits et al., 2002,2006;Vogt et al., 2013);•
It is difficult to estimate the N export by grassland/pastures. It was assumed that the N content in unfertilised grassland is roughly equal to the N content of the excreta of the grazing animals. A similar approach was used byLord et al. (2002);•
Most of the coefficients used in the estimation of the manure N applied to the crops are dependent upon the livestock management (namely feeding practices) which was not considered in this studyTable 4
Coefficients related to livestock N excretion. Livestock TAM* N
rate#
kg N EFNH3(dim)
## Frac
MS(dim)+ kg (1000 kg d)−1 Liquid Solid Liquid Solid Dairy cattle 550 0.48 0.40 0.30 0.35 0.65 Other cattle 400 0.33 0.40 0.35 0.35 0.65 Pigs 120 0.465 0.48 0.45 0.91 0.09 Poultry 3.5 0.835 ### 0.45 0 1 Sheep 50 0.85 ### 0.19 0 1 Goats 25 1.28 ### 0.19 0 1 Horses 307 0.26 ### 0.19 0 1
* average animal mass,# N excretion rate, ##NH
3 volatilization rate,+
fraction corresponding to each manure management system,###not applicable.
Table 5
Nitrogen amounts left in the soil by the previous crop: DGADR (2017); Agneesen et al., 2014.
Current Crop Previous crop Nitrogen in previous crop residues Vegetables Vegetables 30 kg ha−1
Grain maize Winter cereal 1.5 kg of N/t green mass incorporated Grain maize Legumes 2.5 kg of N/t green mass incorporated Winter cereal Grain Maize 1.5 kg of N/t green mass incorporated Winter cereal Legumes 2.5 kg of N/t green mass incorporated
due to lack of information.
The N surplus data (in kg N yr−1) calculated by parish were then
aggregated to the municipality (NSM) level for further analysis, and then
calculated per unit area for the UAA (Eq. 8):
= = N N .UAA UAA SM j 1 72 SP(j) P(j) M (8)
where UAAPand UAAMare the utilized agricultural areas of the
par-ishes and the municipalities, respectively, obtained from the official statistics (INE,2017), and (j) is the parish number.
To assess the spatial distribution of the N balance inputs, outputs and N surplus across the TVZ, the base data and the calculation pro-cedures of the gross soil N balance were integrated in a Geographical Information System (QGIS). The different balance terms of gross soil N balance, obtained for the different years considered, were spatially distributed at the municipality level.
2.4. Statistical methods
2.4.1. Uncertainty and sensitivity analysis
For the deterministic model used to quantify the N soil surface balance (Eqs.2–6), the key uncertainties affecting N surplus outputs result from the uncertainly in the input data and parameters. To eval-uate the uncertainty in each component of the balance and in the average N surplus of the TVZ, a simple Monte Carlo simulation analysis was carried out, using a Latin Hypercube sampling strategy (Marino et al., 2008). For each studied year and municipality, 1000 simulation runs of the model were carried out, assuming independent variables and parameters. A Latin Hypercube sample of standard uniform dis-tributions was initially generated and then transformed to the statistical distributions assigned to each of the input variables/parameters (Table 6). Data collected from national surveys and other sources (as described in Section2.2) provided the average values, while their re-lative uncertainty (given by the coefficients of variation, CV) was es-timated based on published literature (e.g.,Dong et al., 2006;Gu et al., 2017; Poisvert et al., 2017) and authors expert judgment. Variables where data were derived from national census statistics have the lowest CVs, while variables and parameters obtained from international pub-lications were ascribed the highest CVs.
To identify the most critical input factors (variables and parameters) of the model, a global sensitivity analysis (SA) was also performed. The extended version of the Fourier Amplitude Sensitivity Test (eFAST) proposed bySaltelli et al. (1999)was used. This method, based on the decomposition of the variance of the output, allows the computation of two sensitivity indices for each factor: the first order or main effect index (Sxi) and the total effect index (STxi). Both indices are normalized
by the variance of the output, providing therefore scaled sensitivity measures in [0,1]. The maxima and minima of the 92 uncertain input factors used in the SA were established based on their statistical dis-tributions and respective parameters (Table 6).
2.4.2. Trend and correlation analyses
Nonparametric techniques were used to detect monotonic trends in the longitudinal N surplus data and to estimate the intensity of asso-ciation between N surplus and other variables. Bartels’ rank test of randomness (Bartels, 1982) was applied to analyse the significance of a trend in a sequence of observations. Bartels’ test is the rank version of the von Neumann’s ratio test (von Neumann, 1941) where the null hypothesis of randomness (independence) can be tested against the existence of a trend (Mateus and Caeiro, 2014). Due to the small size of the samples, the exact distribution of the statistics and the exact probability values (p-value) of the test could be calculated. Whenever a significant trend was detected, the slope of the trend line was estimated by the Theil–Sen’s method (Theil, 1950;Sen, 1968) and the intercept by the estimator proposed by Hettmansperger et al. (1997)(Hollander et al., 2014).
A similar approach was followed to analyse the association between N surplus and the amount of mineral or organic N applied in each year. After sorting one of the variables, Bartels’ test was applied to the other variable. Whenever randomness was rejected, Spearman’s rho (ρ, rank correlation coefficient) was calculated to determine the signal and strength of correlation between the two variables. This methodology avoids the problems of non-normal data, heteroscedasticity and serial correlation that could affect the reliability of the results of other sta-tistical tests. All the analyses were carried out in R (R Core and Team, 2018) with RStudio software (RStudio Team, 2018) and using the packages ‘lhs’ (Carnell, 2018), ‘sensitivity’ (Pujol et al., 2018) and ‘randtests’ (Mateus and Caeiro, 2014).
Table 6
Variables and parameters used in the gross soil N surplus balance equation and statistical distribution and coefficient of variation (CV) used in the uncertainty analysis.
Variable/Parameter description Units Distribution CV (%)
Crops areas ha Truncated Normal 5
Crops productivity kg ha−1 Normal 5
Trend in fertilizer sales – Uniform 30
% farmers complying with ND – Uniform 15
Animal population – Truncated Normal 5
Average animal mass kg Truncated Normal 15
N excretion rate for animals kg N (1000 animal day)−1 Normal 30
Manure solid fraction – Normal 15
Manure volatilization rate (solid fraction) – Normal 30
Manure volatilization rate (liquid) – Normal 30
Manure leaching coefficient – Normal 30
Atmospheric N deposition rate kg N ha−1yr−1 Truncated Normal 30
Average irrigation depth mm yr−1 Normal 30
Fraction of irrigation water from GW – Uniform 10
Groundwater nitrate concentration mg L−1 Truncated Normal 25
Surface water nitrate concentration mg L−1 Normal 25
Symbiotic N fixation rate kg N ha−1yr−1 Truncated Normal 30
N left in the soil by previous crops kg N ha−1yr−1 Normal 25
Fate of straw from previous crops – Beta 50,1(a)
Crops reference productivity kg N ha−1yr−1 Normal 5
Crops N export rate kg N ha−1yr−1 Normal 5
3. Results and discussion
3.1. Gross soil nitrogen balance for the Tagus nitrate vulnerable zone 3.1.1. Nitrogen inputs
Fig. 2a shows the contribution of the N inputs to the SNB. Fertilizers (mineral and organic) represent the major N flow for the study period, averaging at 75% of total N inflows. Until 2009, the inputs through mineral fertilization were larger than those from livestock manure (Fig. 2b), although showing a declining trend. The reduction in the mineral fertilizer inputs between 1989 and 2005 reflects the decrease in fertilizer sales registered at country level. In 2005, mineral fertilizer inputs show an increase, again following the country level trend. After 2005, with the designated NVZ area becoming progressively larger (as described in Section 2.1), mineral fertilization started to decrease where the livestock production was high. This was probably due to the limits imposed by the Action Program to the maximum total N that can be applied to each crop, and the preference of farmers for applying livestock excreta. Overall, the amount of mineral fertilizers as N input decreased by 34% from 1989 to 2016. N inputs through mineral ferti-lizers have also decreased during this period in some European coun-tries, e.g. Croatia (50%), Italy (30%) and Greece (25%), while for other countries they have increased. This was the case of Bulgaria (133%), Latvia (4%) and Austria (58%). At the EU-28 level there was an increase from 67.4 kg ha−1in 2006 to 74.4 kg ha−1in 2016 (Eurostat, 2018).
The changes in mineral fertilizer use were influenced by the utilized agricultural area (UAA), its occupation by the different crops, and economic and legal constraints such as the ones introduced by the
Common Agricultural Policy (CAP) or imposed by the Nitrates Directive and the National Action Plan from 2004.Fig. 3a) shows UAA occupa-tion during the years under analysis. The area of arable crops decreased between 1999 and 2004, mainly due to the CAP set aside policy and quotas that limited production. As a result, the area occupied by per-manent pastures increased. Following the country trend, arable land had increased again by in 2009, in the TVZ, due to the rise in the market values of the agricultural products, leading to land use change, from set aside to cereal production. While annual crops overall showed just a small increase for the study period, the percentage of winter cereals decreased considerably while grain maize and vegetable pro-duction, mainly for industry, increased (Fig. 3b). The latter two are annual crops with high N input. Permanent crop areas, which are low N input crops, slightly decreased between 1989 and 1999 and then re-mained fairly steady. However, after 2004, mineral fertilizer use de-creased due to the NVZ designation and the implementation of the mitigation measures from the Action Program which the farmers in-creasingly adhered to.
Table 7compares the agricultural land use in the TVZ, Portugal, the EU-28 and the EU countries with maximum and minimums values. In the TVZ, the percentage of UAA occupied by arable land is higher than the country average, which is particularly due to grain maize and ve-getable crops. On the other hand, the high shares of arable land pre-sented by some European countries, which are reflected in the EU-28 average, are occupied essentially by rainfed cereals.
The overall tendency in the TVZ during the study period was for an increase of the irrigated area (by 16%) which is a good indicator of N consumption, since irrigated crops are the most demanding in terms of
Fig. 2. a) Contribution of the different sources to the N balance; b) Evolution of mineral and organic livestock fertilizers use in the Tagus Vulnerable Zone
(MF-mineral fertilizers, MN – manure N production, AD - atmospheric deposition, IW - irrigation water, BF - biological fixation and CR - crop residues).
nutrients.
Manure N almost matched mineral fertilizer application in 2013 and even exceeded it in 2016, (Fig. 2a), with total values of 6.1 and 5.9 Mt yr−1respectively (Fig. 2b). This corresponded to shares of 36 and 39%
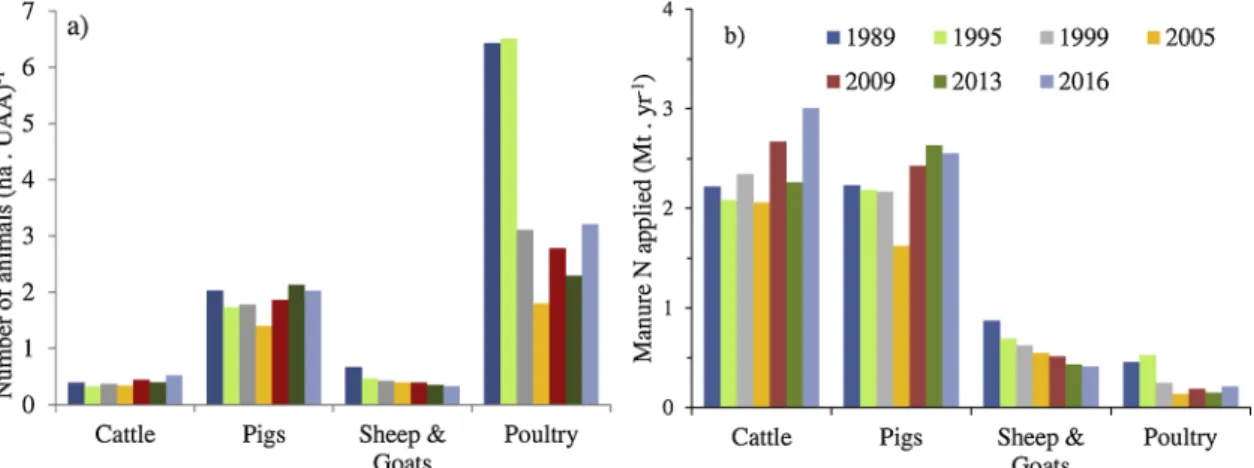
of the total N inputs, respectively. This increase was associated with the increase in livestock production between 2005 and 2016 (Fig. 4a), in particular of cattle (46%), pigs (38%) and poultry (70%). At the EU level, there was a decrease in cattle and pig populations between 2005 and 2016 (Eurostat, 2018). As shown inFig. 5, only 10 countries pre-sented an increase in the cattle population and only 6 countries had an increase in their pig population. Nationally, for the same period, Por-tugal had increases of 9 and 11% for the total number of cattle and pigs, respectively.
Fig. 4b shows the trends of manure N applied to the TVZ cropland. The amounts of N lost during livestock housing and storage (by type of livestock) were estimated to be 3.7, 5.1, 5.1, and 5.4 Mt for the four studied years between 2005 and 2016. It was assumed that all N re-maining in the manure after losses by volatilisation and/or leaching during livestock housing and manure storage was applied to croplands. The third most important N input flow (12%) corresponds to N contained in irrigation water (Fig. 2a). It is important to note that this inflow was highly variable within the TVZ (Fig. 6), with seven muni-cipalities showing values above the average for the TVZ since 2005 (20.3 kg ha−1). This input is particularly high for three municipalities
where it represents between 30 and 35% of the total N inputs. As it can be seen inFig. 6, these municipalities are located in the northern part of the TVZ, and are spatially associated with the distribution of irrigated crops, in particular grain maize and vegetables. Atmospheric deposition (AD) represented, on average, 4% of total inputs, while biological fixation (BF) and crop residues accounted for 2 and 5%, respectively. Lassaletta et al. (2012) showed that for another Mediterranean wa-tershed (Ebro River Basin, NE Spain), AD represented 7% of total in-puts.De Girolamo et al. (2017)present contributions of 9 and 6% for BF and AD in another Mediterranean catchment (Celone River Basin, South Italy). However, neither of these studies account for N inputs through
irrigation water. 3.1.2. Nitrogen output
Fig. 7a shows that the N export by crop production increased on average during the study period, except from 1989 to1995, and 1999 to 2005. These variations are likely due to changes in the area occupied by the crops, but also, particularly in 2005, due to adverse weather con-ditions (severe drought) that probably influenced crop productivity and thus N uptake.Fig. 7a also shows that the increase in crop productivity and the more rational application of N fertilizers contributed to an overall improvement in N use efficiency (NUE). Irrigation with groundwater containing considerable amounts of nitrates recycles part of the leached NO3−and can be contributing for the overall TVZ NUE
increase. The use of improved crop varieties, the increase in irrigation efficiency (which decreased leaching losses), and new technologies associated with fertilizers (e.g. slow release N fertilizers), may also have contributed to the NUE improvement. Similar increases in NUE were also reported for Denmark, byDalgaard et al. (2014), associated with NVZ designations.
N uptake varied among crops, with the dominant share of total N export relating to grain maize and vegetables for processing (Fig. 7b). Since 1999 these crops represent more than 50% of the total removal, reaching values close to 70% for the last two periods of the study. Permanent crops (fruit trees, olives groves and vineyards) present a much lower share, remaining fairly constant. By contrast, the removal of nitrogen by winter cereals decreased considerably due to the de-crease in the occupied area.
3.1.3. Nitrogen surplus
Fig. 8shows the evolution of the gross soil N surplus between 1989 and 2016 calculated for the different territory units (municipalities) within the TVZ. The average N surplus represents the area weighted average of the different municipalities’ values calculated in this work, while the country values were estimated by Eurostat (Eurostat, 2016; not available for all study years).
Bartels’ statistical test showed a highly significant decreasing trend (p < 0.001) of the N surplus at the level of the TVZ for the study period (encompassing 27 years). The slope of the trend line indicates a de-crease of 1.8 kg N per hectare of UAA and per year. These results may be affected by the fact that a downscaling procedure was used to obtain data for some years of the study period. However, when these years are removed from the trend analysis the average decrease in the N surplus is even higher (slope = - 2.3). It is interesting to note that, similar to several other EU countries (e.g. Belgium, Denmark, Germany, Greece, Italy, Netherlands) there is a considerable decrease of N surplus prior to the implementation of the Nitrates Directive (Baraui et al., 2011). This can be associated with the previously mentioned increase in the price of
Table 7
Forms of agricultural land use in the TVZ, Portugal and the EU-28 (data refers to 2016).
Land use (% UAA) TVZ Portugal EU-28* Minimum* Maximum* Arable land 44 30 60 21 (Ireland) 98 (Finland) Permanent
Pastures 40 49 32 0 (Malta) 80 (Ireland) Permanent crops 16 20 6 0.2 (UK, FIN, S,
IRL) 25 (Cyprus)
*Eurostat (2018).
Fig. 4. a) Livestock population per unit of utilized agricultural area (UAA) in the Tagus Vulnerable Zone; b) manure N applied to cropland (excluding losses during
mineral fertilizers and the set aside policies. The increase of NUE due to use of improved crop varieties can also be a cause for this, although the increase of NUE can also be an effect of the decrease in N inputs. The most important decrease (26%) in N surplus occurred between 1989 and 1999 and relates to the reduction in fertilizer sales at country level. After 2005, N surplus continued to decrease but at a lower rate. During this period, livestock populations (in particular cattle, pigs and poultry) started to increase (Fig. 4a), which is reflected in the N surplus. How-ever, there are considerable variations in the N surplus among muni-cipalities due to local differences.
Erisman et al. (2011) and Eurostat (2016) report surpluses for Portugal per unit of UAA and per year of 42 kg, which is substantially lower than the 64 kg calculated in the present study for the TVZ in 2016. The overall value presented by Eurostat encompasses a great diversity of agricultural systems, with a high representativeness of ex-tensive systems with reduced fertilizer inputs. Therefore, the higher N surplus in intensive systems that occupy smaller areas (such as the TVZ) becomes diluted. However, for countries such as the Netherlands and Denmark (Dalgaard et al., 2014), where NVZ rules have been im-plemented over the entire country area, show values of N surplus with magnitudes similar to those presented in this work for the TVZ.Hansen et al. (2012)report N surplus reductions of 30–55% in Denmark, with a national average value of 117 kg N ha−1in 2007.Lord et al. (2002)
present an overall N surplus of 115 kg ha−1for the 12,000,000 ha of UK
agricultural land, using the farm gate method. De Girolamo et al. (2017) present a value of 60 kg ha−1year−1 for a Mediterranean
catchment in Italy (for the 2010–2011 period), for productive land where the mineral fertilization is the main source of N (72%).
These results may indicate that ND measures can have a positive
impact on the reduction of N surplus in very different countries, when transposed to those countries through their specific Action Programs, suitable for their policies and practices.
Table 8summarizes the descriptive statistics for the N surplus re-sults for the TVZ, where the averages and the standard deviations were weighted by the areas of the municipalities.
The reported average values are associated with a considerable variation expressed by maximum and minimum values, standard de-viation and coefficient of variation. Lassaletta et al. (2012)also re-ported such variability for their Spanish watershed.Lord et al. (2002) reported N surpluses for the UK varying between 0 and 200 kg ha−1.
3.2. Spatial analysis of the N surplus within the TVZ
From absolute values and the trend analysis of N surplus, it can be concluded that agriculture pressure on diffuse N losses decreased over the studied period but remains high in the TVZ relative to the 25 kg ha−1EEA reference, which means that there may still be an aquifer
pollution potential. Thus, the spatial distribution of the N surplus was analysed to determine local issues and try to identify causes for N budget imbalances.
Figs. 9 and 10show livestock N excretion produced per municipality and the percentage of the UAA which is irrigated, respectively. These are two important drivers for N surplus, since the first constitutes an inexpensive N source and the latter reflects the production of high N demand crops. While irrigation is more prevalent in the northern and central regions of the TVZ, as expressed by a higher percentage of UAA under irrigation, livestock production is concentrated in the southern part.
Fig. 5. Variation in the number of cows and pigs in the EU-28 countries, between 2005 and 2016 (Eurostat, 2018).
Fig. 6. N inputs through irrigation water for each municipality in the Tagus Vulnerable Zone (TVZ). The horizontal line represents the average value for the TVZ since
Fig. 11shows the spatial distribution of N surplus and its temporal dynamics. N surplus was initially high across the TVZ, and showed a wide spatial variation. In the northern part, characterized by a high proportion of irrigated agriculture (grain corn and vegetables mainly supported by mineral fertilization) and medium livestock densities, the intensification of the crop production seemed to be efficiently con-trolled in terms of N inputs. Indeed, the regions more dependent on mineral fertilises showed a higher decrease in N surplus during the first period, due to constraints in fertilizer purchase, and after 2005, due to the restrictions imposed by the Nitrates Directive and the Action Pro-gram regarding the maximum amount of total N that can be applied to each crop. In 2016, average N surplus for the TVZ as a whole was around 50 kg N ha−1, with higher values in the southern part, where
livestock agriculture dominates. Although there was a general decrease over time, more recently a stabilization between 100 and 150 kg N ha−1was reached in this part of the TVZ. Four hotspot municipalities,
with an N surplus above the average for the TVZ remain (Benavente – code 7, Moita -code 18, Montijo – code 19 and Palmela- code 20), lo-cated in the central and southern part of the TVZ, and making up 57% of the TVZ area.
3.2.1. Trend and correlation analysis
Despite the highly significant decreasing trend (p < 0.001) of the average N surplus for the TVZ as a whole, in 40% of the territory (9 municipalities) the trend was not significant (p > 0.05), instead in-dicating stabilization for the study period. On the other hand,Fig. 12
shows that after TVZ designation, more than 75% of the territory did not present a significant (decreasing) trend. Almost 90% of this area is located in the southern part of TVZ:
Bartels’ test showed that, although the average N surplus for the entire period presented a significant (p = 0.026) positive correlation with mineral N fertilizer use, in 87% of the area the decrease in the N surplus is not correlated with the amount of mineral N applied. On the other hand, for the entire study period, the average TVZ N surplus was not significantly (p = 0.165) correlated with the N applied through li-vestock excreta, although for 27% of the TVZ area this correlation was significant (p < 0.05) and positive (p > 0.85).
The previous analysis shows that the results for the TVZ as a whole
Fig. 7. a) N export rate by the crops grown in the Tagus Vulnerable Zone (uptake) and N use efficiency (NUE); b) contribution of each crop group to the overall N
export.
Fig. 8. Evolution of the annual agricultural N surplus in the Tagus Vulnerable Zone and of the overall values for Portugal fromEurostat (2016). Trend line equation: y = 3686.6-1.8 x.
Table 8
Descriptive statistics for the N surplus calculated for the Tagus Vulnerable Zone. Statistics 1989 1994 1999 2004 2009 2013 2016 AvW(kg N (ha UAA)−1) 126 100 92 83 80 67 64 Max (kg N (ha UAA)−1) 206 144 175 169 149 95 94 Min (kg N (ha UAA)−1) 78 39 45 47 24 21 23 Med (kg N (ha UAA)−1) 105 94 81 83 76 62 59 StDW(kg N (ha UAA)−1) 35 19 36 18 34 24 22 CV (dim.) 0.28 0.18 0.38 0.22 0.43 0.36 0.34 AvWis the weighted average, StDWis the weighted standard deviation, Med is
the median value, Max and Min are the maximum and minimum values, re-spectively, and CV is the coefficient of variation.
are misleading and can induce inadequate conclusions regarding ferti-lizer related drivers for the N surplus. In fact, different spatial patterns were detected within the TVZ associated with crop, livestock and irri-gation intensity. Seven municipalities stand out, where irriirri-gation water contributes 30% of the inputs for the N surplus. In these municipalities the irrigation water contribution has been decreasing due to the im-provement in irrigation system efficiency (on average from 69 to 86%). On the other hand, there are municipalities where the different N input types contributed more evenly to the high N surplus.
3.3. Uncertainties in the calculation of the gross soil N balance
The TZV overall uncertainty associated with the N surplus
estimates, for all the years after ND implementations determined by the Monte Carlo approach is 12%. When estimated for each municipality, the uncertainty varied from 12 to 62% between municipalities.Fig. 13 shows the boxplots for the key N balance components and for the 1000 simulations performed using the Monte Carlo approach described in Section2.4. For N inputs via irrigation water (IW), the uncertainty can override the possible differences between years. Nevertheless, for mi-neral fertilization (MF) and N export by crops (EXP), uncertainty ana-lyses confirm the differences discussed in Sections 3.1.1. and3.1.2. Also, for MN (manure N) and IW, the outliers (open circles inFig. 13) are predominantly high values. The (average) values used to calculate MN and IW may lead to their underestimation, and consequently to the underestimation of the average N surplus for the TVZ.
Fig. 9. N in the livestock excretion produced in each municipality of the Tagus Vulnerable Zone.
Fig. 14shows, for the model used in this study, the expected re-duction in the variance of the calculated N surplus if each individual input factor (Fi) could be exactly known (main effect), and if all input factors but Fi could be known with precision (interactions) (Saltelli et al., 2004). Results show that the two more relevant factors influen-cing model results are the mineral fertilizer sales (F1) and the nitrate concentrations in groundwater used for irrigation (F2). About 39% of the variability in N surplus can be reduced if mineral fertilizer sales are accurately quantified. A similar percentage (36%) was found for nitrate concentrations in groundwater used for irrigation. The latter value re-lates to the fact that this factor influences two major inputs of the N budget, IW and MF. For the particular case of the TVZ, where 80% of the irrigation relies on groundwater with high nitrate concentrations (and in some municipalities 90% of the UAA is irrigated), the im-portance of this factor is very high regarding model sensitivity. This reinforces the specificity of N management in intensive, irrigated crop
production systems. The other factors influencing the calculated N surplus variability, and requiring careful quantification, are the per-centage of farmers that are complying with measures related to the ND (8%) (Section2.3), the N excretion rate for animals (5 and 3% for pigs and cattle, respectively), and crop productivity, particularly for maize (2%). The importance of this last factor relates to the N export (crop uptake) estimations. The other factors listed inTable 6which do not appear inFig. 14were found to contribute very little to the N surplus variability.
3.4. Environmental management and policies
Previous studies demonstrated that ND measures (Annex I) are only partially successful in terms of impact on groundwater quality (e.g. Oenema, 2009). As shown in the present work, different regions of the TVZ produce different dynamics within a soil surface N budget. In areas
Fig. 11. Spatial distribution of the N surplus within the Tagus Vulnerable Zone for the study period.1989–2016.
where intensive irrigated crop production dominates, a balanced ferti-lization accounting for inputs from other sources in addition to fertili-zers (e.g. N from previous crop residues, N in irrigation water) seems to be the most appropriate mitigation measure. Furthermore, using irri-gation water from an aquifer contaminated with considerable amounts of nitrates will contribute to clean the aquifer if the fertilization plan takes account of this input. Therefore, the group of farmers whose main activity is cash crop production (maize, vegetables including processing tomatoes, potatoes etc.), for whom the ND/AP measures are suitable for their farm management activities, can optimally implement these measures to reduce the pressure on groundwater quality.
In some municipalities, manure N production is the most important N input and, in some cases, there is no room (or need) for mineral fertilization, with enough N available from manures. N surplus is in-variably higher where the livestock production is more intensive, even if it is assumed that all the farmers comply with the mandatory max-imum application rate of 170 kg N ha−1for organic N. For the group of
farmers whose main activity is livestock production, the implementa-tion of mandatory good manure management practices may be neces-sary. The Action Program should take into account the specificity of their activity, namely the production of high amounts of manure and slurry that need to be managed. In the future, increasing mineral N fertilizer prices may provide an additional economic incentive to reduce their use and thus to increase the NUE of organic N from livestock excreta (van Grinsven et al., 2012). Focusing in reducing N inputs (tackling at source), specific approaches that may work in this context
Fig. 13. Uncertainties in the calculation of the main N balance components according to the Monte Carlo analysis: Manure N (MN), irrigation water (IW), N export by
crops (EXP), mineral fertilizer (MF). The circles represent the outlier values.
Fig. 14. Main factors influencing N surplus variance (F1 – Fertilization sales, F2
– Nitrates in groundwater used for irrigation, F3 – Percentage of farmers that comply with the ND/AP measures, F4 – N excretion coefficient for pigs, F5 – N excretion coefficient for cattle, F6 – Maize crop productivity).
would be the creation of sufficient manure storage capacity to store the excess N excreted using low-emission techniques to minimise volatili-zation and leaching losses. Composting facilities to produce composts with higher available C/N and anaerobic digesters for treatment of li-vestock excreta are also possibilities. Nevertheless, spatial modelling (at field and catchment scales) is fundamental to support the above, to assess the environmental and economic consequences of the different options.
In both livestock and crop farming systems there are farmers that do not (yet) understand the rationale behind mitigation measures and the reasons for their adoption (which often include cost savings if nutrients are properly accounted for and applied at optimal times for crop growth). For those farmers an action learning program would be very important. Others remain unconvinced about the balance between farm management and environmental benefits (Barnes et al., 2011;Buckley, 2012). For this group, economic supporting measures would be an in-centive for taking action. In fact, regulation and mitigation options to reduce the N surplus are not always compatible with practices of farm management (Richard et al., 2018). From the policy and societal point of view, farm advice needs to be coordinated and consistent with the Action Program mitigation measures. Individual compliance with the Action Program will foster both farm and public benefits. As pointed out bySmith et al. (2017), a major challenge is that this is needed from the highest levels of governance and across the regional and local government. According to the same authors, the strategic use of pay-ment schemes may be an efficient way to incentivise the adoption of suitable measures.
However, agriculture is not the only source of nitrogen in the TVZ. For situations were no relationship was found among the studied fac-tors, other sources may be of importance, such as urban and the in-dustrial pressures should also be considered and investigated (which was not possible as part of this study).
4. Conclusions
A soil surface gross nitrogen balance (SNB) was calculated for the Tagus Nitrate Vulnerable Zone for the period between 1989 and 2016. The annual N surpluses were obtained for 72 parishes and then ag-gregated and analysed at the municipality level for 7 “snapshot” years. N inputs and outputs were modelled using a spatial/GIS database and their uncertainty was assessed using a Monte Carlo approach. The fol-lowing conclusions can be drawn from the results obtained:
(i) Fertilizers (mineral and organic) are a major N flow in the TVZ, representing on average 75% of total N inputs. Mineral fertilizers have a higher share than manure N production for the early years, however, the situation was reversed in the later years. A more moderate N input flow is provided by N contained in irrigation water (taken mainly from nitrate-rich groundwater aquifers). However, N from irrigation water represented on average 75 kg ha−1year−1in one municipality with intensively irrigated crop
production. The remaining N balance inputs (atmospheric de-position, biological fixation and residues from the previous crop) together are estimated to add 11% to N inputs.
(ii) The average N surplus was calculated for the study period with an uncertainty of 12%. The main factors of uncertainty in the SNB requiring a more accurate quantification are mineral fertilization, nitrate content in groundwater used for irrigation and the per-centage of farmers compliance to ND measures;
(iii) A statistically significant decrease of the average N surplus in the TVZ was found over the entire study period (1989–2016), and 75% of the TVZ area seems to have reached a stabilization level over the last 10 years, leading to the conclusion that diffuse agricultural N pressure decreased but remained high.
(iv) Results indicate that the implementation of the Action Program measures is not equally effective throughout the TVZ. This con-firms that national scale pressures cannot be used to identify and estimate the N loads in each specific NVZ with the objective of identifying mitigation measures. The spatial variability of the N surplus seems to be closely related with the specialization of the agricultural production in terms of crops/livestock production within the NVZ. Intensive pig, cattle and poultry farming in the southern part of the TVZ can result in very large local N surplus, reflecting the difficulty in using manure-derived N efficiently. Thus, for these areas, results identify opportunities for improved manure management, namely the improvement of manure N availability.
The spatially explicit method presented in this study was effective for evaluating mitigation measures and their potentials, and to identify N emission hotspots. The results support the need for ensuring that farmers are complying with ND/AP related measures, and the need for improved measures with respect to efficient use of livestock N excreta, with minimal losses to the environment.
The results obtained can also help water management stakeholders to implement the ND/AP measures and to evaluate the suitability of those measures across the diverse range of agricultural management practices. Nevertheless, the uncertainties associated with the method should be reduced by complementing with other assessment methods, including more detailed N source assessment, in situ measurements and information and process modelling. Following on from this initial study, further mechanistic and comprehensive analysis of N flows, nutrient balances and losses are required to identify further areas of improve-ment and to increase nitrogen use efficiency.
Acknowledgments
The authors acknowledge NitroPortugal, H2020-TWINN-2015, EU coordination and support action n. 692331 for funding. Open access publication was financed by LEAF. CEF (UID/AGR/00239/2013) and LEAF (UID/AGR/04033/2013) are research units funded by Fundação para a Ciência e a Tecnologia I.P. (FCT), Portugal.
Annex I – Compulsory measures defined in the Nitrates Directive and its transposition to the Portuguese case (Action Program-ordinance 83/2010)
Nitrates Directive Portuguese Action Program*
Following the ND the following measures are mandatory
Definition of periods when the land application of fertilizer is inappropriate; (1) Application of chemical and organic fertilizers in forbidden between Nov 1stand Feb 15th. Guarantee of sufficient storage capacity for livestock effluents; (2) The storage capacity for livestock effluents must be calculated for a period of 120 days, if no
alternative system is proven to exist.
Definition of land limitations for application of fertilizers; (3) Application of fertilizers is forbidden on steeply sloping ground; flooded ground; near water courses, groundwater abstraction wells and water reservoirs;
Calculation of balanced fertilizations considering inputs other than
fertili-zers; (4) Calculation of fertilizer application rates must include crop requirements and N in soil at planting,carried by irrigation water, from crop residues mineralization, in livestock effluent and chemical fertilizers;