PERFORMING RAILWAY TRAFFIC VIBRATION
FORECAST USING IN SITU VIBRATION
MEASUREMENTS
Vitor Rosão1, C. César Rodrigues2,3, Eusébio Conceição1
1
Faculdade de Ciências e Tecnologia da Universidade do Algarve
{ [email protected] ; [email protected] } 2
Instituto Superior de Engenharia de Lisboa
{ [email protected] } 3
MRA Instrumentação, S.A.
Abstract
As international normalized methods for performing railway traffic vibration prediction are not available yet, the authors of this paper will analyze the feasibility and applicability of an in situ vibration measurement method in accordance with the guidelines establish in ISO 14837-1. The authors will present the achieved results of several vibration measurements, performed near the railways and the related transfer functions that will allow predicting the vibrations near different receiver locations.
Keywords: Vibration Forecast; Vibration Measurements; Railway Traffic Vibrations.
1 Introduction
In this paper the vibration is characterized by each second RMS (Root Mean Square) value of vibration velocity and the maximum value associated with the event is used.
Such methodology follows reference [1] and reference [2].
INTERNOISE 2010 │ JUNE 13-16 │ LISBON │ PORTUGAL
And since in accordance with the requirements of ISO 14837-1 [3], the typical frequencies of interest for each of these effects are as follows:
1. 1Hz to 80 Hz.
2. 16Hz to 250 Hz.
3. 1Hz to 500 Hz.
4. 1Hz to 200 Hz
The determination of the total value of vibration associated with a particular event should only use the above frequency range of interest.
This study directs to the human disturbance due to vibration sensation and to human disturbance due to structural noise produced by vibration, so that will be analyzed, for each event, the frequency ranges 1 Hz to 80 Hz and 16Hz to 250Hz.
This constraint justifies the characterization of RMS values, more suitable for human disturbance [2] [4], instead of characterization of peak values, more suitable for the disruption of structures [5].
To determine the global value (vG) for the ranges 1 Hz to 80 Hz and 16 Hz to 250 Hz, there
are used the following equations, where vf corresponds to the vibration velocity of each
frequency band:
80 1 2 80 1 , f f Hz G v v (1)
250 16 2 250 16 , f f Hz G v v (2)2 Objectives
It is intended to evaluate the feasibility and applicability of a forecast method, based on the use of vibration attenuation factors, determined from in situ vibration measurements.
3 Method
To determine the vibration attenuation factors, the method uses:
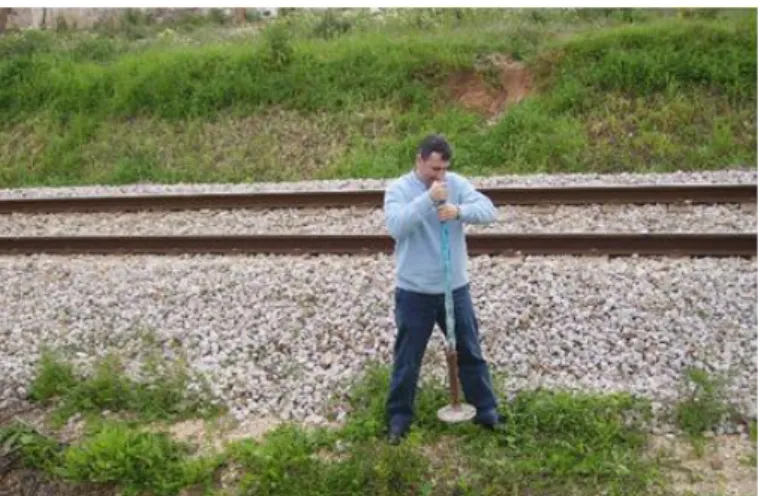
1. A mass, which is driven into the ground, to generate an impulse of vibration (Figure 1).
2. 2 vibrometers (Figure 2), with capacity for registration RMS values at every second, in the 1/3 octave bands between 1 Hz and 250 Hz, and able to detect values sufficiently small (ideally less than 0,001 mm/s), for simultaneous registration of the impulse of vibration at 2 points.
Figure 1 – Example of using mass to generate an impulse of vibration
Figure 2 – Example of a vibrometer consisting of an accelerometer and a signal analyzer When the impulse occurs, it is measured for each second the RMS value of vibration
velocity, on the 1/3 octave bands between 1 Hz and 250 Hz (vf) simultaneously at two points
(P1 and P2) at known distances (d1 and d2), and is found the maximum values (vmax,f)
associated with the impulse.
Assuming the following theoretical relationship between the vibration velocity in P1 and P2 [3]
[6]: f k P f P f d d v v 1 2 1 , max, 2 , max, (3)
One can determine the attenuation factors kf based on the following equation (applied to
INTERNOISE 2010 │ JUNE 13-16 │ LISBON │ PORTUGAL
The place of the impulse must coincide, or be as close as possible, to the place where the
new railway line is expected to be installed, P1 must coincide, or be as close as possible, to
the reference distances where the future vibration can be known, and P2 must coincide, or be
as close as possible, to where one wants to predict the vibration.
The test should be repeated at least 3 times and should be used, for security reasons, the maximum values of kf (kmax,f).
As these values correspond to attenuation factors for a point source, it is necessary to
transform them into attenuation factors for linear sources (Kline,f) using the following equation
(applied to each frequency band):
1 2 0 1 1 1 , max, 0 2 2 2 , max, , log log max , max , d d dx d x d v dx d x d v K l l k P f l l k P f f linear f f (5)Using a table of integrals [7], it appears that, in a generic way:
a
n
b
ax
dx
b
ax
n n1
1 for n -1 (6)Using this general equation and considering l = ∞, we can demonstrate the following
important relation: 5 , 0 max, ,f f linear k K (7)
4 Tests performed
The tests were carried out along the Railway Line in Algarve (Portugal) at the following 2 sites:
Site 1:
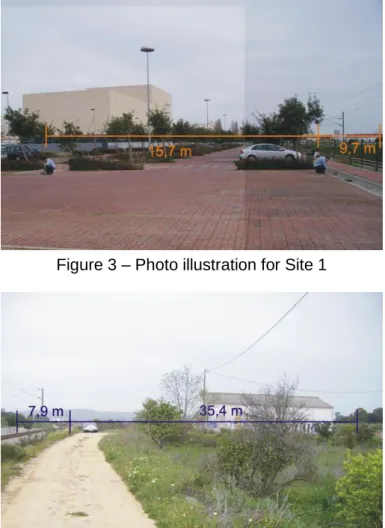
Next to the Teatro das Figuras in Faro, corresponding to a paved area where trains have lower velocity, given the proximity of the station (Figure 3).
Site 2:
In rural area, not paved, where trains have a higher velocity (Figure 4). Thus, Measurements belonged to two kinds of vibration sources:
Impulse induced: 1 mass of 13 kg (Figure 1).
Different trains running on the line.
Were used the following equipment:
1 vibrometer including an IMI 626A04 accelerometer and a signal analyzer Svantek
958.
1 vibrometer including a PCB 393B31 accelerometer and a signal analyzer Svantek
Figure 3 – Photo illustration for Site 1
Figure 4 – Photo illustration for Site 2
4.1 Impulse induced
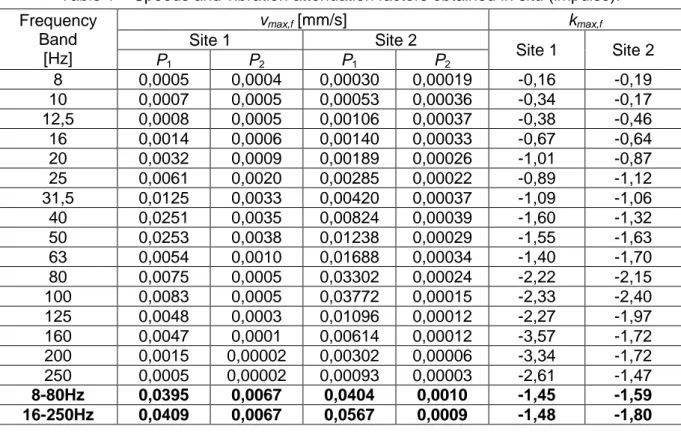
The results obtained for the vibration attenuation factors kmax are presented in Table 1. It is
noted that the mass and distances used only allow the vibrometers to distinguish the occurrence of the impulse for frequency bands greater than or equal to 8 Hz. However, such limitation is not a problem for the frequency range associated with normal passage of trains, as will be demonstrated on the next chapter.
INTERNOISE 2010 │ JUNE 13-16 │ LISBON │ PORTUGAL
Table 1 – Speeds and vibration attenuation factors obtained in situ (impulse). Frequency Band [Hz] vmax,f [mm/s] kmax,f Site 1 Site 2 Site 1 Site 2 P1 P2 P1 P2 8 0,0005 0,0004 0,00030 0,00019 -0,16 -0,19 10 0,0007 0,0005 0,00053 0,00036 -0,34 -0,17 12,5 0,0008 0,0005 0,00106 0,00037 -0,38 -0,46 16 0,0014 0,0006 0,00140 0,00033 -0,67 -0,64 20 0,0032 0,0009 0,00189 0,00026 -1,01 -0,87 25 0,0061 0,0020 0,00285 0,00022 -0,89 -1,12 31,5 0,0125 0,0033 0,00420 0,00037 -1,09 -1,06 40 0,0251 0,0035 0,00824 0,00039 -1,60 -1,32 50 0,0253 0,0038 0,01238 0,00029 -1,55 -1,63 63 0,0054 0,0010 0,01688 0,00034 -1,40 -1,70 80 0,0075 0,0005 0,03302 0,00024 -2,22 -2,15 100 0,0083 0,0005 0,03772 0,00015 -2,33 -2,40 125 0,0048 0,0003 0,01096 0,00012 -2,27 -1,97 160 0,0047 0,0001 0,00614 0,00012 -3,57 -1,72 200 0,0015 0,00002 0,00302 0,00006 -3,34 -1,72 250 0,0005 0,00002 0,00093 0,00003 -2,61 -1,47 8-80Hz 0,0395 0,0067 0,0404 0,0010 -1,45 -1,59 16-250Hz 0,0409 0,0067 0,0567 0,0009 -1,48 -1,80
4.2 Trains
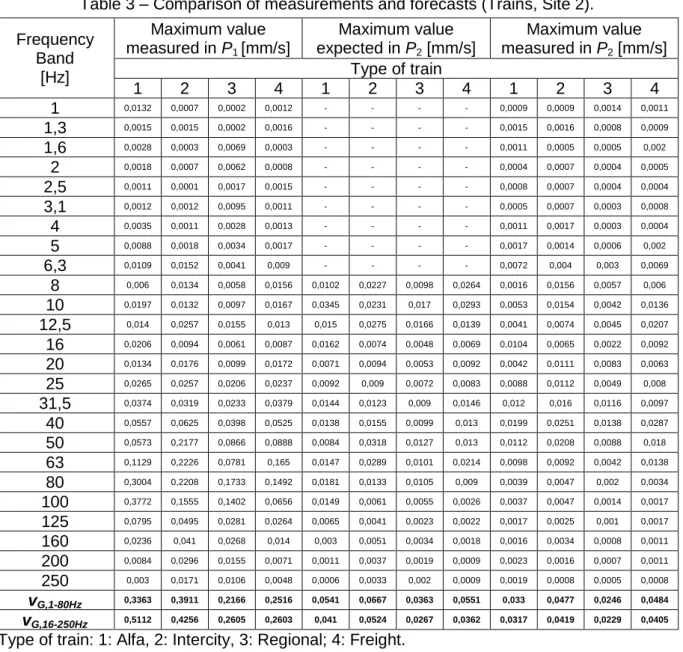
In Table 2 and Table 3 are presented the measured values in P1 due to passing trains, the
forecasted values in P2, based on attenuation factors determined by the method and
presented in Table 1 (corrected for linear attenuation factors), and the values actually
measured in P2 due to passing of trains, for Site 1 and Site 2.
Table 4 shows the differences between predictions and measurements.
In the graphs of Figure 5 and Figure 6 are shown the spectrum of vibration velocity of the
trains, at P1, for Site 1 and 2, being visible the irrelevance of the values associated with the
Table 2 – Comparison of measurements and forecasts (Trains, Site 1). Frequency Band [Hz] Maximum value measured in P1 [mm/s] Maximum value expected in P2 [mm/s] Maximum value measured in P2 [mm/s] Type of train 1 2 3 4 1 2 3 4 1 2 3 4 1 0,0077 0,0009 0,0011 0,0012 - - - - 0,0019 0,0037 0,0017 0,0009 1,3 0,0008 0,002 0,0025 0,0013 - - - - 0,0009 0,0016 0,0015 0,002 1,6 0,0005 0,0006 0,0005 0,0004 - - - - 0,0008 0,0013 0,0006 0,0005 2 0,001 0,001 0,0004 0,0004 - - - - 0,0008 0,0023 0,0004 0,0006 2,5 0,0007 0,0004 0,0007 0,0004 - - - - 0,0004 0,0023 0,0004 0,0004 3,1 0,0003 0,0006 0,0005 0,0003 - - - - 0,0003 0,0014 0,0004 0,0004 4 0,0006 0,0008 0,0002 0,0001 - - - - 0,0007 0,0006 0,0005 0,0005 5 0,0005 0,001 0,0005 0,0002 - - - - 0,0007 0,0011 0,0002 0,0012 6,3 0,0006 0,0011 0,0006 0,0004 - - - - 0,0004 0,0005 0,0004 0,0022 8 0,0008 0,0007 0,0008 0,0003 0,0011 0,0006 0,0007 0,0003 0,0006 0,001 0,0002 0,0016 10 0,0012 0,0024 0,001 0,0005 0,0014 0,0028 0,0012 0,0006 0,0006 0,0021 0,0007 0,0009 12,5 0,0018 0,003 0,0013 0,0028 0,002 0,0034 0,0015 0,0031 0,0009 0,0041 0,0044 0,0036 16 0,0035 0,005 0,0093 0,0019 0,003 0,0042 0,0079 0,0016 0,0015 0,007 0,0029 0,0067 20 0,0123 0,0154 0,0089 0,0144 0,0075 0,0094 0,0054 0,0087 0,0062 0,0069 0,0098 0,0154 25 0,0298 0,0668 0,0961 0,0552 0,0203 0,0456 0,0656 0,0377 0,0139 0,0216 0,0265 0,0319 31,5 0,0748 0,0985 0,1213 0,0825 0,042 0,0553 0,0681 0,0463 0,0239 0,0531 0,0362 0,0334 40 0,0724 0,119 0,1301 0,0666 0,0247 0,0406 0,0444 0,0227 0,0133 0,0257 0,0275 0,0073 50 0,0446 0,0847 0,0608 0,0365 0,016 0,0303 0,0218 0,0131 0,0187 0,0104 0,0256 0,005 63 0,0419 0,072 0,0591 0,0571 0,0174 0,0298 0,0245 0,0237 0,0094 0,0037 0,0104 0,0013 80 0,0247 0,0931 0,1255 0,0688 0,0046 0,0173 0,0233 0,0128 0,0017 0,0021 0,0059 0,0013 100 0,0145 0,0641 0,0971 0,0377 0,0024 0,0107 0,0162 0,0063 0,0013 0,0019 0,004 0,0008 125 0,005 0,0108 0,0192 0,0068 0,0009 0,0019 0,0034 0,0012 0,0006 0,0012 0,0012 0,0002 160 0,0048 0,0059 0,0126 0,0051 0,0002 0,0003 0,0006 0,0003 0,0005 0,001 0,0005 0,0001 200 0,0025 0,0047 0,0095 0,0052 0,0002 0,0003 0,0006 0,0003 0,0002 0,0007 0,0002 0,0001 250 0,0007 0,0015 0,0054 0,0048 0,0001 0,0002 0,0007 0,0006 0,0001 0,0002 0,0002 0,0001 vG,1-80Hz 0,1277 0,2228 0,253 0,1544 0,0586 0,095 0,1124 0,0712 0,0378 0,065 0,0608 0,0503 vG,16-250Hz 0,1285 0,2322 0,2721 0,1593 0,0586 0,0955 0,1136 0,0714 0,0378 0,0646 0,0607 0,05
INTERNOISE 2010 │ JUNE 13-16 │ LISBON │ PORTUGAL
Table 3 – Comparison of measurements and forecasts (Trains, Site 2). Frequency Band [Hz] Maximum value measured in P1 [mm/s] Maximum value expected in P2 [mm/s] Maximum value measured in P2 [mm/s] Type of train 1 2 3 4 1 2 3 4 1 2 3 4 1 0,0132 0,0007 0,0002 0,0012 - - - - 0,0009 0,0009 0,0014 0,0011 1,3 0,0015 0,0015 0,0002 0,0016 - - - - 0,0015 0,0016 0,0008 0,0009 1,6 0,0028 0,0003 0,0069 0,0003 - - - - 0,0011 0,0005 0,0005 0,002 2 0,0018 0,0007 0,0062 0,0008 - - - - 0,0004 0,0007 0,0004 0,0005 2,5 0,0011 0,0001 0,0017 0,0015 - - - - 0,0008 0,0007 0,0004 0,0004 3,1 0,0012 0,0012 0,0095 0,0011 - - - - 0,0005 0,0007 0,0003 0,0008 4 0,0035 0,0011 0,0028 0,0013 - - - - 0,0011 0,0017 0,0003 0,0004 5 0,0088 0,0018 0,0034 0,0017 - - - - 0,0017 0,0014 0,0006 0,002 6,3 0,0109 0,0152 0,0041 0,009 - - - - 0,0072 0,004 0,003 0,0069 8 0,006 0,0134 0,0058 0,0156 0,0102 0,0227 0,0098 0,0264 0,0016 0,0156 0,0057 0,006 10 0,0197 0,0132 0,0097 0,0167 0,0345 0,0231 0,017 0,0293 0,0053 0,0154 0,0042 0,0136 12,5 0,014 0,0257 0,0155 0,013 0,015 0,0275 0,0166 0,0139 0,0041 0,0074 0,0045 0,0207 16 0,0206 0,0094 0,0061 0,0087 0,0162 0,0074 0,0048 0,0069 0,0104 0,0065 0,0022 0,0092 20 0,0134 0,0176 0,0099 0,0172 0,0071 0,0094 0,0053 0,0092 0,0042 0,0111 0,0083 0,0063 25 0,0265 0,0257 0,0206 0,0237 0,0092 0,009 0,0072 0,0083 0,0088 0,0112 0,0049 0,008 31,5 0,0374 0,0319 0,0233 0,0379 0,0144 0,0123 0,009 0,0146 0,012 0,016 0,0116 0,0097 40 0,0557 0,0625 0,0398 0,0525 0,0138 0,0155 0,0099 0,013 0,0199 0,0251 0,0138 0,0287 50 0,0573 0,2177 0,0866 0,0888 0,0084 0,0318 0,0127 0,013 0,0112 0,0208 0,0088 0,018 63 0,1129 0,2226 0,0781 0,165 0,0147 0,0289 0,0101 0,0214 0,0098 0,0092 0,0042 0,0138 80 0,3004 0,2208 0,1733 0,1492 0,0181 0,0133 0,0105 0,009 0,0039 0,0047 0,002 0,0034 100 0,3772 0,1555 0,1402 0,0656 0,0149 0,0061 0,0055 0,0026 0,0037 0,0047 0,0014 0,0017 125 0,0795 0,0495 0,0281 0,0264 0,0065 0,0041 0,0023 0,0022 0,0017 0,0025 0,001 0,0017 160 0,0236 0,041 0,0268 0,014 0,003 0,0051 0,0034 0,0018 0,0016 0,0034 0,0008 0,0011 200 0,0084 0,0296 0,0155 0,0071 0,0011 0,0037 0,0019 0,0009 0,0023 0,0016 0,0007 0,0011 250 0,003 0,0171 0,0106 0,0048 0,0006 0,0033 0,002 0,0009 0,0019 0,0008 0,0005 0,0008 vG,1-80Hz 0,3363 0,3911 0,2166 0,2516 0,0541 0,0667 0,0363 0,0551 0,033 0,0477 0,0246 0,0484 vG,16-250Hz 0,5112 0,4256 0,2605 0,2603 0,041 0,0524 0,0267 0,0362 0,0317 0,0419 0,0229 0,0405
Type of train: 1: Alfa, 2: Intercity, 3: Regional; 4: Freight.
Table 4 – Differences between predictions and measurements (global values). Site
(vGexpected – vGmeasured)/vGmeasured
Alfa Pendular Intercity Regional Freight
1-80Hz 16-250Hz 1-80Hz 16-250Hz 1-80Hz 16-250Hz 1-80Hz 16-250Hz
1 55% 55% 46% 48% 85% 87% 42% 43%
Figure 5 – Spectrum of vibration velocity of trains in P1 (Site 1)
INTERNOISE 2010 │ JUNE 13-16 │ LISBON │ PORTUGAL
5 Conclusions
The analysis of the previous tables shows that, overall, the estimates are mostly higher than the measurements, which put us in a position of safety.
The deviations found in terms of significant global values range between -11% and 87%. These deviations may seem high, but are of the order of magnitude of the deviations found when using the calculation of attenuation factors corresponding to the passage of a particular train - without the correction of linear source - to predict the values corresponding to the passage of other trains, which demonstrates the suitability of the method and the difficulty of obtaining more precise methods.
Acknowledgments
The authors thank the following entities and persons:
MRA Instrumentação: the availability of Svantek analyzer 958 and IMI 626A04
accelerometer.
SCHIU, Engenharia de Vibração e Ruído: the availability of Svantek analyzer 946A
and PCB 393B31 accelerometer.
Carlos Alberto Rosado: the availability of mass used for the impulse of vibration.
Zélia Ramos and João Rosado: assistance in the measurements.
References
[1] Schiappa, F.; Patrício, J.. Annoyance and damage in buildings caused by vibrations. Considerations for a vibration control good practice. Guimarães, Acústica 2004.
[2] United States of America Federal Transit Administration. Transit noise and vibration impact assessment. 2006.
[3] ISO, International Standard 14837-2: Mechanical vibration. Ground-borne noise and vibration arising from rail systems. Part 1. General guidance. 2005.
[4] ISO, International Standard 2631-1: Mechanical vibration and shock. Evaluation of human exposure to whole-body vibration. Part 1: General requirements. 1997.
[5] ISO/DIS, Draft International Standard 4866: Mechanical vibration and shock. Vibration of fixed structures. Guidelines for the measurement of vibrations and evaluation of their effects on structures. 2009.
[6] Suhairy, Sinan Al. Prediction of ground vibration from railways. Swedish National Testing and Research Institute. 2000.
![Table 2 – Comparison of measurements and forecasts (Trains, Site 1). Frequency Band [Hz] Maximum value measured in P1 [mm/s] Maximum value expected in P2 [mm/s] Maximum value measured in P2 [mm/s] Type of train 1 2 3 4 1 2 3 4 1 2 3 4](https://thumb-eu.123doks.com/thumbv2/123dok_br/18833424.928181/7.892.109.789.134.784/comparison-measurements-forecasts-frequency-maximum-measured-maximum-expected.webp)