A Knowledge Management Project
for the Sustainable Growth
of a Workforce Management Team
Tiago Dias Carvalho
Master’s Dissertation
Supervisor: Maria Teresa Peixoto Braga Bianchi de Aguiar
Mestrado Integrado em Engenharia e Gest˜
ao Industrial
Abstract
With the increased competition and significant growth in the complexity of operations, knowl-edge management becomes a central issue for a growing business. The present dissertation focuses on a workforce management team from a luxury apparel retailer, Farfetch, which after 9 years of existence continues to expand. This project aims at the creation of a knowledge management infrastructure and the improvement of the knowledge sharing routines of this team.
For the creation of knowledge management infrastructure, a set of requirements were identified that served as a term of comparison between several platforms. After identifying the best option for the team, a platform structure has been developed that incorporates all the different knowledge themes that the team needs to manage. Associated with these themes are standard templates so that the pages of the platform are easy to create and that they maintain a consistency, regardless of its author. The team received training on how to upgrade the platform and about 80 pages were created. The creation of these pages has also revealed opportunities for improvement in terms of metrics consistency and process efficiency.
In parallel, the team meetings were restructured, in order to guarantee a greater efficiency of time and a better knowledge transfer. These improvements were possible with the introduction of daily meetings supported by a kaizen framework, greater transparency of the work of different team members by and a greater focus on problem solving.
As a result of this project, opportunities for improvement have emerged. First, the need to complement time-related metrics for solving a customer problem was detected. A new metric has been studied and recommended to company executives who included it in the weekly reports. In addition, a project prioritisation tool was created to ensure that working time is being used to the best of its ability.
The cases presented clearly demonstrate the need to ensure the continuity of the implemented knowledge management initiatives and to continue to explore opportunities for improvement in the team processes that they reveal.
Resumo
Com o aumento da competi¸c˜ao e com o crescimento significativo da complexidade das opera¸c˜oes, a gest˜ao de conhecimento torna-se um tema fulcral para uma empresa em expans˜ao. A presente disserta¸c˜ao foca-se numa equipa de gest˜ao de for¸ca laboral de uma empresa de venda de roupa de luxo online, a Farfetch, que ap´os 9 anos de existˆencia continua a expandir-se. Deste projeto resulta a cria¸c˜ao de uma infraestrutura de gest˜ao de conhecimento e a melhoria de rotinas de partilha de conhecimento desta equipa.
Para a cria¸c˜ao da infraestrutura de gest˜ao de conhecimento foram levantados requisitos que serviram como termo de compara¸c˜ao entre v´arias plataformas. Ap´os identificar a melhor op¸c˜ao para a equipa, desenvolveu-se a estrutura da plataforma que incorpora todos os diferentes temas de conhecimento que a equipa necessita de gerir. Associados a estes temas est˜ao modelos base para que as p´aginas da plataforma sejam f´aceis de criar e para que estas mantenham uma consistˆencia, independentemente do seu autor. A equipa recebeu sess˜oes de forma¸c˜ao sobre como atualizar a plataforma e cerca de 80 p´aginas foram criadas. A cria¸c˜ao destas p´aginas revelou tamb´em oportunidades de melhoria em termos de consistˆencia de m´etricas e eficiˆencia de processos.
Em paralelo, as reuni˜oes da equipa foram restruturadas, de forma a garantir uma maior eficiˆencia de tempo e uma melhor efic´acia na passagem de conhecimento. Estas melhorias foram poss´ıveis devido `a introdu¸c˜ao de reuni˜oes di´arias suportadas com um quadro kaizen, maior transparˆencia do trabalho de diferentes membros da equipa e um maior foco na resolu¸c˜ao de problemas.
Como resultado deste projeto, surgiram oportunidades de melhoria. Em primeiro lugar, foi detetada a necessidade de complementar as m´etricas relacionadas com o tempo de resolu¸c˜ao de um problema dos clientes. Uma nova m´etrica foi estudada e recomendada aos quadros da empresa que a incluiram nos relat´orios semanais. Para al´em disso, foi criada uma ferramenta de prioritiza¸c˜ao de projetos, de forma a garantir que o tempo de trabalho est´a a ser usado da melhor forma poss´ıvel. Os casos apresentados demonstram claramente a necessidade de garantir a continuidade das inciativas de gest˜ao de conhecimento implementadas e de continuar a explorar oportunidades de melhoria nos revelados processos da equipa.
Acknowledgements
Since I am faced with the herculean task of putting into words a proper acknowledgement for these people I could not help it but to write it in their own native language. In the words of Nelson Mandela: "If you talk to a man in a language he understands, that goes to his head. If you talk to him in his language, that goes to his heart."
Gostaria de come¸car por agradecer a quem mais diretamente esteve envolvido neste projeto. `
A Farfetch, pela oportunidade de realizar este projeto. Ao meu orientador, Nuno Carvalho, pela passagem de conhecimento, pela tua paciˆencia e pelo teu apoio constante. Ao Andr´e Leit˜ao, por me dares a liberdade de atacar novos desafios. Agrade¸co tamb´em `a minha orientadora da FEUP, a professora Teresa Bianchi de Aguiar, pelos seu discurso motivador, pelos seus bons conselhos e corre¸c˜ao minunciosa.
Um enorme obrigado aos meus pais por me trazerem ao mundo. `A minha M˜ae, por me saberes ler sem eu falar, por me mandares mensagens todos os dias e por n˜ao perceberes que j´a tenho 23 anos. Ao meu Pai, por nunca esperares menos de mim do que eu poderia ser, por sempre acreditares que eu sabia qual era o meu caminho e pela tua bondade genuina e inocente, mesmo neste ano t˜ao chato.
`
A minha av´o Geninha, por me dares a sopa de joelhos e me lembrares para ter ju´ızo e ao meu avˆo Toninho por seres o meu her´oi. `A minha av´o Nini, por tentares sempre ser tu a fazer tudo por mim. `A minha tia S´onia, por nunca me deixares ser cromo. `As minhas primas Beatriz e Leonor, por acharem que eu sou o maior.
Aos meus irm˜aos e amigos: David Ara´ujo, Dinis Santos, Diogo Almeida, Francisco Ant˜ao, Francisco Estev˜ao, Hugo Pena, Jo˜ao Andr´e, Jo˜ao Fernandes, Rodrigo Valente, Tiago Costa e Tom´as Tavares. Tentei descrever como seria a vida sem vocˆes, mas j´a nem a consigo imaginar.
Aos meus amigos de faculdade, pelas manh˜as, tardes e noites de estudo e pelas tardes, noites e manh˜as de festa.
Не можам да завршам без да се заблагодарам на моjата кралица, Дариjа. Иако се обидувам секоj ден да и кажам колку многу ми значи, зборовите никогаш нема да бидат доволни. Ти благодарам за твоjата бесконечна и безусловна љубов и тоа што никогаш не ме оставаш да бидам тажен или мрзелив. Буци, те сакам наjмногу.
Tiago Dias Carvalho
Contents
1 Introduction 1
1.1 Farfetch . . . 1
1.2 The Workforce Management Team . . . 2
1.3 Project Motivation . . . 3
1.4 Goals . . . 3
1.4.1 Improving the Explicit Knowledge Management . . . 3
1.4.2 Improving the Tacit Knowledge Management . . . 4
1.5 Methodology . . . 4
1.6 Dissertation Structure . . . 4
2 Literature Review 5 2.1 Knowledge . . . 5
2.1.1 Data, Information and Knowledge . . . 5
2.1.2 Tacit and Explicit Knowledge . . . 6
2.2 Knowledge Management . . . 7
2.2.1 Benefits for Companies . . . 7
2.2.2 Knowledge Management Systems . . . 7
2.2.3 Standardization . . . 8
2.2.4 Ownership . . . 8
2.2.5 Measuring Success . . . 9
2.2.6 Dangers of Knowledge Management . . . 9
2.3 Organizational Culture in Knowledge Management . . . 10
2.3.1 Values, Norms and Practices . . . 10
2.3.2 Influence of Culture in Knowledge Management . . . 10
2.3.3 Cooperation of Groups . . . 10
2.3.4 Incentives for Knowledge Sharing . . . 11
2.3.5 The Role of Management in Shaping the Organizational Culture . . . 11
2.4 Effective Team Meetings . . . 12
2.5 Daily Kaizen . . . 13
2.6 Priority Management . . . 14
2.6.1 The Scoring Method . . . 15
2.6.2 The Analytic Hierarchy Process . . . 16
3 Problem Overview 18 3.1 The Workforce Management Team . . . 18
3.1.1 Forecast and Staffing . . . 19
3.1.2 Scheduling . . . 19
3.1.3 Real Time Management . . . 19
3.1.4 Reporting and Data Analysis . . . 20
3.1.5 Workforce Management Optimisation . . . 20
3.2 Problem Statement . . . 20
3.2.1 Data Validation for Projects . . . 20
3.2.2 Prioritisation of Projects . . . 21
3.2.3 Reporting . . . 22 v
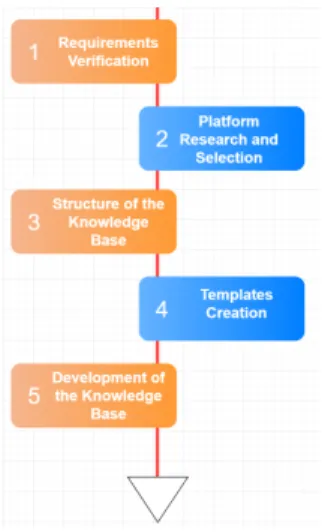
vi CONTENTS 3.2.4 Knowledge Management . . . 23 3.2.5 Meetings . . . 23 3.2.6 Analysts Separation . . . 26 3.2.7 The Future . . . 27 4 Implemented Solution 28 4.1 Knowledge Base Platform . . . 28
4.1.1 Requirements Verification . . . 28
4.1.2 Platform Research and Selection . . . 30
4.1.3 Structure of the Knowledge Base . . . 31
4.1.4 Templates Creation . . . 33
4.1.5 Development of the Knowledge Base . . . 37
4.2 Improvement Points . . . 37
4.2.1 Incoherences Mitigation . . . 38
4.2.2 Processes Optimisation . . . 38
4.2.3 Introduction of a New Metric . . . 39
4.3 Meetings’ Structure . . . 40
4.3.1 Team Meetings . . . 40
4.3.2 Analysts Weekly Meeting . . . 42
4.3.3 Kaizen Meeting . . . 44
4.4 Priority Management . . . 46
5 Conclusions and Future Work 48 5.1 Knowledge Base, Incoherences and Processes Optimisation . . . 48
5.2 The New Metric . . . 49
5.3 Analsyts’ Meetings . . . 49
5.4 Team Meetings . . . 49
5.5 Involvement in the Strategic Process of the Projects . . . 50
5.6 Priority Management . . . 50
5.7 Analysts Separation . . . 51 A Further Description of Farfetch’s Business Units 56 B The Customer Service Daily Report 57
Acronyms and Symbols
AHP Analytic Hierarchy Process CS Customer Service
DS Delivery Support EV Earned Value FRT Full Resolution Time KPI Key Performance Indicator PS Partner Service
PV Planned Value
SPI Scheduled Performance Index WFM Workforce Management
List of Figures
1.1 Farfetch’s Organisational Diagram. . . 2
3.1 The Workforce Management Cycle. . . 18
3.2 The Freedcamp Platform. . . 21
3.3 The levels of priority in Freedcamp. . . 21
3.4 Daily Performance Report for the Customer Service Team. . . 22
3.5 An example of the files previously used for Knowledge Management. . . 23
3.6 The Template for the Team Meeting at the Beginning of the Project. . . 24
3.7 The old template for the analysts’ meeting. . . 26
3.8 Distribution of the WFM Analysts (light blue) and of the WFM team (dark blue). 26 4.1 Knowledge Base Platform’s Flowchart. . . 28
4.2 Comparison Between the Different Platforms. . . 31
4.3 The Structure of the Knowledge Base. . . 32
4.4 The Page "How to Add an Anchor" of the Getting Started Section. . . 32
4.5 The Page "Status of a Ticket" of the General Section. . . 33
4.6 Metrics’ Template - Main Metrics. . . 34
4.7 Metrics’ Template - Children Metrics . . . 34
4.8 Application of the Metrics Template - Part 1. . . 35
4.9 Application of the Metrics Template - Part 2. . . 35
4.10 The Reports’ Template. . . 36
4.11 The How-To Send an E-mail Template. . . 37
4.12 The Processes Template. . . 37
4.13 The Incoherences Spreadsheet. . . 38
4.14 The Distribution of the %RT3 Metric. . . 40
4.15 The Planning Slide of the New Template for the Team Meeting. . . 41
4.16 The Team Meeting Feedback Form. . . 41
4.17 The new template for the Analysts’ Meeting. . . 43
4.18 The Confluence Space for the Analysts’ Meeting. . . 43
4.19 The Analysts’ Daily Kaizen Board. . . 45
4.20 The Current Draft of the Team’s Kaizen Board. . . 46
4.21 The File Used to Prioritise Projects. . . 47
4.22 The File Used to Determine the Criteria’s Weight. . . 47
B.1 The Customer Service Daily Report . . . 58
List of Tables
2.1 Prioritisation Matrix’s Template . . . 15 2.2 Saaty’s scale . . . 16
Chapter 1
Introduction
Knowledge management is generally accepted as something that brings value to any company, regardless of the field. However, in most cases, only the operational work gets attention form the employees and knowledge management is not followed through with the consistency it requires.
The present dissertation arises from a compelling need to improve the knowledge management of the workforce management team of the online luxury fashion company Farfetch. In this context, the project will approach the creation of a technical infrastructure where knowledge can be stored and the development of knowledge sharing routines.
1.1
Farfetch
Farfetch is an online fashion retail platform based in London and founded in 2007 by the portuguese entrepreneur Jos´e Neves. In 2015 the company joined a restricted group of startups designated by "unicorns" after being valued at over 1 billion dollars. Currently Farfetch is a truly worldwide company, selling products from over 700 boutiques to customers located in 190 countries and employing over 2000 people throughout its 11 offices across the globe.
Farfetch has four different business units: Black & White, Browns, Store of the Future and, the most commonly known, farfetch.com.
Black & White is a full-service agency, providing multichannel e-commerce white-label solutions to luxury fashion brands, based on Farfetch’s core systems and services. Browns is a boutique acquired by Farfetch in 2015 that apart from working as a retailer, allows Farfetch to trial its technology. Browns is closely connected with Store of the Future, which is the business unit that develops such technology. Further elaboration regarding these business units can be found in the appendix A.
Farfetch.com is the portal in which the luxury fashion products are displayed and sold to the final customers. Behind the website there is a whole structure (presented in the next subtopic) to provide the best experience to Farfetch’s clients, which are not only the costumers, but also the brands and boutiques. This will be the business unit in which this dissertation will focus on.
Farfetch operates in both the B2B segment, dealing with brands and boutiques, and also in the B2C segment, represented by the individual customers and these relationships have to be beneficial for all parties. The customers get to shop at one single address and buy from a lot of different boutiques, some of which would not be reachable otherwise. The boutiques are provided
2 Introduction
with online marketing, a web platform to display their products at a global stage, the production process of having the images of their products online, customer support services, delivery services, solutions for payments and fraud checking. This means that independent retailers can boost their position in the market while maintaining their identity.
As a result from providing these services, Farfetch gets commissions for each sale without having to hold inventory since the boutiques are the owners of the products. This allows for scalability and Farfetch benefit from economies of scale, which is the main reason why the boutiques could not have the same services individually at similar price points. However, this also means that Farfetch is responsible for handling a delivery service with many stock points (the same products can be shipped from different boutiques), which makes it hard to control stock. Moreover, the standards for the quality of service are especially high since the luxury field so demands and one mistake can affect hundreds of boutiques.
1.2
The Workforce Management Team
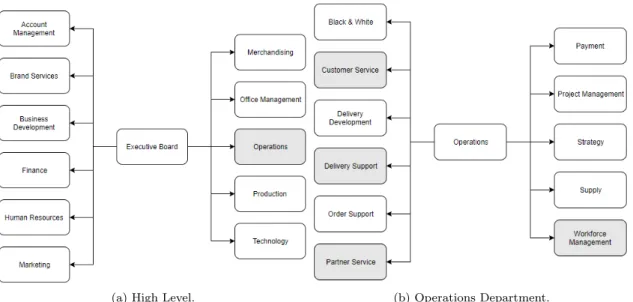
Farfetch is divided into eleven departments as seen in the part (a) of Figure 1.1. The Operations department, highlighted in grey, is constituted by eleven teams, of which four are relevant for this project. These teams (workforce management, customer service, delivery support and partner service) are highlighted in the part (b) of Figure 1.1.
(a) High Level. (b) Operations Department.
Figure 1.1: Farfetch’s Organisational Diagram.
The dissertation will mainly focus on the Workforce Management Team (WFM), which supports other teams through workload forecasting, capacity planning, working hours scheduling, real time management, data analysis and reporting. The teams directly supported are the teams of Customer Service (CS), Partner Service (PS) and Delivery Support (DS). In a situation where there is a need to refer one of these teams and not any in particular, for simplicity sake they will be referred as business related teams. Each of the analysts of the WFM team works directly with one of these teams.
1.3 Project Motivation 3
The Customer Service Team deals with any issues regarding the end consumers. It provides support in more than 10 different languages, through e-mails, phone calls or social media interac-tions. The Partner Service team interacts with the partner boutiques and brands, guiding them to provide the best experience for the customers and also to support them as Farfetch’s clients. The Delivery Support team communicates with the transportation couriers in order to solve problems regarding shipments or returns.
The managers of these teams are the ones more focused on the strategic work and the ones who work more closely with the Workforce Management team in optimisation projects. On the other hand, the agents of these teams are the people responsible for answering the clients’ queries and solving their problems. Their work can be through incoming and outgoing phone calls or through written dialogue.
1.3
Project Motivation
To keep up with the very fast growth of Farfetch, the Workforce Management team had to focus more on operational work and knowledge management was not properly done.
The main concern comes to the level of reporting and data analysis. Due to the lack of metric definition, metrics started being calculated differently for the different business related teams. Without any place to check what the metrics were really calculating, this caused confusion to the external users and invalidated any cross-team performance measurement.
Besides that, the lack of standardisation made the differences between the analysts’ work more complex. This means that it was more difficult for them to fill in and assure reporting for another business related team, in times when the main responsible was absent.
In general, for the team, the visibility of each others’ work was very limited, which reduced the opportunities for people to help each other out. This was critical in times when a person was developing the same thing which had been previously created by another person and therefore was unintentionally generating duplicated work.
With the growth of the team (11 in the beginning of September to 16 by the end of the year), effective knowledge sharing became more challenging, so knowledge management was needed more than ever to assure a sustainable growth.
1.4
Goals
This project aims to create a knowledge management system for the workforce management team and can be divided into two categories. The first category concerns explicit knowledge management and relates to documentation whereas the second category deals with tacit knowledge includes communication related goals.
1.4.1
Improving the Explicit Knowledge Management
The main goal regarding the explicit knowledge management is to have a functioning knowledge management platform, where any important information would be stored. This platform should be able to assure the data governance of the metrics measured by the team, to provide a clear explanation of what is shown in the reports created and to store how-to guides for the team’s
4 Introduction
processes. Besides, it is crucial that the platform is built in a way that ensures its sustainability so that it continues to be used after the end of the project.
These points should guarantee that the metrics and the reports are more standardised and therefore clearer for their users so that the team members can better support each other at an operational level in times of need.
1.4.2
Improving the Tacit Knowledge Management
Regarding the tacit knowledge, the main goal is to improve the communication within the team to share insights that can benefit the workflows. One expected outcome is to obtain a better functioning of the weekly team meetings, that increases the visibility of the work of the members of the team.
The analysts’ communication will be targeted in specific, in order to make them more comfort-able with the information of every business related team and to reduce duplicated work.
1.5
Methodology
As knowledge management impacts the processes indirectly, it is complicated to measure results associated with such projects. Therefore, in order to guarantee the success of this dissertation, the implemented solutions are highly based on the information gathered during the literature review. Another important focus of this project is the sustainability of the tools created. Therefore, an iterative approach was chosen, where the main driver for the fine-tuning of the tools was the feedback from the team members, which increased their acceptance. Moreover, training was provided to the team members to guarantee that they had the skills to use the tools after the project ended.
1.6
Dissertation Structure
The content of this dissertation is structured as follows.
Chapter 2 presents the state of the art of the main themes addressed: Knowledge, Knowledge Management, Organizational Culture in Knowledge Management, Effective Team Meetings and Priority Management.
Chapter 3 describes in detail the Workforce Management team and an analysis of the main problems of the workforce management team that negatively impact a successful knowledge man-agement.
Chapter 4 explains the progresses made with this project by showcasing the methodologies used and the final implemented solutions.
Chapter 5 concludes the dissertation. It suggests focus areas for future work that can further impact the knowledge management success in the Workforce Management team.
Chapter 2
Literature Review
The present chapter provides a general review on knowledge management, team meetings and priority management, in order to better understand the importance of these themes and to present some of the work developed in these areas. In section 2.1 the concept of knowledge will be studied and a distinction will be made between explicit and tacit knowledge. Section 2.2 focuses on the topic of knowledge management and what is necessary for a successful implementation and section 2.3 evaluates the impact of the organisational culture in these initiatives. In section 2.4, several good practices on how to hold effective team meetings will be presented and in section 2.5 there will be a deeper focus on the daily kaizen philosophy. Finally, in section 2.6 the importance of priority management will be described and two methodologies will be studied.
2.1
Knowledge
2.1.1
Data, Information and Knowledge
Before understanding the concept of knowledge management, one must first understand the concept of knowledge itself. Even though knowledge is a commonly used term, the distinction between data, information and knowledge is seldom made (Ackoff, 1999).
Data can be described as "symbols that represent the properties of objects and events" (Ackoff, 1999) or simply as raw numbers and unstructured facts (Vance, 1997). Due to its nature, data is considered to have the least impact for a typical manager (Thierauf, 1999).
Information also represents properties of objects and events and therefore is nothing more than data structure-wise (Ackoff, 1999). What makes it more valuable is that information is already contextualized, categorized, calculated and condensed (Davenport and Prusak, 2000). Thus, infor-mation can be seen as data with relevance and purpose (Bali and Lehaney, 2009) and can already provide answers to questions starting with who, what, when, where or how many (Ackoff, 1999).
Knowledge is "a fluid mix of framed experiences, values, contextual information, expert in-sight, and grounded intuition that provides an environment and framework for evaluating and incorporating new experiences and information" (Gamble and Blackwell, 2001). It is the most action-oriented out of the previous concepts and is capable of solving how-to problems through instructions (Ackoff, 1999). Knowledge can be kept in organizations not only in documents or repositories but also through routines, practices and norms (Gamble and Blackwell, 2001).
6 Literature Review
In another definition, knowledge is seen as "personalized information (which may or may not be new, unique, useful, or accurate) related to facts, procedures, concepts, interpretations, ideas, observations, and judgments" (Tuomi, 1999). Knowledge is always subject to the individual’s previous experiences and is molded according to how its owner evaluates the inputs from his/her own surroundings (Davenport and Prusak, 2000). Due to this degree of personalisation, knowledge cannot be found outside of an individual (Tuomi, 1999).
Even though the commonly assumed hierarchy goes from data to knowledge, it is interesting to study the inverse logic. If knowledge is bound to a person, then knowledge must exist before information can be formulated or data measured. In this case, knowledge is seen as the first block of the chain and only after it is articulated and structured, can it become information, which consequently is assigned a fixed representation, becoming data. This philosophy rejects the idea of "raw data" as data is always dependent of some previous process (Tuomi, 1999).
2.1.2
Tacit and Explicit Knowledge
Authors often differentiate between different perspectives of knowledge. Most commonly, this distinction is made between explicit and tacit knowledge.
The explicit dimension of knowledge is formalized and codified (Brown and Duguid, 1999) and is communicated verbally, through writing or through drawings and symbols (Polanyi, 1975). This kind of knowledge is rather simple to identify, store and retrieve (Wellman, 2009) and is associated with the concept of "know-what" (Brown and Duguid, 1999). Explicit knowledge is usually found in databases, memos, notes or documents (Botha and Snyman, 2008). For example, an owner’s manual that explains how to properly operate an electronic product contains explicit knowledge (Nonaka, 1994).
On the other hand, tacit knowledge refers to knowledge that is harder to define or to transfer because it is largely dependent of its involving context and has a personal nature (Nonaka, 1994). This perspective of knowledge is only found in the minds of human stakeholders (Botha and Snyman, 2008). This type of knowledge is comprised of cognitive and technical elements. The former consist of mental maps, cultural beliefs, values, attitudes, paradigms and viewpoints, while the latter is composed of concrete crafts and skills, capabilities and expertise to apply on a specific context (Botha and Snyman, 2008). One example of tacit knowledge is knowing how to read a customer and using the correct methodology to approach him/her based on that analysis (Nonaka, 1994). This perspective is often linked to the concept of "know-how" (Brown and Duguid, 1999). Several authors see explicit knowledge as simpler in a way that is not able to carry the richness of the know-how experience that is capable of creating deep-rooted competitive advantage. (Bukowitz and Williams, 1999; Cook and Brown, 1999) Tacit knowledge is seen as more likely to spark breakthroughs in the organization (Wellman, 2009) through thoughts that are more "inconsistent" than "rational" (Hedlund, 1994). Therefore, its absence can result in a deficient capability for innovation (Gamble and Blackwell, 2001). The few that suggest otherwise put a great deal of focus on the impact that technology can have in storing and spreading knowledge, favouring technology enabled knowledge management processes (Bohn, 1994).
However, the discussion of which perspective is more important is not paramount because they are both mutually dependent and reinforcing. Tacit knowledge builds the background needed for creating a structure that is able to interpret and develop explicit knowledge (Polanyi, 1975).
2.2 Knowledge Management 7
In fact, knowledge should be seen as a spectrum rather than just two defining points, where all elements are at some level a mixture of both explicit and tacit knowledge (Botha and Snyman, 2008).
Due to the complexity of the knowledge concept, it is not achievable to find one single perfect knowledge management system or to have a perfect approach to knowledge management. It is instead necessary to accommodate a variety of solutions that complement each other (Alavi and Leidner, 1992).
2.2
Knowledge Management
2.2.1
Benefits for Companies
Companies always thrive to have assets that can give them a competitive advantage. However, an asset is only the source of a competitive advantage if it is scarce and hard to replicate (Barney, 1991).
Resources associated with knowledge are socially complex and difficult to copy, which makes them assets with potential to create long-term sustainable competitive advantage (Alavi and Lei-dner, 1992). As a matter of fact, the point of knowledge management is to help the organization to compete by collecting and leveraging the collective knowledge (von Krogh, 1998).
For example, Ford managed to reduce the development time for their cars from 36 to 24 months and the delivery delay from 50 to 15 days, just by sharing knowledge within the company and with dealers (Gazeau, 1998). This proves that is important to not only create knowledge and learn but also to not forget or lose track of that same knowledge (Darr and Epple, 1995). However, most workers still believe that their organization’s best knowledge is not accessible and that mistakes are committed several times (Gazeau, 1998).
One of the most important knowledge-assets of any company are the people that work there and therefore it is crucial for their wisdom to be protected (Porter-Liebskin, 1996). A big percentage of companies suffers significant setbacks when key staff leaves and the loss of only one employee can already result in damaged communication with clients and/or suppliers and even a considerable loss of income (Consulting, 1998).
More and more, the power associated with knowledge comes not from hiding it, but from transmitting it in a way that makes it productive (Drucker, 1995). By this logic, companies that can generate an internal "absorptive capacity" from their knowledge resources have a competitive advantage in their markets. Previously acquired knowledge should be used to recognize the value of new information, assimilate it, and apply it to create new knowledge and capabilities (Cohen and Levinthal, 1990).
2.2.2
Knowledge Management Systems
However, in order to do so, the company needs to have already captured the organizational knowledge and to be able to locate it. To have quick access to the knowledge, there must be an effective storage and hassle-free retrieval mechanisms (Johannessen and Olaisen, 1999; Kraatz, 1998). This free access to knowledge opens the doors for collaboration, which is widely considered as a major key for knowledge creation and its transmission within an organization (Leonard and Sensiper, 1998; Teece, 1998).
8 Literature Review
One of the most significant examples of how important knowledge sharing can be for the growth of a company are open-source developments. Android, Linux and Wikipedia are all examples of systems that massively benefited from being either open to modifications from anyone or having their source code freely available. Benefits include faster product development, better understand-ing of what functionalities are important and a wider adaption of the products (Gold and Segars, 2001).
One important thing to retain from these distinctions is that knowledge systems implemented in organizations will not seem dramatically different than information systems. However, even when knowledge has to be articulated into information, it must be expressed in a way that enables users to interpret it (Alavi and Leidner, 1992).
Besides, these systems should only contain information which can be actively processed in the brain of the user through reflection, enlightenment or learning. Hoarding large amounts of informations adds little value (Alavi and Leidner, 1992). Actually, people can be discouraged of accessing for knowledge they are aware that exists when the sheer volume of information provided is too large (Powell, 1998).
Creating a computer-mediated forum can result in a more frequent sharing of best practices and beliefs, confirmation hypothesis and interpretations and communication of new thoughts (Hen-derson and Sussman, 1997). Through the nest of knowledge, workers can question assumptions and arrive at either new insights or at better interpretations of the reality faster than by doing so on their own (Boland and Te’eni, 1994).
2.2.3
Standardization
The likelihood of a knowledge management project to succeed increases when they make use of a broader infrastructure of both technology and organization. In terms of desktop computing and communications, the bare minimum should be for each worker to have access to a networked computer with standardized productivity tools that allow for an easy creation and exchange of documents. In any case, the initiative will always have an easier time taking off if the tools and skills used are already in place beforehand (Davenport and Beers, 1998).
The more variable the knowledge management processes are, the more the company must deal with exceptions, which reflects on a less efficient integration of knowledge and a less consistent final product. The processes should be defined to be as standard as possible from the beginning and should be flexible enough to accommodate a certain degree of complexity. Making the knowl-edge management processes a part of the working routine is also a step forward towards a better standardization and, therefore, a more successful integration of the knowledge (Grant, 1996).
2.2.4
Ownership
Knowledge sharing initiatives are more interactive and generate a better learning environment than those solely focused on knowledge acquisition, which foments better results. Companies and institutions from very different areas share the view that it is beneficial for their managers to share their knowledge on the business to less experienced members. Not only do the newcomers gain valuable insights but the managers themselves also refine their knowledge while sharing it (Tobin, 1998).
2.2 Knowledge Management 9
2.2.5
Measuring Success
The description and dimensions of knowledge management processes are not as clear and well defined as they are for instance for financial ratios. Not only have they been less developed through time but they also have an inherent greater complexity (Hart and Banbury, 1994).
This is not to say that an effective knowledge management is not a big driver in the development of key aspects of organizational performance. In fact, it is usually associated with a learning curve that makes the organization more capable of creating value. (Galunic and Rodan, 1998)
The main problem arises when trying to measure the success of a knowledge management project. Often the benefits for the business are indirect and it is quite challenging to correlate the knowledge management’s achievements to financial indicators (Kaplan and Norton, 1992). Moreover, shareholders and possible investors are mostly interested in the firm’s capability to make money and generate profit rather than in its knowledge sharing culture (Davenport and Beers, 1998).
As knowledge management projects have to deal with complex variables such as organic growth that have an inherent uncertainty, they can raise suspiciousness against other fact-based initiatives. That is why some knowledge managers try to frame the project in terms that are more business-friendly, such as indicating that cycle times will be reduced through a reutilization of the resources (Davenport and Beers, 1998). Therefore, it is necessary to focus on finding reliable key performance indicators and this will indeed require a use of less traditional options. One option to judge the outcomes is to verify if the organization improved in capabilities such as: anticipating opportunities for new products/services, rapidly commercialize new innovations, anticipate surprises and crisis, decrease market response times, avoid overlapping development of corporate initiatives, streamline its internal processes and reduce redundancy of information and knowledge (Gold and Segars, 2001).
Other examples of indicators are: growth in the volume of content and usage, the likelihood that the project would survive without the support of a particular individual or two and if the project is seen as an organizational initiative rather than someone’s individual project (Davenport and Beers, 1998).
2.2.6
Dangers of Knowledge Management
One of the dangers of the implementation of knowledge management projects is that content continues to be used past its real usefulness (Alavi and Leidner, 1992). This can happen when knowledge management turns into a structure of single-loop learning where errors are detected and corrected but the status quo is never challenged (Argyris and Schon, 1978). Consequently, it will also make the organizations resistant to change (Denison and Mishra, 1995). On the other hand, if there is no routine of systematically updating the platform with new information and only the existent content is updated, the knowledge base will also become out-of-date.
However, when properly implemented, knowledge management can increase both responsiveness and innovativeness (Hackbarth, 1998). To assure that, it is necessary to keep the basic concepts underlying the practices of the knowledge base up to date (Malhotra, 1999).
10 Literature Review
2.3
Organizational Culture in Knowledge Management
2.3.1
Values, Norms and Practices
Culture can be defined as a set of values, norms and practices.
Values are found at the deepest level of a culture and are described as rooted and tacit prefer-ences on what the organization thrives for and how it aims to achieve that. Because they are so embedded in the organization and its people, it is very hard to change values. However, when that happens, there is potential for a great impact.
Norms are an expected pattern and come at a level above, being more identifiable and suscep-tible to changes. They are usually associated with how individuals interact at a social level within the corporation.
At last, there are practices, repetitive behaviors, universally understood such as the structure of weekly meetings (or their existence in the first place) or simple things as how to answer the phone. They are the most visible parcel and the most capable of being re-shaped. Therefore, they can unveil small quick-wins for knowledge management projects (De Long and Fahey, 1997).
2.3.2
Influence of Culture in Knowledge Management
Creating knowledge is the successful outcome of an innovation process which necessarily involves interaction between individuals (Badaracco, 1991). This generation of knowledge cannot occur on its own because, unlike data, knowledge develops in the human brain, invisibly and solely under the right organizational climate (Davenport and Beers, 1998). Therefore, focusing on the culture is a need for a firm that wants to properly manage its knowledge (De Long, 2000). In fact, having the wrong organizational culture is the main hurdle against the creation and management of knowledge assets (Gold and Segars, 2001).
Cultures determine which knowledge is meaningful and useful and which knowledge is dispens-able. Consequently, the unit will focus on acquiring and developing knowledge on the socially approved fields so it is important that they are aligned with the business goals.
It is not uncommon for knowledge managing activities or skill-building training classes to be undervalued when compared with daily tasks, which compromises medium and long term results. If people are not willing to share, no amount of IT investments or good project management practices will be sufficient to achieve the knowledge-sharing and business goals because they do not influence how the culture works, and that is the real bottleneck (Shermon, 2016).
Culture should be seen as the foundation of a house - even though no one ever lived in a foundation, neither has someone lived in a house without a foundation. Therefore, when presented with a toxic culture regarding knowledge management it is best for the project to focus just on improving these conditions, in order for subsequent projects to be able to actually leverage the knowledge (Davenport and Beers, 1998).
2.3.3
Cooperation of Groups
Some authors state that a community with close ties can foster the creation of knowledge, as people are more comfortable at presenting ideas and challenging each others’ premises. These interactions result in everyone having a similar understanding of reality, almost as if there is a non-physical knowledge based shared by the group (Brown and Duguid, 1999).
2.3 Organizational Culture in Knowledge Management 11
However, other authors argue that weakly tied groups can achieve better results in the knowl-edge creation process. These groups come up with a greater number of new ideas because they have a more diversified knowledge and perspectives (Robertson and Newell, 1996).
2.3.4
Incentives for Knowledge Sharing
It is common that business strategies require for the knowledge of individuals to be shared and combined for further efficiency and effectiveness. However, social norms can hinder the implemen-tation of knowledge management projects.
Many companies measure their employees’ performance solely on individual brilliance, which promotes an individual ownership of the knowledge rather than collective and cross-functional efforts. When that is the case, sharing information is seen as something that will decrease the employees’ power within the organization and put their position at risk (von Krogh, 1998). This is an even greater issue if the corporation has a history of downsizing and the trust levels have not been replenished.
This incentive for hoarding the knowledge can also come from structural elements, which have the purpose of better articulate different functions within the organization but end up serving as internal boundaries for the knowledge flow. Again, if some particular functions, divisions or locations are rewarded for owning the knowledge, they will not feel compelled to share it (O’Dell and Grayson, 1998).
Another structure-related blocker for cross-functional knowledge sharing are status differences. When a business unit is valued above another it makes it harder for the latter to contribute and can create a greater sense of competition when its own unit’s ideas are higher valued without proper judgment. Nowadays, this problem is ever-growing because companies need a more efficient integration between functions to assure success.
Therefore, it is crucial to guarantee that such aspects of the organization’s culture are not working against the objectives of the knowledge management (De Long and Fahey, 1997). In order to keep workers motivated to set aside time to learn new things, share their knowledge and help other employees’ outside their own function or division, there should be a fitting incentive system (Argote and Epple, 1990).
2.3.5
The Role of Management in Shaping the Organizational Culture
Even though managers recognize the importance of culture for the successful implementation of knowledge management projects, they are seldom able to articulate the cultuknowledge re-lationship in ways that lead to action De Long and Fahey (1997). This, however, does not mean that they cannot have a positive impact on shaping culture to be more knowledge management friendly. As expected from any change management project, results benefit from the involvement of senior management (Davenport and Beers, 1998).
Managers should make clear for the entire organization that knowledge management and or-ganisational learning are keys for the corporation to thrive and they should clarify which types of knowledge in particular are the most critical for the company. It is also within their power to financially support any infrastructure resources needed to assure the development of the project. (Davenport and Beers, 1998).
12 Literature Review
Besides identifying and adopting behaviors which can portray that certain knowledge building activities are essential, managers should also circle out and eliminate norms and practices that are barriers to those behaviors (De Long and Fahey, 1997).
When communicating their vision (which needs to be clear), managers should also clarify that all employees should be involved and held accountable for their contributions for the knowledge management project (O’Dell and Grayson, 1998).
On a more practical note, managers should also allow employees to allocate more time to support the knowledge management projects. The lack of time should not be a barrier to make knowledge available and shared with others, to teach and mentor each other and to use their expertise to innovate and find ways of working smarter (Glazer, 1998; Cranfield University, 1998). As seen before, performance reviews can influence negatively this field of action. It is up to managers to implement reward systems based on team performance and collective accomplish-ments as well as discourage an environment of harmful competition. At companies such as E&Y and McKinsey and Co., consultants are partially evaluated on their contributions for knowledge repositories and human networks (Davenport and Beers, 1998).
Departmental meetings are also a way to steer the group into a knowledge creating and sharing path. Different opinions should be respected and even encouraged and conflict should be managed in a constructive fashion rather than considered mindless.
Another example of where managers can make a difference is on how to deal with mistakes. Errors should not be hidden, ignored or heavily penalised but instead be exposed as a source of knowledge for future best-practices. This mindset should be correctly passed down to the workers. To sum up, a senior management that is truly committed to knowledge management can create aspects of a knowledge-oriented culture, support changes in performance measurements and can also allocate financial resources to build the correct infrastructure. Therefore, if there is lack of support from the senior management, the firm should focus on improving a single knowledge oriented process or function and not expect any large scale revolution. Davenport and Beers (1998)
2.4
Effective Team Meetings
Meetings are taking up an increasing number of hours of the workday and it is known that focused and deliberate conversations are critical to organisational performance (Axtell, 2017a). However, a 2012 survey from Salary.com on U.S. professionals showed that meetings are ranked as the number one office productivity killer.
This section will focus on how to achieve quality meetings, which complement achieving the goals with leaving employees feeling more connected, valued and fulfilled (Axtell, 2017a).
To start it is important to consider who is invited for the meetings. People often feel like either they lack the skills to contribute to the meeting or that what is being discussed is not relevant for them. Consequently, they consider their attendance as a waste of time. Therefore the people present at the meeting should be either affected from the announcements or capable of finding solutions for the problems discussed (Hartman, 2014).
Afterwards, it is important to make sure that the objectives of the meeting are clear. This can be achieved by sending an agenda with the topics, provided that vague titles such as ’status updates’ are avoided (Hartman, 2014). Allowing people to add their own topics to the agenda reduces the number of off-topic points raised unexpectedly in the middle of the meeting (Schwarz,
2.5 Daily Kaizen 13
2013). However, it is necessary to keep a realistic number of topics in the agenda. If too many topics are chosen, some, if not all of the goals will be compromised and therefore people will not be as motivated and focused for the following meeting (Sundheim, 2016).
The topics should be prepared before the meeting starts. If the topics are not complex, there will not be a need to go through them in a meeting and if they are complex, they need smart and focused preparation if it is expected to achieve something of value out of the meeting (Sundheim, 2016).
For the meeting itself it is also a good practice to always start and end on time. People appreciate when their time is taken seriously and they will more likely be on time if they are aware that the time frame is rigid. As the majority of people can only be truly engaged for sixty minutes, meetings should not last longer (Hartman, 2014).
During the meetings and when moving to a new topic the leader should make sure that everyone is ready to move on. This guarantees that the issue will not be raised again and that the meeting will stay on track. If this is successful and the team still runs out of time before all the topics are addressed it means there is an underestimation of the time needed (Schwarz, 2013).
When someone feels the need to raise some off-topic discussion, instead of immediately shutting that person off, (s)he should be invited to explain how does it relate with the topic at hand. This can either prove that it is irrelevant or it can reveal a connection that has not been considered. Then, the team should decide if they would like to take on that topic, leave it for later or for a future meeting. Even if the topic is not related it can be more important to address it than to keep with the ongoing discussion if it concerns some highly emotional issue. Sometimes focusing on how the team works together is more critical than any other operational or strategic discussion (Schwarz, 2013).
The last key aspect of a meeting is assuring that there will be effective follow-up. The meet-ings should end with clear agreements on specific action points with associated responsibles and deadlines. People should be free to negotiate the dates to assure that they are comfortable with the compromise. When there is a risk for a certain action to not be delivered on time, the person responsible of it should be expected to notify the supervisor. It is not possible to demand perfec-tion in delivery but the team should strive for perfecperfec-tion in communicaperfec-tion (Axtell, 2017b). The higher the completion level of action points, the more progress is being done toward the goals and the higher is the sense of accomplishment of the team (Axtell, 2017b).
2.5
Daily Kaizen
In companies where the continuous improvement culture is not engraved, management tends to focus on problem solving but not on finding the roots of the problems and mitigating them. The kaizen philosophy achieves these objectives by focusing on company development through consistent incremental improvements, complementary to disruptive changes, such as technological breakthroughs. According to Martinho (2016), in order to obtain a sustainable growth, there should be a focus on the following values:
• Value creation with a focus on the customer; • Waste (Muda) elimination;
14 Literature Review
• Working in the field (Gemba) to find improvement opportunities; • Workers involvement and accountability, regardless of their position.
By following these values it is possible to generate value without large financial investments. The expected outcomes of their implementation are: improved product and processes quality, a reduction in costs and lead time and an increase of the workers’ motivation (Imai, 2012).
Although many continuous improvement projects start, many of them end up unsuccessfully because they fail on behavioral aspects. Therefore, it is key to create in the company routines with the right behaviors (Bessant and Gallagher, 2001). The daily kaizen is a 5-level methodology which assures the correct implementation of the projects on this issue. Since only the first 2 levels were addressed in this project, the literature review will only be focused on them.
The level 0 focus on defining the natural teams, teams who work together on a daily basis and perform tasks with the same goal in mind. These teams can not be too large, as so would hinder the efficiency of the meetings. Afterwards, the concept of daily should be introduced to the teams and each level should be explained in detail.
The level 1 focuses on the implementation of daily kaizen meetings. These meetings last between 5 and 15 minutes and have a standardised agenda for each particular team, focusing on improving the communication amongst the workers, making the teams aware of how to reduce waste, defin-ing action plans, controlldefin-ing several indicators on a regular basis and prepardefin-ing the managers to immediately react to problems. A team board is generally used to support the meeting structure. The involvement of all the workers is an essential part, as they are the ones working closest with the processes and therefore they are the ones who can more easily suggest improvement ideas. Promoting this disruptive way of thinking is a cornerstone of the continuous improvement culture.
2.6
Priority Management
When managing the projects of a company, it is usual to think that everything is important and that nothing can be dropped without serious consequences. However, if everything is called a priority, then nothing is.
When leadership teams do not identify few key priorities, they pass onto their lower-level workers the task of deciding which tasks are more important. Since these workers have a much more limited sense of the company’s strategy it is not possible for everyone to be on the same page or to guarantee the effectiveness of those decisions (Ashkenas, 2016). A proper prioritisation creates a strategic alignment across the company and clears all doubts for the operational teams when faced with decisions, increasing the success rate of projects. Ryanair, for example, clearly focus on efficiency over customer service and this makes their employees allocate their time accordingly.
It is true that prioritising the wrong things will lead to bad results but this problem is far less frequent than the problem of not prioritising at all. When this is done correctly duplicated efforts are consolidated and unnecessary activities are eliminated, resulting in a reduction of costs that usually goes around the 15% mark (Nieto-Rodriguez, 2016). In the next two subsections the prioritisation methods that were used in this project will be analysed.
2.6 Priority Management 15
2.6.1
The Scoring Method
The scoring method is a methodology that uses a prioritisation matrix for ranking ongoing or prospect projects based on pre-set criteria determined as important. This matrix returns a final score for each project proportionally big to its importance, which allows the management to clearly see in which projects it should focus first and which projects should be put on hold or discontinued. According to Gosenheimer (2012), to create a prioritisation matrix the following steps should be followed:
1. Determine the criteria and rating scale. The first step is to collect factors that will clearly differentiate important projects from unimportant ones. These are called the criteria and it is usual to have 6-12 criteria. According to C´a˜nez and Garfias (2006) there should be a balance between qualitative and quantitative criteria. Having the business experience and the manager’s intuition complementing financial and risk considerations provides solid results. Afterwards, it is necessary to define the rating scale’s values, commonly used options are 1-10 or 1-5. These values represent how well the criteria is satisfied, the higher the better. It is essential that each scoring option has its own unique meaning, which is clearly explained on the matrix. This assures objectivity for the filling in process.
2. Establish the criteria’s weights. When a project is scored the numeric rating given to each cri-teria is multiplied by its weight, so it is important to give a weigh to each cricri-teria proportional to its degree of importance.
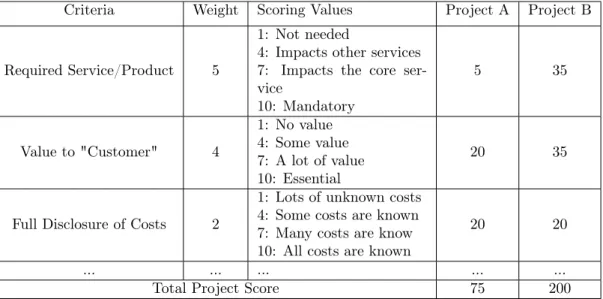
3. Create the matrix. A matrix should be created with a similar template to the one shown below on Table 2.1.
Table 2.1: Prioritisation Matrix’s Template
Criteria Weight Scoring Values Project A Project B
Required Service/Product 5
1: Not needed
4: Impacts other services 7: Impacts the core ser-vice 10: Mandatory 5 35 Value to "Customer" 4 1: No value 4: Some value 7: A lot of value 10: Essential 20 35
Full Disclosure of Costs 2
1: Lots of unknown costs 4: Some costs are known 7: Many costs are know 10: All costs are known
20 20
... ... ... ... ...
Total Project Score 75 200
4. Work in teams to score projects. Each project should be reviewed and rated in each criteria. The ratings should be multiplied by the weights and these numbers should be added up to make the final score. It is a good practice to go through the process with the people rating the projects beforehand to make sure that they understand the tool.
16 Literature Review
It is preferable to always rate projects in teams as different perspectives produce more ob-jective results. Another advantage is that if there are many projects to rate it is possible to divide the group into smaller teams to speed up the task.
5. Discuss results and prioritise the list. After all the projects are rated, a discussion should happen to see if the group is comfortable with the ranking order or if some adjustments should be made, in spite of the score. Finally, the projects should be passed on to a masterfile to keep track of all the ongoing projects.
This process can easily be done through a Microsoft Excel spreadsheet. Not only does it not require expensive software to generate a solution but it also does not require to hire consultant experts to analyse the results. Besides, it is a time efficient solution for prioritising projects (Schniederjans and Hamaker, 2003). Priority matrix is a quick and easy method to prioritise complex or unclear issues, it still maintains the consistency of the results if multiple and accurate criteria are chosen. Besides, the fact that an objective way of scoring is being used and the result is also a number helps to take the emotion out of the process and assures optimal results. Although it provides justification for the choice of the projects it does not completely remove the manager’s role. Not only does it require human input throughout the process but the final decision should always be reviewed and approved by the manager. (Coldrick and Hannis, 2005)
2.6.2
The Analytic Hierarchy Process
The Analytic Hierarchy Process (AHP) is a structured technique for organizing and analyzing complex decisions, based on mathematics and psychology. It was developed by Thomas L. Saaty in the 1970s and has been extensively studied and refined since then (Pangsri, 2015).
This method uses actual measurements and/or subjective opinions as input and return ratio scales and a consistency index. The decision methods of AHP according to Saaty (2008) are as follow:
1. The objective of the process is defined.
2. The decision hierarchy is structured. The higher level is the goal of the decision and the lower levels are condensed in criteria, sub-criteria, alternatives, etc.
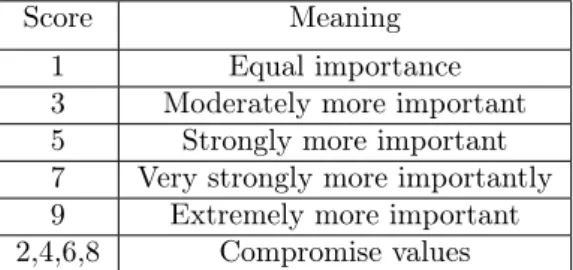
3. The elements in each hierarchical level undergo a pairwise comparison, in order to determine the criteria’s relative importance. The comparison is based on a nine level scale shown in Table 2.2.
Table 2.2: Saaty’s scale Score Meaning
1 Equal importance 3 Moderately more important 5 Strongly more important 7 Very strongly more importantly 9 Extremely more important 2,4,6,8 Compromise values
2.6 Priority Management 17
4. From the comparisons, the weights of the elements are calculated. Considering C = {Cj| j =
1, 2, . . . , n} as the set of criteria. The result of the comparison of n criteria can be displayed in a matrix (n x n), in which each element aij(i, j = 1, 2, . . . , n) is the coefficient of the weights of
the criteria. This comparison is represented by a square and reciprocal matrix, shown below (G¨orener, 2012). A= (aij) = a11 a12 . . . a1n a21 a22 . . . a2n . . . . an1 an2 . . . ann
Each matrix (one for each level of the hierarchy) is normalised and the relative weights are calculated. These are given by the main vector (w) that corresponds to the maximum eigen value λmax as shown below.
Aw= λmax.w
5. Then, a Consistency Index (CI) can be calculated through the formula below. CI=λmax− n
n− 1
The consistency ratio CR is obtained by dividing the CI value by the Random Index (RI). CR=CI
RI
If this value exceeds 0.1 the comparison of criteria should be remade, until the consistency is accepted.
Chapter 3
Problem Overview
This present chapter showcases the as-is scenario of the Workforce Management team at the start of the project. Section 3.1 explains in detail the work of the team and how it is divided. In section 3.2 a more in-depth analysis is made for the most problematic areas of the team’s work, pointing out the issues that need to be addressed.
3.1
The Workforce Management Team
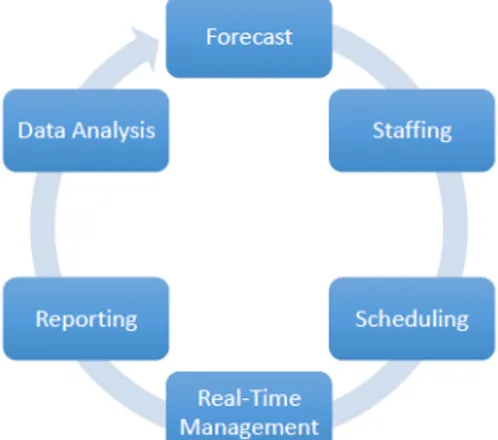
As previously mentioned, the Workforce Management team provides support to the business related teams (Customer Service, Delivery Support and Partner Service). In order to do so, the team follows the Workforce Management cycle, which can be seen in the Figure 3.1.
Figure 3.1: The Workforce Management Cycle.
In this section, these processes will be explained in detail. As some processes of the Workforce Management cycle are responsibility of the same group of people inside Farfetch’s team, they will be described as groups. The team also has 2 members focusing on the workforce optimisation, which will be explained as a complementary group.
3.1 The Workforce Management Team 19
3.1.1
Forecast and Staffing
The Forecast and Staffing processes have the goals to create forecast models that accurately show the future working needs of Farfetch’s services and to create short and long term staffing plans to be used for scheduling. These tasks are responsibility of the Planning & Forecast Specialist and of the Head of Workforce Management, both based in Porto. During the timespan of this project, another Planning & Forecast Specialist joined the team.
The first step is to take the historical data and define control limits for each of the following metrics:
• Volume of phone calls; • Volume of tickets; • Average handle times;
• Worked hours vs scheduled hours; • Marketing information;
• Shrinkage.
Afterwards, the forecast model is generated and its outputs are evaluated. In case there are values outside the predetermined control limits the forecast can either be adjusted or a warning is created. The final forecast contains information on the planned staffing hours.
When the forecast is ready, it is necessary to build the staffing plan. The recruitment needs are evaluated and generated for a 6 months period. This job is done with the constraint that Farfetch does not hire freelance agents only for specific peak seasons.
3.1.2
Scheduling
Scheduling is the process of arranging, controlling and optimizing work and workloads. The team has one scheduler working in the Porto office and one working from Los Angeles, who allocate resources according to forecast and staffing requirements.
They create models using algorithms and then manually adjust the agents’ working hours, breaks and lunch times to the detail of 15 minutes blocks. This team is also responsible for approving holidays for the agents and generating schedule efficiency reports on a weekly basis with intra-day details.
3.1.3
Real Time Management
Having real time data allows the team to make immediate changes to make sure that the number of agents available matches the workload. The team has four real time supervisors, distributed throughout Porto, Lisbon, Los Angeles and Shanghai. A plan is defined every week where the team sees the objectives of the week and analyses possible issues. During the week, they have information on the number of calls in each language queue, how long each customer waited, which agents are available and in which state they are.
The supervisors manage all exceptions (absenteeism or unexpected volumes, for example) and make decisions on the various events that can exist: breaks, meetings, training, overtime, among others. They should be working closely with the team managers to adjust the working strategies.
20 Problem Overview
3.1.4
Reporting and Data Analysis
All important decisions should be taken based on real analytical evidence and so, the goal of this process is to interpret all the relevant data to support those decisions and to report on all the team metrics to ensure visibility of what is happening. The reporting and data analysis team consists of 3 analysts working from Porto, each assigned to one of the business related teams: Customer Service, Partner Service and Delivery Support.
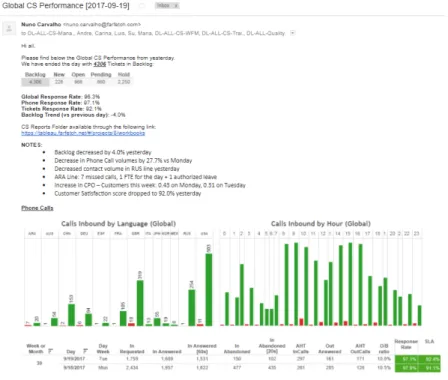
The analysts report on the performance of the previous week on every Monday and report on the performance of the previous day from Tuesday to Friday. The reports can be more focused on the operational performance when they are destined to the team managers or they can give a more high-level overview of the performance to the executive team. On these reports the analysts write notes regarding the main achievements and main problems and try to justify them based on the data through root-cause analysis.
This team also develops other reports on more specific issues for the managers of the team they work with and does analysis for projects created by not only these teams but also for other teams, such as the Continuous Improvement team, to give them data evidence to support their theories and implement improvements in the workflow processes.
3.1.5
Workforce Management Optimisation
Besides having people working directly in this cycle, the team also has a Tools Administrator and an Intern. The Intern is responsible for implementing a scheduling tool for the production team and the Tools Administrator is responsible for the platforms that the agents and managers of the connected teams use. He creates the accounts and manages the permissions of each person, creates macros and new fields to support the needs of the teams and is in contact with the developers of the software products when some problem occurs or when some new feature is needed.
3.2
Problem Statement
During the analysis of the current processes, some problematic areas were identified. In the next subsections they will be described.
3.2.1
Data Validation for Projects
Standing in a fashion luxury business and wanting to stay on top and be seen as a reference, leaves little room for mistakes. Regardless, Farfetch managed to keep an outstanding growth rate throughout its existence and it is safe to say that some of its success is due to its flexibility. No process is ever seen as too fined tuned and the managers of each team are never afraid of trying new iterations of the processes, in the search for performance improvements.
The success of these improvement projects is only possible because the assumptions and models for the future are always supported by analytic evidences. This means that the analysts at Farfetch play a key role, and this is particularly true in the Workforce Management Team.
However, whenever a manager of a business team or someone from an external team needs data validation, the analysts are left out of the strategic process, on the majority of cases. Therefore, it is not clear what are the goals of the projects and why that particular data is needed. Consequently,
3.2 Problem Statement 21
what is requested is not always something possible to measure or other times it is not what best shows the information the requester would like to have. Besides, the analysts are not shown the evolution of the project and what impact the project has in the end. Most of the times, they do not even receive the deserved recognition for their part, which hinders their motivation.
3.2.2
Prioritisation of Projects
The Workforce Management team uses an online project management tool called freedcamp, shown in Figure 3.2. This tool allows them to create tasks and sub-tasks, assign them, set deadlines, set priorities, write comments and update the status of the tasks. It is also possible to filter the tasks by assignee, by deadline or by status, which gives an overview of the projects to the head of the team and makes it easier for each person to have its work organised. This is an especially important tool for the analysts and for the people working in workforce optimisation because their work is mostly project based, while the rest of the team have more operational tasks.
Figure 3.2: The Freedcamp Platform.
However, the previously mentioned lack of involvement that the analysts have on the strategic development of the projects make it hard to do a proper prioritisation of the projects. As a results, projects ranking is highly influenced by the subjective opinion of the requesters and the analysts. Besides, Freedcamp only allows for the priority setting to be differentiated with three levels -low, medium and high, as seen in Figure 3.3. This means that even if the prioritisation is flawless within these three ranges, it is not possible to know which project should be tackled first within the same priority level. Therefore, it is not possible to know if the analysts are using their time to
Figure 3.3: The levels of priority in Freedcamp.
generate the most value possible and sometimes important projects have to be rejected or delayed due to time restrictions, when in fact time is being spent on something not so critical.
22 Problem Overview
This issue is aggravated by the fact that each analyst only deals with projects of its own area regardless of demand or importance. If one area has a surplus of important projects, the other analysts are not capable of help out the analyst responsible for that area because they are not familiar with the data.
Taking into consideration the time constraints and the importance of the analysts’ job, it is necessary to maximise the effectiveness of their time.
3.2.3
Reporting
The high standards of the fashion luxury business greatly reflects on the operational teams, which are always expected to have very high levels of performance. Consequently, this puts pressure in the Workforce Management team to assure that gives a precise reporting on the situation.
The reporting requires an ever-increasing level of detail so that the managers from the business related teams can have a very clear picture of the situation in order to identify what is going well and what needs to be tackled. In result, the analysts consistently have requests for new dashboards to be built.
On the other hand, this also means that even when they are sending standardized weekly or daily reports, they still need to pay a lot of attention to what is being shown and they need to spend a lot of time reporting on the metrics that have positive or negative results and giving explanations to why that happened.
In Figure 3.4, it is possible to see an example of the Customer Service daily report, where the graphs were collected from different dashboards, automatically updated, and the notes were made based on the analysis of the data. Not all the graphs were included but the full report can be found in annex.