THISDOCUMENTISNOTANINVESTMENTRECOMMENDATIONANDSHALLBEUSED EXCLUSIVELYFORACADEMICPURPOSES (SEE DISCLOSURES AND DISCLAIMERS AT END OF DOCUMENT)
See more information at WWW.NOVASBE.PT Page 1/34
M
ASTERS IN
F
INANCE
EQUITY RESEARCH
We initiate coverage of Galp Energia with an end-of-the-year price of 13,32€, which offers an upside potential of 48% from the current observed stock price.
The future value creation of Galp lies in the E&P segment. Lula field in Brazil and Rovuma in Mozambique are the reserves with higher potential and where Galp is expected to allocate a significant part of its investments in the upcoming future. The partnership with Sinopec was in our view crucial to alleviate the pressure on Galp’s financing capacity and provided the necessary cushion for future heavy investment in the E&P segment
Furthermore, the completion of the refineries conversion project will allow Galp to improve its refining margins and take advantage of an Iberian market dealing with shortage of middle distillates. In the Marketing segment it is not expected major changes in operating margins, as this sector have managed to guarantees stable cash flows, even in times of crisis.
In the Natural Gas segment no changes in future regulation are expected, the same does not happen in the the power segment, however with limited impact.
Company description
Galp Energia is an integrated oil & gas company composed of Exploration & Production (E&P), Refining & Marketing (R&M) and Gas and Power (G&P). The Galp’s future growth relies on the E&P segment, in particular in Brazil and Mozambique. In the R&M segment an upgrading project is about to be completed Galp’s presence in G&P allows for a diversified portfolio.
G
ALP
E
NERGIA
C
OMPANY
R
EPORT
O
IL&
G
AS 7THJUNE 2012S
TUDENT:
D
AVIDA
NTUNES[email protected]
E&P is the foundation for growth
Mozambique discoveries allow for diversification
Recommendation: BUY
Vs Previous Recommendation Buy
Price Target FY12: 13,32 €
Vs Previous Price Target 13,.32 €
Price (as of 4-Jun-12) 9.10 €
Reuters: GALP .LS, Bloomberg:GALP PL
52-week range (€) 9,10-13,77
Market Cap (€m) 7546180779
Outstanding Shares (m) 829.250.635
Free float 25,32%
Source:Bloomberg
Source:
(Values in € millions) 20010 2011E 2012F Revenues 16.987 16.713 17.354
EBIT 642 357 667
Net Profit 434 184 408
EPS 0,71 0,32 0,68
EBIT Margin 3,78% 2,14% 3,84%
EV/EBITDA 10 13 10
EBITDA/Interest expense 9 5 7
Source: Galp Energia, Analyst Estimates 70%
80% 90% 100% 110% 120% 130%
Jan-12 Fev-12 Mar-12 Abr-12 Mai-12 Jun-12 Galp Vs Psi 20
“COMPANY NAME” COMPANY REPORT
THISDOCUMENTISNOTANINVESTMENTRECOMMENDATIONANDSHALLBEUSED EXCLUSIVELYFORACADEMICPURPOSES (SEE DISCLOSURES AND DISCLAIMERS AT END OF DOCUMENT)
PAGE 2/34
Table of Contents
VALUATION ...3
COMPANY DESCRIPTION ...5
EXPLORATION & PRODUCTION (E&P) ...8
MARKET DESCRIPTION ... 8
BRAZIL ... 10
ANGOLA ... 13
MOZAMBIQUE ... 14
VALUATION ... 15
REFINING AND MARKETING (R&M) ...16
MARKET DESCRIPTION ... 16
CONVERSION PROJECT ... 18
MARKETING ... 19
VALUATION ... 20
GAS AND POWER (G&P) ...21
MARKET DESCRIPTION ... 21
NATURAL GAS... 22
VALUATION ... 24
POWER ... 25
VALUATION ... 26
SCENARIO ANALYSIS ...27
“COMPANY NAME” COMPANY REPORT
THISDOCUMENTISNOTANINVESTMENTRECOMMENDATIONANDSHALLBEUSED EXCLUSIVELYFORACADEMICPURPOSES (SEE DISCLOSURES AND DISCLAIMERS AT END OF DOCUMENT)
PAGE 3/34
Valuation
In our valuation we resort to a sum-of-the-parts approach, in which each of the Galp’s segment is valued in an individual fashion; in order to reinforce our analysis and to adjust it to the fragile economic environment, we formulate two additional scenarios: in the first one we consider Greece leaving the Eurozone as an isolated event; in the second one and more catastrophic, we consider that the exit of Greece from the Eurozone triggers the disintegration of the Eurozone. The valuation of the E&P segment was carried out through a APV approach, through which we manage to accurately capture and isolate the changing capital structure an oil field project experiences throughout the exploration period. This method was applied for those oil fields for which development plans have already taken place or been devised and therefore the amount of the reserves can be estimated or is public information. Operating expenditure was estimated based on Petrobras1 financial information, in the case of Brazil, and on benchmark operating costs that vary according to oil fields depth and geography. As for the capital expenditure, we rely upon the oil reserves of each field to estimate three most important capex elements - FPSOs2, production and injection wells and pipelines. Based on these estimates we are able to forecast production rate peak, after which a decaying rate is plug into the model. For those oil fields where it was not possible to ascertain the precise Capex elements, we opt for considering F&D costs3 benchmark of the region or of similar projects. It worthwhile to mention that fiscal arrangements in Brazil is concession based, while Angola and Mozambique it is in the form of PSC4, influencing significantly Galp’s working interest.
Refining and Marketing (R&M) and Gas and Power (G&P) segments are valued through a WACC approach. R&M segment is split into the two activity areas; the refining sector value is obtained through operating margin estimates, which follow to a certain extent the benchmark refining margins. The marketing sector represents a very stable operating margin, implying that potential variations might come from quantities sold and not so much from margin changes. Hence its valuation is fundamentally based on the forecasted demand for oil products. G&P
1
Petrobras is the concession operator of most Brazilian reserves in which Galp participates
2
Floating production, storage and offloading
3
Finding and development costs
4
“COMPANY NAME” COMPANY REPORT
THISDOCUMENTISNOTANINVESTMENTRECOMMENDATIONANDSHALLBEUSED EXCLUSIVELYFORACADEMICPURPOSES (SEE DISCLOSURES AND DISCLAIMERS AT END OF DOCUMENT)
PAGE 4/34 segment is composed of regulated and liberalized activities. In the former we focus on regulatory risk to assess any impact on the underlying value. In the liberalized activity – Natural Gas (NG) Commercialization - Galp holds a leading position in a mature market, compelling us to conclude no major changes are anticipated and as such we resort to historical margins to serve as benchmark for the future and estimate NG demand based on GDP growth.
Finally, the cost of capital5 calculation was adjusted to each segment and computed based on comparables and ERSE information (in the case of regulated activities). The comparables, when in sufficient number, namely R&M and power segments, are solely from European firms as the market and operational characteristics tend be more in line with that of Galp. Based on the gathered industry information we are able to estimate debt-to-equity ratio and, taking into account the tax rate of each firm, the unlevered beta of each industry. To this beta it was added a country risk component, derived by the correlation between MSCI index and Bovespa, in case of Brazil, and Euro Stoxx 50 in case of Portugal. The preference for the Euro Stoxx 50, instead of PSI 20, lies on two main factors; on one hand it is more liquid, on the other hand, it allows us to capture more accurately the inherent systemic risk Eurozone member states, avoiding the specificities of each economy in particular that might not be correlated with worldwide market performance. In case of Angola, being an economy highly dependent on oil performance, with low product diversification, we assumed a beta country premium above that of Brazil. The cost of debt, in turn, was calculated resorting to an analysis of comparables, given the absence of a rating for Galp.
5
Rf Galp Beta Country Beta
Mkt premium
Cost of Equity
Cost of
debt Tax rate D/E WACC
Brazil 1,8% 1,15 1,20 6,5% 10,8% N/A N/A N/A N/A
Angola 1,8% 1,15 1,30 6,5% 11,5% N/A N/A N/A N/A
Mozambique 1,8% 1,15 1,30 6,5% 11,5% N/A N/A N/A N/A
R&M Portugal Refining 1,5% 0,93 1,17 6,5% 8,6% 5,9% 27% 65% 7,1%
Power 1,5% 0,43 1,17 6,5% 8,1% 5,9% 27% 89% 6,7%
Gas regulated 1,5% 0,70 1,17 6,5% 6,8% 6,4% 27% 100% 6,4%
Gas liberalized 1,5% 0,72 1,17 6,5% 7,0% 6,4% 27% 89% 6,6%
WACC Computation
E&P
G&P Portugal
Table 1: Cost of capital
“COMPANY NAME” COMPANY REPORT
THISDOCUMENTISNOTANINVESTMENTRECOMMENDATIONANDSHALLBEUSED EXCLUSIVELYFORACADEMICPURPOSES (SEE DISCLOSURES AND DISCLAIMERS AT END OF DOCUMENT)
PAGE 5/34 We use Portuguese companies with credit-ratings, namely EDP and PT, as a proxy for Galp’s cost of debt6
and attribute a probability of default and recovery rate7; besides we also consider the cost of debt of comparable firms. Finally for the risk-free rate we apply the 10y Treasury bonds on the E&P segment as operations are in US dollars, while in the R&M and G&P segments we use 10y German Government bonds.
Company Description
Founded in 1999, Galp Energia is an integrated oil and gas company divided into three main segments - Exploration and Production, Refining and Marketing and Gas and Power – through which it intervenes in the whole value chain of oil and gas.
The Exploration and Production segment is formed by 40 projects spread over the world, being Brazil and Angola the ones where Galp is already producing. This segment is regarded as the key driving force of Galp over the following decade and major investments have been and will continue to be made in the exploration and development of oil and gas reservoirs. Block 14 in Angola was the only oil source of the last decade and is now going through its decaying
6
7Moody’s –
Corporate Default and Recovery Rates, 1920-2010 Table 2: Fundamental value of Galp Energia
Source: Analyst estimates
Fair value €/share Fair value €/share Fair value €/share Fair value €/share
E&P 8.050,23 € 9,71 € 6.108,80 € 7,37 € 5.436,68 € 6,56 € 7.635,06 € 9,21 € R&M 2.745,31 € 3,31 € 2.510,02 € 3,03 € 826,01 € 1,00 € 2.630,89 € 3,17 € G&P 3.226,32 € 3,89 € 2.954,16 € 3,56 € 1.332,53 € 1,61 € 3.107,03 € 3,75 €
Net debt 3.575,19 € 4,31 € 3.959,73 € 4,78 € 3.970,66 € 4,79 € 3.652,53 € 4,40 €
Pension fund 313,39 € 0,38 € 313,39 € 0,38 € 313,39 € 0,38 € 313,39 € 0,38 €
Minorities 2.690,51 € 3,24 € 2.077,04 € 2,50 € 1.816,82 € 2,19 € 2.557,40 € 3,08 €
Sinopec cash 4.193,55 € 5,06 € 4.193,55 € 5,06 € 4.193,55 € 5,06 € 4.193,55 € 5,06 €
Sinopec share 2.415,07 € 2,91 € 1.832,64 € 2,21 € 1.631,00 € 1,97 € 2.290,52 € 2,76 €
Lusitaniagás 15,12 € 0,02 € 15,12 € 0,02 € 11,76 € 0,01 € 14,98 € 0,02 €
Setgás 73,80 € 0,09 € 73,80 € 0,09 € 57,40 € 0,07 € 73,14 € 0,09 €
Tagusgás 61,92 € 0,07 € 61,92 € 0,07 € 48,16 € 0,06 € 61,37 € 0,07 €
Beiragás 33,52 € 0,04 € 33,52 € 0,04 € 26,07 € 0,03 € 33,23 € 0,04 €
Wind power 91,07 € 0,11 € 60,04 € 0,07 € 42,42 € 0,05 € 84,16 € 0,10 €
Galp value 11.636,33 € 14,03 € 9.416,36 € 11,36 € 5.687,90 € 6,86 € 11.043,20 € 13,32 €
Worst Scenario (p=4%)
“COMPANY NAME” COMPANY REPORT
THISDOCUMENTISNOTANINVESTMENTRECOMMENDATIONANDSHALLBEUSED EXCLUSIVELYFORACADEMICPURPOSES (SEE DISCLOSURES AND DISCLAIMERS AT END OF DOCUMENT)
PAGE 6/34 stage. The foundations of future growth lie instead in the ultra-deep waters of Brazil, driven in particular by Lula and Cernambi fields, which together retain 8300Mboe8 and are presently being operated by Petrobras, through a concession where Galp owns a 10% share. Standing as one of the largest oil reservoirs in Brazil, production have already commenced and is forecasted to be at full speed by 2017 with a total production rate of 1270kboepd9 Furthermore, Area 4 of Rovuma, in Mozambique, where Galp owns a share of 10%, is regarded as another significant source of value, after exploration tests have revealed 30Tcf10 total gas-initially-in-place (GIIP), however the incipient infrastructures of the region entail considerable amount of investments so as to make the extracted gas commercially viable.
Refining segment accounts for the largest share of Galp’s revenues and is formed by two refineries – Sines and Matosinhos refineries - with a capacity of 220.000 and 110.00 kbopd11, respectively. The conversion project is predicted to be fully operational in the second half of 2012 and is aimed at increasing refineries complexity, whereby it will be possible to process heavier crude oil and raise the production share of higher value products. After have been processed, the output is subsequently either marketed to direct clients through Galp’s distribution network, which covers the Iberian Peninsula and part of Africa, or sold to other operators or even exported to US and Europe. Its distribution network is vast and guarantees Galp a competitive advantage over other players in the Portuguese market, providing a stable stream of cash-flows.
The Gas segment has regulated and liberalized activities. Galp participates in the former through storage and distribution of NG12, whilst the latter is composed by import of Gas. The commercialization activity, albeit partly regulated, is going through a deregulation process to be completed in 2013. Once again the solid distribution network in Portugal and the economics inherent to the sector endows Galp with a privileged market share in the distribution and commercialization segments, alongside EDP. Lastly, the power segment represents the lowest source of revenue and is composed of a cogeneration and wind-power segments
8
Million barrels of oil equivalent
9
Thousands barrels of oil equivalent per day
10
Trillion Cubic Feet
11
Thousand barrels per day
12
“COMPANY NAME” COMPANY REPORT
THISDOCUMENTISNOTANINVESTMENTRECOMMENDATIONANDSHALLBEUSED EXCLUSIVELYFORACADEMICPURPOSES (SEE DISCLOSURES AND DISCLAIMERS AT END OF DOCUMENT)
PAGE 7/34 with installed capacities of 160MW and 12MW, respectively, being both on the verge of increasing their size through the completion of impending projects.
Shareholder structure
Amorim Energia and Eni represent the two main shareholders, with each one controlling 33,34% of Galp’s equity. The Portuguese State has also an overall participation of 8%, being 7% directly hold through Parpública and 1% indirectly hold through Caixa Geral de Depósitos (CGD). The remaining 25,32% accounts for the free float, of which approximately 82% is owned by institutional investors. Amorim Energia, Eni and CGD signed an agreement, whereby the three parties are committed to its equity share until December of 2010 – lock-in period – after which time any participation can only be sold in one single block until March 2014. The shareholder structure will change change in the future near future. On one hand, CGD, by imposition of Troika, must sell its equity stake on Galp; on the other hand, Eni has publicly announced its decision to sell its minority stake. These key shareholders have agreed on allowing Eni to sell its stake thereby rendering the former agreement ineffective. Amorim Energia agreed to buy or name a third party to buy from Eni 5% sahre. Sonangol, which has an indirect participation on Galp of 15% through Amorim Energia, is also interested in reinforcing its strategic position. Negotiations for Eni’s stake acquisition are still taking place and, up until now, it is not clear how Galp’s shareholder structure will altered.
Graph 1: Shareholder structure
34%
33% 7% 1%
25%
Amorim Energia Eni Parpública CGD Free float
“COMPANY NAME” COMPANY REPORT
THISDOCUMENTISNOTANINVESTMENTRECOMMENDATIONANDSHALLBEUSED EXCLUSIVELYFORACADEMICPURPOSES (SEE DISCLOSURES AND DISCLAIMERS AT END OF DOCUMENT)
PAGE 8/34
Exploration & Production (E&P)
Market description
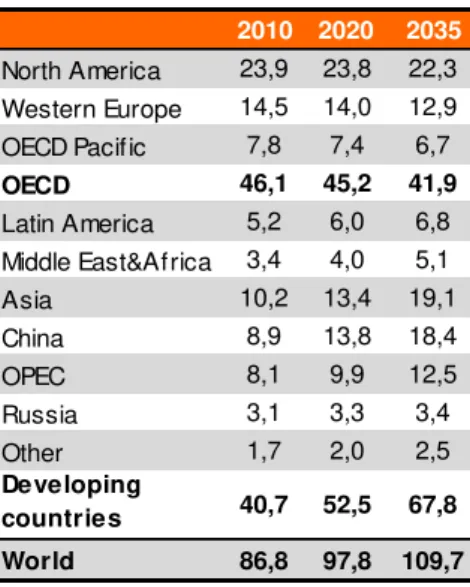
Energy is the main driving force of the worldwide economy; without it population could not afford to have the life quality as we know it nowadays. It seems thus evident that economic growth and energy consumption have displayed a high correlation over the last 70 years, equal to 0,78. According to OPEC13, yearly economic growth until 2035 is forecasted to be 3,4%,driven by developing countries, 4,8%, while in the OECD countries it is estimated to stabilize at 2%. Therefore, worldwide energy demand should be fuelled by the rapid growth of developing economies, continuing oil as the major energy source, while natural gas will be fastest-growing one. Maintaining the trend witnessed over the past 10 years, during which the percentage of non-OECD oil demand increased from 38% in 2000 to 48% in 201014, it is forecasted an increasing share of oil demanded by the developing economies, which will drive global demand up from 86,8mb/d in 2010 to 109,7mb/d in 2035. In fact, oil consumption in OECD countries is predicted to decrease, which can be explained by the behaviour of the sector most responsible for oil consumption – road transportation – which in 2008 accounted for 41% of the whole oil consumption1. The car ownership will flatten around 540 per 1000, as saturation effects will come into play, while in 2008 on average there were 489,2 cars per 1000 in OECD1. Additionally, the proliferation of hybrid and plug-in vehicles, along with efficiency improvements in conventional ones, partly instigated by tight regulation on CO2 emissions, will make oil demand in the transportation sector to eventually decrease. Nonetheless, as referred above, global oil demand is foreseen to increase stirred by non-OECD economies. The rapid rising income level will boost car ownership from an average of 37 per 1000 in 2008, to 118 per 1000 in 20351, which will lead oil demand in road transportation to increase approximately 10mboe/d over the period 2008-20351.
As a response to an increasing demand, the worldwide oil supply will increase, with some regions gaining importance in the oil industry landscape. Oil supply industry is in a mature phase that is expected to last until 2020, after which a
13
OPEC - World Oil Outlook 2011
14
IEA – Annual statistical supplement 2011
Source: EIA, World Bank
Source: ExxonMobil – 2012 The outlook for energy
2010 2020 2035
North America 23,9 23,8 22,3 Western Europe 14,5 14,0 12,9 OECD Pacific 7,8 7,4 6,7
OECD 46,1 45,2 41,9
Latin America 5,2 6,0 6,8 Middle East&Africa 3,4 4,0 5,1
Asia 10,2 13,4 19,1
China 8,9 13,8 18,4
OPEC 8,1 9,9 12,5
Russia 3,1 3,3 3,4
Other 1,7 2,0 2,5
Developing
countries 40,7 52,5 67,8
World 86,8 97,8 109,7 Table 3: World oil demand outlook (mb/d)
Source: OPEC World oil outlook 2011
Graph 3: Global energy demand growth by fuel type (quadrillion British Termal Units) -6 -4 -2 0 2 4 6 8
1961 1968 1975 1982 1989 1996 2003 2010 US GDP growth (annual %) US energy consumption growth (annual %)
Graph 2: US GDP & Energy consumption growth (%) 0 50 100 150 200 250
“COMPANY NAME” COMPANY REPORT
THISDOCUMENTISNOTANINVESTMENTRECOMMENDATIONANDSHALLBEUSED EXCLUSIVELYFORACADEMICPURPOSES (SEE DISCLOSURES AND DISCLAIMERS AT END OF DOCUMENT)
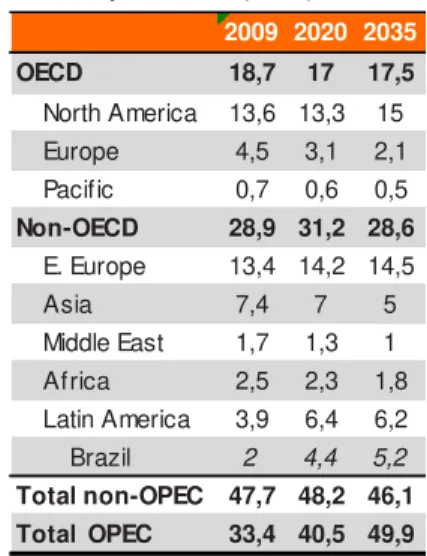
PAGE 9/34 decline of reserves is predicted in Non-OPEC. Latin America stands with the second-highest production growth rate equal to 3,7%., due to the Brazilian offshore discoveries in pre-salt layers. As conventional reserves are exhausted, oil companies, in a bid to sustain production levels, are forced to change gears towards unconventional and more expensive sources of oil, for which top-notch technology is required and inherent risks to exploration and production are increasingly higher and difficult to predict. In that sense, annual upstream investment requirements should climb from $110bn over 2011-2015, to $130 bn over 2031-203515.
In the short term, the oil price displays a volatile behavior resulting from economic cycles and oil producers’ capacity, which is aggravated by speculative investment. On one hand, the heightened economic crisis in the Euro-area and the risk of contagion from Europe poses a threat to the global economy, easing the pressure from the demand side; on the other hand, if the brinkmanship of US and EU against Iran persists, supply disruptions become more probable as more pressure is exerted on Saudi’s production capacity. Market consensus, reflected in the Nymex crude oil, point toward a decreasing oil price over the next two years. In the long-term, as a response to an increasing demand, oil price will tend to increase, reflecting the rising marginal costs of production. However, it is not clear how technological improvements will mitigate the former effect. Political issues play an important role as well. The existent Cartel organization, which is responsible for 50% of oil supply, is able to influence crude oil price, by setting the supply quantities in the market. Governments, however, can partly ease the dependence of economies on oil and thereby influencing its price, through regulation aimed at incentivizing more oil efficient technology or alternative energy sources.
Taking into consideration the increasing demand for oil and natural gas, Galp has positioned its strategy towards the development of its E&P segment, by channeling resources to three main geographical regions – Brazil, particularly Santos; Angola and Mozambique – based on which it expects to increase its working interest production from 21kboepd16, in 2011, to more than 300kboepd in 2020.
15
OPEC - World Oil Outlook 2011
16
Thousand barrels oil equivalent per day
Table 4: Oil production (mb/d) Table 5: Oil production (mb/d)
Source: World Energy Outlook 2010
2009 2020 2035
OECD 18,7 17 17,5
North America 13,6 13,3 15 Europe 4,5 3,1 2,1 Pacific 0,7 0,6 0,5
Non-OECD 28,9 31,2 28,6
E. Europe 13,4 14,2 14,5 Asia 7,4 7 5 Middle East 1,7 1,3 1 Africa 2,5 2,3 1,8 Latin America 3,9 6,4 6,2 Brazil 2 4,4 5,2
Total non-OPEC 47,7 48,2 46,1
Total OPEC 33,4 40,5 49,9
2009 2020 2035 2009 - 2035
Total non-OPEC
Conventional 45,8 44,4 39,6 -0,60% Unconventional 1,8 3,7 6,5 5,00%
TotalOPEC
Conventionaloil 32,9 38,9 46,9 1,40% Unconventionaloil 0,5 1,6 3 7,10%
“COMPANY NAME” COMPANY REPORT
THISDOCUMENTISNOTANINVESTMENTRECOMMENDATIONANDSHALLBEUSED EXCLUSIVELYFORACADEMICPURPOSES (SEE DISCLOSURES AND DISCLAIMERS AT END OF DOCUMENT)
PAGE 10/34
Brazil
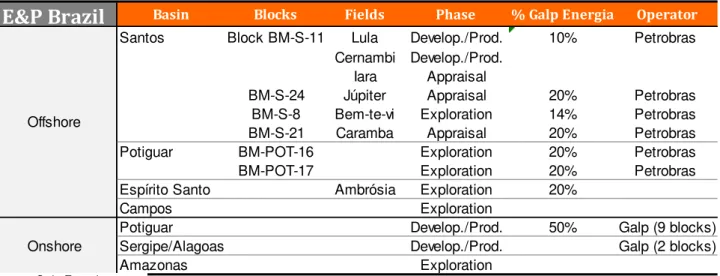
In Brazil, Galp is involved in 21 projects at different exploration stages, being the ones located in Santos Basin those that have displayed high-quality oil reserves. While for the majority development plans have been devised, there are two of them - Lula and Cernambi - that are already under production. The operator of most of these fields is Petrobras, with the exception for two onshore blocks of small size in Sergipe Alagoas and nine in Potiguar basins, whose operator is Galp. Santos basin is constituted by four offshore ultra-deep water blocks - Block BM-S-11, BM-S-24, BM-S-8 and BM-S-21 – where reservoirs depth ranges from 3Km to 6 Km. Potiguar, Espírito Santo, Campos Basins and onshore basis are either still under exploration phases or of small size and there is little information concerning the amount of reserves available or the commercial viability of its extraction.
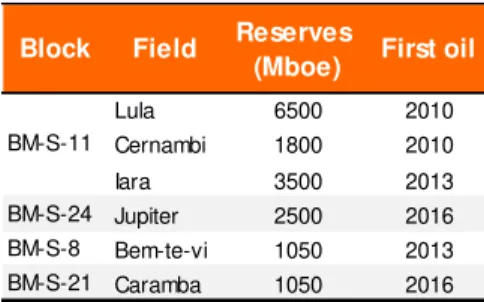
Following the DoC17 submitted in December 2010, Lula and Iracema were confirmed to have 6500Mboe18 and 1800Mboe, respectively, given a recovery factor that, according to Galp, is slightly above 20%. During 2011, the development phase proceeded in Lula field, being connected three producing wells and one gas injection well to the first permanent production unit, FPSO Cidade de Angra dos Reis. Until 2017, eight additional FPSOs are expected to be introduced, two of which are allocated to Iracema field, while six to Lula field;
17
Declaration of Commerciality
18
Barrel of oil equivalent
E&P Brazil
Basin Blocks Fields Phase % Galp Energia OperatorSantos Block BM-S-11 Lula Develop./Prod. 10% Petrobras
Cernambi Develop./Prod.
Iara Appraisal
BM-S-24 Júpiter Appraisal 20% Petrobras
BM-S-8 Bem-te-vi Exploration 14% Petrobras
BM-S-21 Caramba Appraisal 20% Petrobras
Potiguar BM-POT-16 Exploration 20% Petrobras
BM-POT-17 Exploration 20% Petrobras
Espírito Santo Ambrósia Exploration 20%
Campos Exploration
Potiguar Develop./Prod. 50% Galp (9 blocks)
Sergipe/Alagoas Develop./Prod. Galp (2 blocks)
Amazonas Exploration
Offshore
Onshore
Source: Galp Energia
“COMPANY NAME” COMPANY REPORT
THISDOCUMENTISNOTANINVESTMENTRECOMMENDATIONANDSHALLBEUSED EXCLUSIVELYFORACADEMICPURPOSES (SEE DISCLOSURES AND DISCLAIMERS AT END OF DOCUMENT)
PAGE 11/34 the production phase in the former one is not expected to start before 2014. Taking into consideration the prospected amount of reserves and the current development plan, peak production in both fields will be achieved around 2020, with a production rate totalling 1270kboepd, and extraction will extend up to 2037.
Iara field is still in the appraisal phase that is expected to be completed by December 2013, when a DoC will be submitted. A EWT19 is expected to set off in the 2nd half of 2012; the amount of boe lies within 3-4bn, assuming a recovery factor of 20%. In Block-S-24, Júpiter field seems to have huge potential reserves of natural gas, comprising 1/3 of natural gas, 1/3 of oil and 1/3 of condensates, and is presently under the appraisal phase with contingent resources above 5 bln boe, which make it one of the highest resource potential fields in Galp’s portfolio. EWT is expected for 2015 and DoC for February 2016. We estimate reserves of 1bln boe, assuming similar conditions and technology availability to that of Tupi, which is located 37 km away from Júpiter. In block BM-S-8, two exploration wells found oil reserves in Bem-te-vi and Biguá, being Carcará the third exploration well to be drilled. In Bem-te-vi the third EWT is taking place and DoC is expected for the end of 2012, while Caramba is also in an appraisal phase, being DoC forecasted for 2016; nonetheless there is still high uncertainty in what regards the amount of reserves in both fields. As reference we use block BM-S-9, in particular Guará, which is close to both fields and displays similar characteristics. Guará is expected to have between 1200Mboe to 2000Mboe. Hence we assume a lower boundary for both fields of 1050Mboe available to recovery. The estimated recovery factors for all aforementioned projects might rise thanks to EOR20, through horizontal drilling and CO2 injection, and thus proved reserves have an upside potential that depends on the success of these experiments. Since the beginning of the century exploration and production costs have been steadily increasing as extraction conditions become more challenging. The average cost to discover a boe was $3 in 2009, contrasting with $1,18 in 2001. The mid-term will however be characterized by increasing capital expenditures, as exploration and development plans in Brazil and Mexico’s deepwaters intensify, exacerbating competition for equipment capable of operating in this
19
Extended well test
20
Enhanced oil recovery
Table 7: Oil reserves in Santos Basin
Source: Galp Energia
Table 8: Upstream capital and operating cost Index (base =2000)
Source: IHS
Block Field Reserves
(Mboe) First oil
Lula 6500 2010
Cernambi 1800 2010
Iara 3500 2013
BM-S-24 Jupiter 2500 2016
BM-S-8 Bem-te-vi 1050 2013
BM-S-21 Caramba 1050 2016
BM-S-11
100 125 150 175 200 225 250
“COMPANY NAME” COMPANY REPORT
THISDOCUMENTISNOTANINVESTMENTRECOMMENDATIONANDSHALLBEUSED EXCLUSIVELYFORACADEMICPURPOSES (SEE DISCLOSURES AND DISCLAIMERS AT END OF DOCUMENT)
PAGE 12/34 harsh environments The absence of skilled labour and increasing steel prices will also sustain this upward trend of production costs. The majority of Brazilian oil reserves in which Galp takes part are placed at the sub-salt layer, which corresponds to an average of 5-6Km depth. Petrobras is the main operator of most of these fields and its historical lifting cost went from $8,78boe in 2008 to $12,2boe in 2012, from which one can infer that the higher portion of ultra-deep waters in Petrobras portfolio has driving its average costs upwards, which in turn are in line with industry costs in Latin America. We expect lifting and F&D costs to increase in the mid-term as a result of the shortage of equipment and skilled labour.
The fiscal arrangement in Brazil is concession based and as such taxes encompass (1) 10% of revenues in royalties; (2) a special participation tax (SPT) between 0-40% of EBITDA, according to the level of production (put the intervals of production from ANP); (3) the typical IRC of 34%. E&P segment is the sector with more value creation in the future, however it entails significant amount of investments. According to our analysis until 2020 Galp will report a capital expenditure of €6,3Bn, which represents an average of €0,8Bn allocated solely to E&P, being 40% channeled to Brazilian deep-water reserves. In the case of Brazil we based our capital expenditure on the amount of recoverable reserves, considering the three most important capex elements: FPSO, production and injection wells and pipelines. We assume a cost of $1,2Bn for a FPSO with a production rate capacity of 150kbopd; based on Lula pilot, we assume that each production well has a production capacity of 17kbopd and that it is always required one injection for two production wells. Additionally, we assume that a drilling rig costs $500.000/d and that drilling day rates is equal to 70 days and, as Petrobras becomes more proficient and adjust its technology the number of days start decaying towards 45 days.
Table 9: Worlwide F&D and Lifting costs
Source: World Enerrgy Outlook 2011
Table 10: Range of SPT in Brazilian concessions
Source: ANP
Min Max Average
Latin America 7 21,5 14,25
Africa 8,5 21,5 15
Middle East 3 11,5 7,25
E.Europe 7 11,5 9,25
Europe 15 25 20
USA 12 26,5 19,25
Latin America 6 12,5 9,25
Africa 4,5 9,5 7
Middle East 2 6 4
E.Europe 7 16 11,5
Europe 6 11 8,5
USA 8 16 12
Lifting cost F&D
Production kboe/year SPT
0 11.322 0%
11.322 22.644 10% 22.644 33.966 20% 33.966 45.288 30% 45.288 56.609 35% 56.609 >56609 40%
0,00 100,00 200,00 300,00 400,00 500,00 600,00 700,00 M il li o n U S D Caramba Bem-te-vi Jupiter Iara Cernambi Lula
Graph 4: Estimated Capex for Santos-Basin
“COMPANY NAME” COMPANY REPORT
THISDOCUMENTISNOTANINVESTMENTRECOMMENDATIONANDSHALLBEUSED EXCLUSIVELYFORACADEMICPURPOSES (SEE DISCLOSURES AND DISCLAIMERS AT END OF DOCUMENT)
PAGE 13/34
Sinopec capital raise
In the first quarter of 2012 it was closed the agreement between Galp and Sinopec related to the capital raise of Petrogal Brazil in the amount of $4,8 bn plus a loan repayment to Galp equal to $0,36bn. This transaction allows Sinopec to hold 30% of Petrogal Brazil, whilst the remainder will stay in Galp possession, which will maintain its controlling position as major shareholder. In this transaction the underlying value of Petrogal Brazil is placed at $17,33bn, meaning that Galp’s share on the Brazilian oil reserves was valued at $12,13bn (€9,76bn) or, equivalently, at $5,96bn per boe21, representing a premium of 8% relative to our perceived value of the Brazilian oil reserves. Petrogal will continue to be fully consolidated in Galp’s financial statements and therefore, for accounting purposes, this capital raise in Petrogal Brazil represents a cash increase in Galp balance sheet as a counterpart of minority interest.
Angola
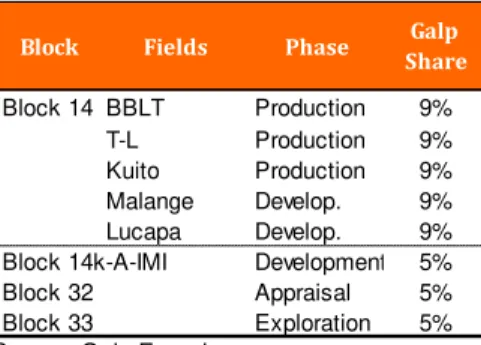
Galp has participation in four offshore blocks – block 14, block 14k-A-IMI, block 32 and 33 – and a natural gas exploration. Block 14 constitutes the only block of Galp’s portfolio currently producing in Angola and its production rate is reaching a mature phase, still the resulting production decline of BBLT and Kuito has been compensated by the introduction of the CPT22 in Tômbua-Lândana in 2009, driving working interest upwards. With 350 million barrels left by 2009 and production rate peaking at 190 kbopd, in 2011, reserves are expected to be fully depleted by 2014. In this block, Galp has conducted exploration and development activities at other fields, namely Lucapa and Negage fields, whose operator is Chevron. First oil is expected between 2014 and 2015 at an initial extraction capacity around 100-130bbl/d for Lucapa and 50-75bbl/d for Negage23. Considering reserves average life of 20 years, in line with reserves life in Angola24, one would estimate 1,4bn reserves in both fields. As for block 14k-A-IMI (Lianzi), the development plan has been devised and it was decided to link it to the BBLT platform. Chevron, the operator, announced an investment of $1,9 bn for the exploration of 70 million bbl; first oil is estimated to happen between 2014 and 2017. In Block 32 appraisal wells have been drilled to assess
21
Barrel of oil equivalent
Table 11: Oil fields Angola
Source: Galp Energia
Table 12: Oil reserces in Angola
Source: Galp Energia
Block Fields Phase Galp
Share
Block 14 BBLT Production 9%
T-L Production 9%
Kuito Production 9%
Malange Develop. 9%
Lucapa Develop. 9%
Block 14k-A-IMI Development 5%
Block 32 Appraisal 5%
Block 33 Exploration 5%
Block Oil reserves
(kboe) First oil
Block 14 105,25
-48,17
-24,97
-50,00 2.014 100,00 2.014 Block 14k-A-IMI 70.000,00 2.014,00 Block 32 1.268.679,87 2.016,00
“COMPANY NAME” COMPANY REPORT
THISDOCUMENTISNOTANINVESTMENTRECOMMENDATIONANDSHALLBEUSED EXCLUSIVELYFORACADEMICPURPOSES (SEE DISCLOSURES AND DISCLAIMERS AT END OF DOCUMENT)
PAGE 14/34 reservoirs characteristics. First oil is expected by 2016, reaching a production rate of 200kbopd in the following year, sustained by two FPSOs. Assuming the aforementioned reserves average life of 20 years and a decaying production rate of 5% over the last 10 year, we obtain an amount 1,3 bn oil reserves to be extracted. In Block 33 seismic studies were completed in 2011, being forecasted for 2012 the drilled of an exploration well. Its characteristics in terms of reserves and extraction feasibility are still uncertain and as such multiple analysis method is preferable.
Angola fiscal system is in the form of Production Sharing Contract (PSC), meaning that a portion of the oil produced will be channeled to capital expenditures and operating costs of the project – denominated by cost oil – and the remainder will be distributed across the state and the investors – denominated by profit oil. The sum of both components makes up the net entitlement of each investor under a PSC. The state’s share of profit oil tends to increase as oil production matures, varying approximately going from 25% to 80%, depending on the contract parameters.
Mozambique
Rovuma basin continues to exceed expectations, after exploration wells in Mamba South-1 and North-1 have revealed total gas-initially-in-place (GIIP) volumes of 30Tcf25. According to ENI, eight additional exploration/appraisal wells will be drilled until 2013 in the hope of expanding initial reserves to 40-45 Tcf. The success of recent exploration drilling and the high quality of the reservoirs sands make the consortium to expect a recovery factor of 80% out of the 30Tcf (GIIP).The absence of infrastructures in the country will require further investment to guarantee a commercially viable transportation system and gas sales agreements. The recent discovery of large NG reserves in East Africa is expected to put pressure on consortiums in finding end-customers, being the Asian market the preferred target for geographical reasons, and in dealing with
22
Compliant piled tower
23
Angola – US Energy Information Administration
24
Baranzini, A., & Weber, S. (2012). Elasticities of Gasoline Demand in Switzerland. SSRN . Krichene, N. (2005). A Simultaneous Equations Model for Oil Crude Oil and Natural Gas markets.
Lochner, S., & Bothe, D. (2009). The development of natural gas supply costs to Europe, the United States and Japan in a glob alizing gas market. Elsevier .
25
Trillion Cubic Feet
0 5 10 15 20
2007 2008 2009 2010 2011
Kuito BBLT Tômbua-Lândana Graph 5: Working interest production (Kbopd)
“COMPANY NAME” COMPANY REPORT
THISDOCUMENTISNOTANINVESTMENTRECOMMENDATIONANDSHALLBEUSED EXCLUSIVELYFORACADEMICPURPOSES (SEE DISCLOSURES AND DISCLAIMERS AT END OF DOCUMENT)
PAGE 15/34 rising capital expenditures, caused by raw materials price increase and shortage of skilled labour. The development plan for Rovuma Area-4 is still being conceived and first gas is prospected for 2018. Our valuation takes into account the additional appraisal wells required in the future, being drilled 5 of them in 2012; the liquefaction costs associated with 6 LNG trains we expect to be necessary for 30 TcF; and further operating costs associated with NG production. For that purpose, we use Area 1 as a proxy, given the similarity and proximity of both fields. We assume a Expex, Capex and Opex of $1,3/boe, $3,6/boe and 1,2$/boe, which were the estimates of Cove Energy for the Rovuma offshore Area 1. However these values might be lower if investment synergies between Area 1 and Area 4 for commercialization infrastructures materialize. Furthermore, it is public BP and Shell interest in buying 20% of Eni’s share on Rovuma Area-4 for $4bn,corresponding to a $2 bn valuation of Galp’s 10% stake.
Valuation
In our valuation methodology we applied the APV approach in detriment of the DCF approach, since it stands as a more accurate method for projects that display significant capital structure changes throughout its . In Mozambique, like in Angola, the fiscal regime is the PSC, albeit differences in tax rates exist.
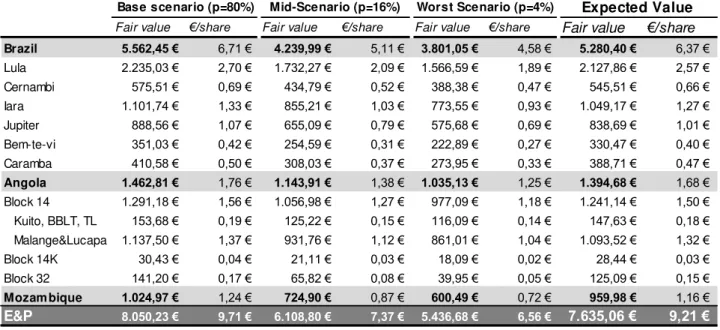
Fair value €/share Fair value €/share Fair value €/share Fair value €/share
Brazil 5.562,45 € 6,71 € 4.239,99 € 5,11 € 3.801,05 € 4,58 € 5.280,40 € 6,37 € Lula 2.235,03 € 2,70 € 1.732,27 € 2,09 € 1.566,59 € 1,89 € 2.127,86 € 2,57 € Cernambi 575,51 € 0,69 € 434,79 € 0,52 € 388,38 € 0,47 € 545,51 € 0,66 € Iara 1.101,74 € 1,33 € 855,21 € 1,03 € 773,55 € 0,93 € 1.049,17 € 1,27 € Jupiter 888,56 € 1,07 € 655,09 € 0,79 € 575,68 € 0,69 € 838,69 € 1,01 € Bem-te-vi 351,03 € 0,42 € 254,59 € 0,31 € 222,89 € 0,27 € 330,47 € 0,40 € Caramba 410,58 € 0,50 € 308,03 € 0,37 € 273,95 € 0,33 € 388,71 € 0,47 €
Angola 1.462,81 € 1,76 € 1.143,91 € 1,38 € 1.035,13 € 1,25 € 1.394,68 € 1,68 € Block 14 1.291,18 € 1,56 € 1.056,98 € 1,27 € 977,09 € 1,18 € 1.241,14 € 1,50 € Kuito, BBLT, TL 153,68 € 0,19 € 125,22 € 0,15 € 116,09 € 0,14 € 147,63 € 0,18 € Malange&Lucapa 1.137,50 € 1,37 € 931,76 € 1,12 € 861,01 € 1,04 € 1.093,52 € 1,32 € Block 14K 30,43 € 0,04 € 21,11 € 0,03 € 18,09 € 0,02 € 28,44 € 0,03 €
Block 32 141,20 € 0,17 € 65,82 € 0,08 € 39,95 € 0,05 € 125,09 € 0,15 €
Mozam bique 1.024,97 € 1,24 € 724,90 € 0,87 € 600,49 € 0,72 € 959,98 € 1,16 €
E&P 8.050,23 € 9,71 € 6.108,80 € 7,37 € 5.436,68 € 6,56 € 7.635,06 € 9,21 €
Mid-Scenario (p=16%) Worst Scenario (p=4%) Expected Value
Base scenario (p=80%) Table 13: E&P Fundamental Value
“COMPANY NAME” COMPANY REPORT
THISDOCUMENTISNOTANINVESTMENTRECOMMENDATIONANDSHALLBEUSED EXCLUSIVELYFORACADEMICPURPOSES (SEE DISCLOSURES AND DISCLAIMERS AT END OF DOCUMENT)
PAGE 16/34 Graph 6: Refineries utilization rate and
oil product consumption
Source: OPEC, BP
Graph 7: Expected surplus/deficit of incremental product output from existing refining projects 2010-2015
Source: OPEC World Oil Outlook 2011
Graph 8:European taxes on oil products
Source: European Commission
12 13 14 15 16 17 77 81 85 89 93
2004 2006 2008 2010 2012
M il li o n b b l/ d ( %)
Europe Utilization rate (%) US Utililization rate (%)
European oil product consumption
-1 -0,5 0 0,5 1 1,5
World US & Canada
Europe Asia -Pacific
Gasoline/Naphtha Middle distillates
Residual fuel Other products
Excise rates (€/litre)
EU current minimum EU Minimum (2018) PT current minimum SP current minimum
Gasoline 0,36 0,36 0,58 0,46
Diesel 0,33 0,39 0,37 0,36
Refining and Marketing (R&M)
Market description
European refining industry has experienced a fragile momentum and the ensuing adjustment process will entail structural changes in the years to come. The Golden age of the refining industry in mid-2000s induced heavy investment in additional production capacity across developed economies to levels that revealed to be excessive, driving refineries utilization rate down to minimum levels, after the financial crisis. On top of this oversupply concern, there is a severe imbalance in the European market between demand and supply of oil products According to OPEC, until 2015, there will be 0,5mb/d of additional capacity in Europe coming from conversion projects and no added capacity thereafter. The aim is to exploit the higher demand for middle distillates; however, it will not be sufficient to fulfill the historical distillate gap and as such a deficit of 0,25 mb/d will persist until 2015. The worst case will be in Asia-Pacific where it is projected a distillate deficit of 0,7mb/d which will require a capacity addition of approximately 10mb/d until 2035. This scenario conveys the idea that middle distillates margins are likely to increase in the future, after have been hit by the financial crisis, contrasting with continuing weak margins for gasoline.
This dieselization phenomenon in Europe is the result of a tax advantage for diesel, given its higher energy content, in contrast with gasoline, as minimum tax rates rely solely upon the value of energy that a product generates, which implies that less efficient fuels bear a higher tax burden per unit of energy produced, notwithstanding its lower CO2 emissions. An amendment of the former Directive 2003/96/EC is set in place aimed to align the minimum excise rates of diesel and gasoline until 2018, however its effect will be inexistent for those Member States whose minimum tax is already above this threshold, such as Netherlands. In case of Portugal and Spain diesel will become slightly more expensive, narrowing the gap between gasoline and diesel consumption in road transportation sector; still diesel will maintain its advantageous position over gasoline, compelling us to believe that the impact of this new environmental on the consumption levels will be limited.
“COMPANY NAME” COMPANY REPORT
THISDOCUMENTISNOTANINVESTMENTRECOMMENDATIONANDSHALLBEUSED EXCLUSIVELYFORACADEMICPURPOSES (SEE DISCLOSURES AND DISCLAIMERS AT END OF DOCUMENT)
PAGE 17/34 Graph 10: x axis: price of Euro-super
95 (€/l); y axis: Diesel price (€/l); 1 -
with taxes, 2 - without taxes
Source: European Commission
Graph 11: Urals and Brent differential
Source: Bloomberg
Graph 12: Conversion spread
Source: Bloomberg 0,65 0,70 0,75 0,80 0,85
0,65 0,70 0,75 0,80 0,85
AT BE BG CY CZ DE
DK EE ES FI FR GR
HU IE IT LT LT LU
LV MT NL PL PT RO
SE SI SK UK
1,20 1,40 1,60 1,80
1,20 1,40 1,60 1,80
0 1 2 3 4 5
2003 2006 2009 2012
Price ($/bbl): Brent -Urals
0,00 2,00 4,00 6,00 8,00 10,00 12,00 14,00
Jan-95 Jan-99 Jan-03 Jan-07 Jan-11 Brent (Cracking -Hydroskimming) Urals (Cracking-Hydroskimming)
products. On top of that, more complex refineries margins were under pressure, as their competitive advantage, reliant on the ability to process heavier and sourer crude oil and transform fuel oil in higher-value products (lighter products) was affected as a consequence of two main factors. (1) the shrinking “conversion spread” which can be approximated through the cracking margin difference between a simple refinery – hydroskimming refinery– and a more complex refinery – cracking refinery; (2) and the narrowing “light-heavy crude oil spread” approximated by the price difference between Brent crude and a sourer and heavier crude, NWE Urals. These effects were the result of a decline in diesel consumption in Europe, which on one hand, reduced the price of middle and light oil products, thereby cutting margins; and, on the other hand, weakened the demand for light crude oil that old refineries must resort to in order to be able to supply lighter products in expansionary periods.
In the mid-term future we expect an increase in the diesel crack spread due to its supply shortage in the European market, leading to enhancing cracking refining margins, which might be capped (1) in short run by the recessionary period that Europe is dealing with and by the fragile; and (2) in the long-run by the decline in diesel consumption on account of environmental regulation and more efficient vehicles. These factors, together with excess of gasoline in the European market will also set the stage for continuing depressed gasoline margins, mitigated by a slight rise in gasoline consumption on account of less disadvantageous taxation relative to diesel.
-40 -30 -20 -10 0 10 20 30 40
2007 2008 2009 2010 2011 2012 2013 2014 2015 2016 2017 2018 2019 2020 Cracking refining margin Ro tterd am h ydroskimming + aro matics Diesel crack Gaso line crack
Fuel o il crack
Graph 9: Benchmark of refining margins
“COMPANY NAME” COMPANY REPORT
THISDOCUMENTISNOTANINVESTMENTRECOMMENDATIONANDSHALLBEUSED EXCLUSIVELYFORACADEMICPURPOSES (SEE DISCLOSURES AND DISCLAIMERS AT END OF DOCUMENT)
PAGE 18/34 Graph 13: Portuguese oil products trade
balance (2010)
Source: DGEG
Graph 14: Refininf margins differential with and without conversion project
Source: Galp Energia, Analyst estimates
Graph 15: Return on the New Invested Capital
Source: Galp Energia, Analyst estimates -1,5 -1,0 -0,5 0,0 0,5 1,0 1,5
LPG gasoline Jets Diesel Fuel
M il li o n T o n n e s
Imports Export Net
0,00 0,75 1,50 2,25 3,00 0 2 4 6 8
Differential Old refining margin New refining margin
0% 4% 8% 12% 0 75 150 225 300
2012 2013 2014 2015 2016 2017 2018 2019 2020
m il li o n E u r
EBIT ROIC after upgrade
Lastly, the hydroskimming margin, for its simplicity, reflected in a high percentage of heavy oil products26, is doomed to worsen in comparison with recent performance, as more complex refineries become more frequent in Europe, namely refineries with cracking and hydrocracking systems. Fuel oil cracking margin is estimated to reverse towards lower margins than that of the pre-crisis period, as a result of potentially tighter environmental regulation and increasing crude oil prices, creating incentives to replace fuel oil by alternative energy sources, especially gas.
Conversion project
Galp has a cracking refinery in Sines and hydroskimming refinery in Matosinhos, with a capacity of 220.000 and 110.00 barrels per day, respectively. Following the dieselization trend observed in the Iberian market, Galp initiated its refineries conversion project in 2008 and it is expected to be concluded in the mid 2012, one year after than initially planned and requiring an overall investment of €1,4bn, €100million above the initial estimate. Upon conclusion, the Nelson complexity index of its refineries is expected to ascend to an overall 8,7, through the introduction of a vacuum distillation in Matosinhos and a hydrocracker in Sines, placing Galp above the European average of 7,9. It will allow Galp to obtain a higher percentage of diesel production out of the product slate, in detriment of less fuel oil (see appendices 1). The economics of such strategy rely on three main factors: (1) increase in revenues, due to the shortage supply of diesel products in the Iberian market; (2) increase in refining margins, since heavier crude oil, thus cheaper, can now be processed and for the same barrel of oil the percentage of diesel output is higher; (3) augmented flexibility, as wider range of crude oil can be used.
We assume in our model the conversion project will be fully operational only in 2013, after conclusion in 2012. When inquired Galp stated that the new benchmark for its refining margins is composed of 70% of cracking margin and 30% of hydroskimming plus aromatics margin. According to the abovementioned refining margins estimates and taking into account the new product slate, upon implementation, we expect a margin improvement of $2,07/bbl by 2013, in comparison with refining margin without upgrading project. Our expectation is
26
“COMPANY NAME” COMPANY REPORT
THISDOCUMENTISNOTANINVESTMENTRECOMMENDATIONANDSHALLBEUSED EXCLUSIVELYFORACADEMICPURPOSES (SEE DISCLOSURES AND DISCLAIMERS AT END OF DOCUMENT)
PAGE 19/34 Graph 16: Breakdown of retail sales
Source: Galps Energia
Graph 17:Galp’s refining and marketing margins forecast
Source: Galp Energia, Analyst estimates
9,0 9,5 10,0 10,5 11,0 11,5 12,0
0% 25% 50% 75% 100%
2007 2008 2009 2010 2011
Wholesale Retail Others LPG Sales to direct clients (Mton)
-2 -1 0 1 2 3 4 5 6
2009 2011 2013E 2015E 2017E 2019E
EBIT refining index EBIT marketing index
however lower than Galp’s incremental refining margin prospect, which lies within the range of $2,5 -3,5/bbl, as we believe margins will continue to be depressed as a result of the dire macroeconomic situation. However, the improvement particularly in the diesel cracking margin, coupled with a more negative fuel crack, will set the tone for a widening gap in the upcoming years, expected to reach $2,8/bbl by 2020. The low refining margins in the mid-term will result in negative operating profit until 2014, however the investment made in the conversion project generates an additional EBIT relative to no-project scenario that entails a rate of return always higher than the WACC of the investment, with exception for 2012. We believe it was a crucial project to implement given the shortage of diesel in the Iberian market that in the upcoming years will provide a competitive advantage to more complex refineries. It was however a bad timing to proceed with it, considering that since the approval of the project in January of 2007, refining margins have been squeezed and have never return to the pre-crisis values.
Marketing
The last component of the oil’s value chain is the marketing segment that Galp uses to connect with end-customers. Typically, marketing segment is a very stable stream of cash flows for Galp, displaying an historical EBIT margin per barrel of €16/ton with low volatility and thus we don’t expect major changes in the marketing segment in the upcoming years. Galp has its own distribution network across the Iberian Peninsula and part of Africa, composed of 1502 service stations and 595 convenience stores, through which it sold 10,5Mton in 2011, having allocated to the Iberian market 93% of the oil products. In this market, historically, Galp have channeled 55% of its sales volume to Portugal and thus 45% to Spain, possessing an Iberian market share of 14%, ranking fourth in market share wise. In the Portuguese market, Galp holds a leading position at the retail level that has been however eroded over the past years in favor of the strengthened position of hypermarkets, which in 2011 reached 20%.27. The competitive advantage of the latter relies upon a low price strategy aimed at attracting customers to their core business. In 2011, average price difference between these players and the main oil companies was on average 0,12€/L and 0,13€/L in diesel and gasoline, respectively. The extended recessionary period in
27
“COMPANY NAME” COMPANY REPORT
THISDOCUMENTISNOTANINVESTMENTRECOMMENDATIONANDSHALLBEUSED EXCLUSIVELYFORACADEMICPURPOSES (SEE DISCLOSURES AND DISCLAIMERS AT END OF DOCUMENT)
PAGE 20/34 Graph 18: Protuguese market share of oil
products
Source: AdC
Graph 19: Galp oil product sales estimates
Source:FMI, Analyst estimates Market share
(%) 2008 2010
Galp 40-45 30-35
BP 15-20 15-20
Repsol 15-20 15-20
Cepsa 5-10 5-10
Independents 7 9
Supermarkets 12 18
Δ% GDP Spain
Δ% GDP
Portugal
Sales (M ton)
2011 - - 16,31
2012E -1,8% -3,3% 16,05
2013E 0,0% 0,0% 16,06
2014E 1,2% 2,1% 16,25
2015E 1,6% 1,9% 16,46
2016E 1,8% 1,9% 16,65
Portugal, together with the tightening fiscal policies set in place in Portugal for the upcoming years, will sustain the rise in market share of these players; however this effect is mitigated due to several factors: firstly price elasticity of oil products has been historical close to zero28, conveying the idea of low customer’s sensitivity to prices differentials; secondly as a supplier of these players, to a certain extent Galp profits with competitors increasing market share; thirdly, hypermarkets cannot compete in product diversification and in refined product quality if we assume that Galp does not sell its best refined output to direct competitors. For these reasons, we don’t expect their market share to go beyond 25% up to 2015, after which time economy is predicted to rebound and price effect will be negligible. Historically, income has however a more significant impact on crude oil demand that price variations29; we therefore used GDP growth rates for Spain and Portugal until 2020 as a proxy for the disposable income and used an income elasticity of one30, in order to predict total volume of product sales. African market is expected to display some external growth, however of negligible impact in the overall marketing sector in terms of revenues for the mid-term time frame.
Valuation
We value both segments separately using a DCF approach and assuming a terminal growth rate of 2% in line with inflation rate, as the refining and marketing segment is a mature and real growth is expected. In both segments we assume maintenance capex and increase in the number of service stations, which is has been more significant in Africa.
28
(Krichene, 2005) - A Simultaneous Equations Model for Oil Crude Oil and Natural Gas market, IMF; (Baranzini & Weber, 2012)
29
(Krichene, 2005) - A Simultaneous Equations Model for Oil Crude Oil and Natural Gas market, IMF
30
(Krichene, 2005) - A Simultaneous Equations Model for Oil Crude Oil and Natural Gas market, IMF
Fair value €/share Fair value €/share Fair value €/share Fair value €/share
Refining 1.014,86 € 1,22 € 884,79 € 1,07 € 209,28 € 0,25 € 961,83 € 1,16 € Marketing 1.730,45 € 2,09 € 1.625,23 € 1,96 € 616,73 € 0,74 € 1.669,06 € 2,01 €
R&M 2.745,31 € 3,31 € 2.510,02 € 3,03 € 826,01 € 1,00 € 2.630,89 € 3,17 €
Base scenario (p=80%) Mid-Scenario (p=16%) Worst Scenario (p=4%) Expected Value
Graph 20: R&M fundamental value
“COMPANY NAME” COMPANY REPORT
THISDOCUMENTISNOTANINVESTMENTRECOMMENDATIONANDSHALLBEUSED EXCLUSIVELYFORACADEMICPURPOSES (SEE DISCLOSURES AND DISCLAIMERS AT END OF DOCUMENT)
PAGE 21/34
Gas and Power (G&P)
Market description
According to EIA, worldwide demand for natural gas will increase up from 22,71 Tcf to 26,55 Tcf over the period 2009-2035. This rise in demand will be mostly stirred by non-OECD countries, notably China and India, which will be accompanied by a increase Henry Hub spot price that will steadily increase throughout the same period reaching $7,07/MBtu in 2035. Excluding renewable energy that presently represents a low source of energy base, natural gas is expected to be fastest-growing fuel, ranking first as the alternative to oil in the long-term, ahead of nuclear and coal energy sources. Demand for coal is predicted to weaken, in detriment of natural gas, as a result of tighter environmental regulation on higher-carbon fuels, whilst nuclear energy does not stand as a viable alternative mainly due to safety concerns, but also because of its extremely high capital expenditures required.
In Europe end-price of natural gas varies significantly across regions, with pipeline transportation constraints, taxes and geographical location playing an important role, making the pricing method difficult to homogenize, resulting in less transparency. Typically, as importers of this resource, European countries establish bilateral long-term contracts with their suppliers, which are mainly Russia, Norway and Algeria, to obtain natural gas through pipelines. In US market there is however a natural gas spot price – Henry Hub Natural Gas; as in UK where the reference is the NBP gas. As a benchmark there is however It is believed that the globalization of natural gas markets will be further enhanced with LNG31 technology, as the increasing distance between supply and demand will make this alternative economically viable32.
31
Liquefied Natural Gas
32
“COMPANY NAME” COMPANY REPORT
THISDOCUMENTISNOTANINVESTMENTRECOMMENDATIONANDSHALLBEUSED EXCLUSIVELYFORACADEMICPURPOSES (SEE DISCLOSURES AND DISCLAIMERS AT END OF DOCUMENT)
PAGE 22/34
Natural Gas
The Gas business segment is composed of sourcing, storage, distribution and marketing of Natural Gas. Sourcing is a liberalized activity, in which Galp imports NG through LNG carriers that unload at the Sines Terminal or through pipelines connected to Nigeria and Algeria. In the latter, its transportation is assured through 3 international pipelines, whose capacity rights of two of them - Al-Andaluz and Extremadura pipelines - are owned by Galp until 2020. Galp established long-terms agreements with NLNG and Sonatrach for the purchase of LNG and NG, respectively;
Galp storage activity is carried out under a concession conceded by the Portuguese state until 2046. As of 2011, Galp’s RAB33 was equal to €18M, corresponding to a storage capacity of 40 Mm3 and rate of return of 8%. By the end of 2012, 71 Mm3 of additional capacity are forecasted to be fully operational, requiring an overall estimated investment of €29,0M34. Furthermore, Galp’s prospects include the construction of two more cavities – TGC G1 and TGC G2 – scheduled to come into operation in 2019,which will bring in 118 Mm3 of additional storage capacity, entailing a total Capex of €48M. Storage activity is regulated by the Portuguese energy market regulator, ERSE, which sets the permitted revenues35 available to Galp. This value equates to the sum of the (1) cost of capital36, (2) operating expenses and (3) tariff deviation; the cost of capital is the product of the RAB times the allowed asset return, set at 8% by ERSE until June 2013, plus a depreciation component. The tariff deviation results from the difference between actual and estimated permitted revenues for year n-2. According to ERSE, the rate of return of 8% for storage and 9% for distribution are not predicted to be reduced after 2013, which we believe to be a reasonable assumption, considering that WACC is fairly below this rate and as such firms have room for value creation.
In Portugal, Natural Gas distribution is composed of six local distribution companies (LDCs) and four autonomous natural gas distribution units (AGUs). LDCs are granted the right to operate the NG distribution grid as concessionaires within a limited geographic area, being responsible for NG distribution conducted
33
Regulated Asset Base
34
ERSE – Análise dos Investimentos do Sector de Gás Natural
35
Allowed revenues = Cost of capital + Oper. Expenses + Tariff deviation
36
Cost of capital = RAB*Rate of return + Depreciation
Source: Galp Energia