Douglas Mesquita Carneiro, Carlos Eduardo Lobo Silva
OCCUPATIONAL EMPLOYMENT
PATTERN AND FUNCTIONAL
SPECIALIZATION IN THE
BRAZILIAN CITIES*
Abstract: the objective of this paper is to analyze the location pattern of occupational employment in Brazil in 2010, as well as to test of the hypothesis of functional spe-cialization according to the size of Brazilian municipalities and if this spespe-cialization changes according to the industrial sector. For this, we used the local Moran’s I and the Locational Quotient. The results show that there is significant spatial heterogene-ity in the distribution of occupations in the industrial sector in Brazilian municipali-ties. In addition, the hypothesis of functional specialization in function of the size of the cities and the importance to analyze each sector separately was confirmed. As not all sectors present the same pattern of functional specialization, especially for occu-pations related to management and R&D activities. These results provide additional information to understand sectoral and occupational structure of regional economies, factors that have a direct influence in the regional growth and development.
Keywords: Occupations. Functional specialization Municipalities. PADRÃO OCUPACIONAL E ESPECIALIZAÇÃO FUNCIONAL NAS CIDADES BRASILEIRAS
Resumo: o objetivo deste artigo é analisar o padrão de localização do emprego ocupacional no Brasil em 2010, bem como testar a hipótese de especialização fun-cional em função do tamanho dos municípios do Brasil e se esta varia de acordo com setor industrial analisado. Para tanto, faz-se uso do índice I de Moran local e do Quociente Locacional (QL). Os resultados encontrados mostram que existe sig-nificativa heterogeneidade espacial na distribuição das ocupações dentro do setor industrial nos municípios brasileiros. Também se confirma a hipótese de especiali-zação funcional em função do tamanho das cidades e a importância de se analisar cada setor separadamente, pois nem todos os setores apresentaram o mesmo padrão de especialização funcional. Esses resultados fornecem informações que auxiliam na compreensão da estrutura setorial e ocupacional das economias regionais, fato-res estes que influenciam diretamente o cfato-rescimento e desenvolvimento regional. Palavras-chave: Ocupações. Especialização funcional. Municípios.
eISSN: 2448-0460. DOI
10.18224/baru.v6i1.8313
AR
PATRÓN OCUPACIONAL Y ESPECIALIZACIÓN FUNCIONAL EN LAS CIUDADES BRA-SILEÑAS
Resumen: el objetivo de este artículo es analizar el patrón de ubicación del empleo ocupacional en Brasil en 2010, así como probar la hipótesis de la especialización funcional de acuerdo con el tamaño de los municipios en Brasil y si varía según el sector industrial analizado. Para este propósito, se utilizan el índice Moran I local y el cociente de ubicación (QL). Los resultados encontrados muestran que existe una heterogeneidad espacial significativa en la distribución de ocupaciones dentro del sector industrial en los municipios brasileños. La hipótesis de la espe-cialización funcional también se confirma debido al tamaño de las ciudades y la importancia de analizar cada sector por separado, ya que no todos los sectores mostraron el mismo patrón de especialización funcional. Estos resultados proporcionan información que ayuda a comprender la estructura sectorial y ocupacional de las economías regionales, factores que influyen directamente en el crecimiento y el desarrollo regional.
Palabras clave: Ocupaciones. Especialización funcional. Ciudades.
P
roduction agglomeration is one of the most remarkable characteristics of the geo-graphy of economic activities and is probably the most direct evidence of the ge-neral need of the companies for benefiting from the presence of externalities (LA-FOURCADE; MION, 2007).Modern agglomeration theories have started with Marshall’s externalities. According to Marshall (1920), external economies are the main sources of industrial agglomeration. Therefore, companies group in a certain location, as they obtain increasing scale returns deriving from factors such as knowledge spillovers, the possibility of specializing in the supply of goods and services and the existence of a contingent of specialized workers (pooling).
In this regard, the location decision of industrial companies may be influenced by various factors, such as transportation costs, scale economies and technology spillovers (FUJITA, THISSE, 2002; KRUGMAN, 1991; VENABLES, 1996). The interaction of these factors creates new forces favorable to agglomeration and may explain the distribution of economic activity in space.
However, these traditional approaches focused on the industrial structure of the regions, leaving an open gap, as they have not put much attention to the supply side of industrial production, especially the role of occupations or skills as an increasing source of productivity and profitability of companies (WAN et al., 2013).
Barbour and Markusen (2007) add that if occupational compositions of the sectors can vary substantially between regions, assumptions based only on sector analysis could result in poorly targeted workforce and economic development programs. With empirical data, Currid and Stolarick (2010) show that “evaluating occupations and industries simultaneously can lead to a better understanding of a policy approach towards regional competitiveness and possibilities for growth”. Thus, the analysis of a regional economy should be prepared to consider the occupational employment in addition to industry.
In this context, there are some prepositions that point out the importance of analyzing the occupational/functional structure of a regional economy. First, analysis
of the occupational structure has gained importance because they can provide, through channels such as local human resources, skills, education, important insights for regional development (KOO, 2005).
Second, in recent years there has been increased mobility of companies and productive fragmentation across geographic areas (FOCHEZATTO, 2016). The fragmentation process consists of a change in the organization of companies generated from the separation of management and production functions in the companies (DURANTON; PUGA, 2005).
According to Scott (2009) the growing fragmentation of companies can be explained by the reduction in transportation and cost factors that have enabled companies located in large urban concentrations to fragment certain functions, which were previously vertically integrated. Silva and Hewings (2010), in turn, show that even though external factors to the company are important to explain industrial fragmentation, factors related to the internal organization of the company should be considered, more specifically communication costs and managerial structure.
The factors affecting fragmentation of companies eventually change the occupational composition of cities as well. Causing management and R&D functions to concentrate in larger cities, while functions related to production tend to locate in small cities (BADE et al., 2004; DURANTON, PUGA, 2005).
Empirical evidence confirms this location pattern, that is called functional specialization, suggesting that the occupational activities related to high-level of cognitive work tend to be concentrated in large cities, whereas the capital-intensive work tends to be concentrated in small cities (ELVERY, 2010; SCOTT, 2009).
Brunelle (2013) adds that since sectoral specialization is still about to be an important attribute of local economic development, regions are increasingly differentiating by specialization in activities and tasks performed within a given industry. Thus, from the point of view of regional development, it is not enough to attract a particular sector of activity, it is also necessary to analyze the profile of occupations that will happen in the region (FOCHEZATTO, 2016).
However, there are some occupations whose the distribution between the cities differs more significantly according to the sector. Elvery (2010) suggest that information on how occupational mixes vary across city size in different industrial sectors may shed light on whether such differences are concentrated in certain sectors of the economy. Thus showing that functional specialization may be different, not only according to city size, but also according to the industrial sector.
According to what was presented so far, the present analysis has three purposes. The first is to identify spatial location patterns of occupations in Brazilian municipalities in 2010. The second is to verify whether there is functional specialization according to the size of Brazilian municipalities. And more, if these patterns of functional specialization differ across industries, justifying both occupational analysis as sectorial.
Initially, the local Moran’s I (LISA) is used to analyze the spatial location patterns of occupations. Subsequently, to test the other two hypotheses, the Locational Quotient (LQ) shall be used.
In order to verify whether there is difference in the occupational structure according to the size of the city, an urban hierarchy-based typology shall be used. This typology, considering the size of population, reflects the fact that economic activities at the top of urban hierarchy differ substantially from those at the bottom of urban hierarchy. Sectoral differences will be obtained by analyzing the industrial sector as a whole and then each of 12 industrial sectors separately.
The analysis carried out herein is relevant due to three reasons. First, the importance of function analysis by city size is directly related to local development, as the occupations (functions) that comprise a city are associated to labor skills and to the capability of companies, and those may be features that generate economic prosperity for the cities (MARKUSEN; VENABLES, 2013).
Second, the expanded analysis for each industrial sector enables to gather information on the differences between industries, regarding technical and organizational restraints of spatial fragmentation of functions (BADE et al., 2015). Last of all, the present paper fills a gap in the national literature by providing functional employment mapping, at a disaggregated regional level, using a combined approach of industry and occupation.
The remainder of the paper is organized as follows. The second section details the methodology and the database used in the paper. The third section presents the findings and the fourth section concludes the paper.
METHODOLOGY Data Sources
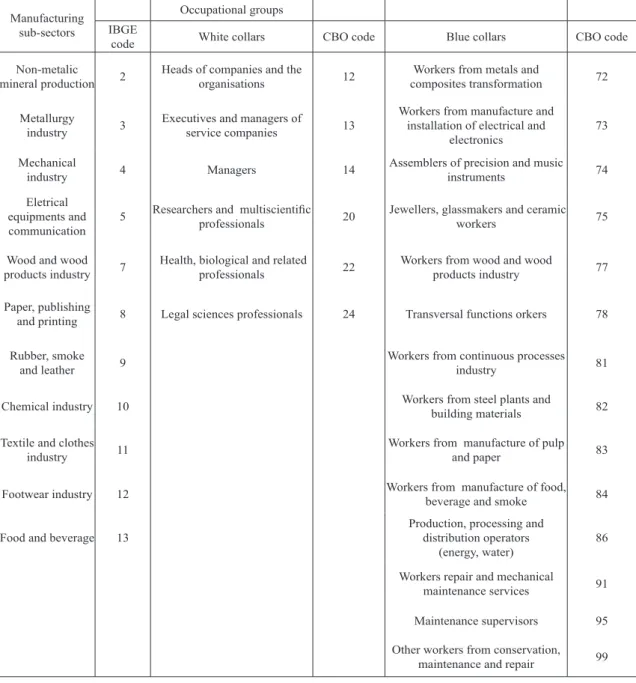
For this analysis, the database containing 5564 Brazilian municipalities, 12 manu-facturing sectors and 22 occupational sub groups (Table 1). We use information deriving from Annual Social Information Report (RAIS), Institute of Applied Economic Research (Ipeadata) and Brazilian Institute of Geography and Statistics (IBGE). All data used are from 2010.
Through data provided by RAIS, it is possible to obtain the variables related to oc-cupational and sectoral employment. The database of Ipeadata and IBGE was used, thus gathering information regarding the total population of each municipality.
Regarding the occupation of individuals, those were classified according to the main Sub-Groups of the Brazilian Classification of Occupations (CBO) 2002. CBO 2002 is composed as follows: ten great groups, 48 main sub-groups, 192 sub-groups, 607 base groups and 2511 occupations, such structure implies a competence level for each group.
Note: prepared by the authors.
The occupational sub-groups used in the sample are divided in white-collar and blue-collar occupation (Table 1), such division is in conformity with Duranton and Puga (2005) and Bade et al. (2015). Both occupation groups, white-collar and blue-collar, cor-respond to approximately 66% of the total industrial employment. The remaining occu-pations are basically related to technical level occuoccu-pations, they were excluded from the sample for not being part of the scope of the work.
Local Moran’s I (LISA)
The identification of spatial location patterns of occupations will be done through local Moran’s I (LISA). This methodology provides a means to view and to identify diffe-rent patterns of spatial distribution of occupations between and across sectors.
Table 1: Sectoral and occupational information
Manufacturing sub-sectors
Occupational groups IBGE
code White collars CBO code Blue collars CBO code Non-metalic
mineral production 2 Heads of companies and the organisations 12 composites transformationWorkers from metals and 72 Metallurgy
industry 3 Executives and managers of service companies 13
Workers from manufacture and installation of electrical and
electronics 73 Mechanical
industry 4 Managers 14 Assemblers of precision and music instruments 74 Eletrical
equipments and communication 5
Researchers and multiscientific
professionals 20 Jewellers, glassmakers and ceramic workers 75 Wood and wood
products industry 7 Health, biological and related professionals 22 Workers from wood and wood products industry 77 Paper, publishing
and printing 8 Legal sciences professionals 24 Transversal functions orkers 78 Rubber, smoke
and leather 9 Workers from continuous processes industry 81 Chemical industry 10 Workers from steel plants and building materials 82 Textile and clothes
industry 11 Workers from manufacture of pulp and paper 83 Footwear industry 12 Workers from manufacture of food, beverage and smoke 84 Food and beverage 13 Production, processing and distribution operators
(energy, water) 86 Workers repair and mechanical
maintenance services 91 Maintenance supervisors 95 Other workers from conservation,
According to Anselin (1995), the local indicators of spatial association (LISA) are calculated as follows:
where n indicates the number of municipalities, are the elements of the spatial weight matrix, and are the values of the used variable (occupational LQ), while i and j refer to the different municipalities.
The findings deriving from the application of this indicator show two possible types of clusters or outliers, thus indicating that the regions may present two distinct or similar patterns, according to the variable used.
In order to model spatial interactions between municipalities, it is necessary to specify a structure that defines neighbors, and the tool used to represent this connectivity is the spatial weight matrix.
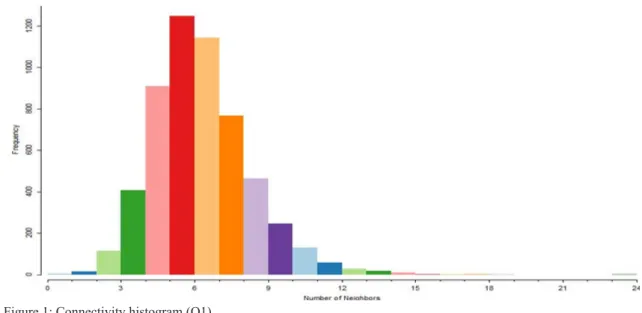
The matrix choice is according to the structure of the sample. This neighborhood structure, obtained with a first order Queen contiguity matrix, may be viewed through the connectivity histogram (Figure 1). This Figure describes the distribution of locations by number of neighbors.
Figure 1: Connectivity histogram (Q1)
Figure 1 indicates a very unbalanced connectedness structure of neighbors. A common solution to this problem consists of considering nearest neighbors weight matrices, forcing each unit to have the same number of neighbors (ANSELIN, 2002; DE DOMINICIS et al., 2013). In this paper, the spatial weights matrices of the nearest k-neighbors (k=5) shall be used.
Location Quotient (LQ)
In order to check whether there is functional specialization in municipalities in Brazil, and whether such localization pattern changes according to the size of the municipality,
the Location Quotient (LQ) was used. The location quotient (LQ) is commonly used to identify territorial specialization because they show the spatial agglomeration regardless of the size of the place, and it has some good characteristics, such as simplicity, transparency and data requirements (LAZZERETTI et al., 2008).
LQ compares the relative specialization of a region in an occupation regarding the national average and is defined as:
(2) where i is each group of occupation and j stands for each municipality j ( j = 1, . . ., 5564), is the municipality employment at each occupational group, is the total municipality employment, is national employment by occupational group and is the national employment.
A value above one indicates an employment share in an occupation i in a municipality j larger than the national average. An LQ below 1 indicates that this share is below the national average.
Calculation of LQ was made at occupational, sectoral and municipal levels. More specifically, the occupational group indexes (white and blue) were calculated within the entire industry and for each municipality. It was also calculated for each occupational group, within each of the 12 industrial sectors and for each municipality.
As an additional control of correction of potential irregularities in the data in small municipalities, a minimum cut-off of 50 employees in the municipality was used. Such procedure is according to international literature (BERTACCHINI, BORRIONE, 2013; HENDERSON, ONO, 2008; LAZZERETTI et al., 2008).
In order to find answers regarding functional specialization according to the size of the municipality, the municipalities were divided in five classes of size according to the population1 (Table 2). Then the average was calculated for each
population group.
Table 2: Municipality size class
City Size Municipalities % municipalities
<5000 1301 23,38%
Between 5000 and 19999 2612 46,94%
Between 20000 and 99999 1368 24,59%
Between 100000 and 500000 245 4,40%
>500000 38 0,68%
Source: Ipeadata and IBGE. Note: prepared by the authors.
RESULTS
Exploratory Data Analysis
The database contains 5564 Brazilian municipalities, from this total, approximately 83% of the municipalities have personnel employed in the industrial sector (Table 3). Observing the occupations in the industrial sector, blue-collar occupations are present in 96% of these municipalities, while white-collar occupations appear in approximately 73% of the municipalities with presence of the industrial sector.
Distribution of occupations among municipalities is more distinct when industrial sub-sectors are analyzed (Table 3). The sector that is present in most municipalities is food and beverage, comprising 3926 (70.56%) Brazilian municipalities. The distribution of white and blue collar occupations in the food and beverage sector in these municipalities is similar to what is found for the industrial sector as a whole.
The footwear industry is the one which is located in a lower number of municipalities amongst the thirteen sub-sectors, being located in only 739 (13.28%) municipalities. This sector also has a major difference regarding distribution of occupations, as blue-collar occupations are present in almost the total of these municipalities (92.83%), while white-collar are in less than half of the locations with footwear industry (44.52%)
The sector with the greatest difference in the distribution of occupations between municipalities is the metallurgy industry. Blue-collar occupations are in 95.92% of the municipalities with the presence of this sector, while white-collar occupations are in only 44.58% of the municipalities.
Table 3: Municipalityinformation
Source: RAIS.
Note: prepared by the authors.
Municipalities with manufacturing
employment %
Municipalities with white collar
occupations %
Municipalities with blue collar
occupations % All Manufacturing sub-sectors 4642 83,43% 3424 73,76% 4459 96,06% Non-metalic mineral production 2859 51,38% 1410 49,32% 2581 90,28% Metallurgy industry 2452 44,07% 1093 44,58% 2352 95,92% Mechanical industry 1498 26,92% 776 51,80% 1400 93,46% Eletrical equipments and
communication 787 14,14% 416 52,86% 672 85,39% Transport materials industry 997 17,92% 487 48,85% 913 91,57% Wood and wood products industry 2852 51,26% 1390 48,74% 2703 94,78% Paper, publishing and printing 1916 34,44% 881 45,98% 1697 88,57% Rubber, smoke and leather 1510 27,14% 790 52,32% 1258 83,31% Chemical industry 1863 33,48% 1195 64,14% 1621 87,01% Textile and clothes industry 2602 46,76% 1364 52,42% 2442 93,85% Footwear industry 739 13,28% 329 44,52% 686 92,83% Food and beverage 3926 70,56% 2474 63,02% 3603 91,77%
The findings presented in Table 3 indicate the existence of industrial fragmentation by functions in Brazilian municipalities, as in all of the sectors reviewed there is a difference between the number of municipalities with blue and white collar occupations. It is also noteworthy that there are differences between industrial sectors regarding the presence of industrial employment in municipalities as well as the occupational distribution in the cities, and such facts show the importance of both sectoral and occupational analysis.
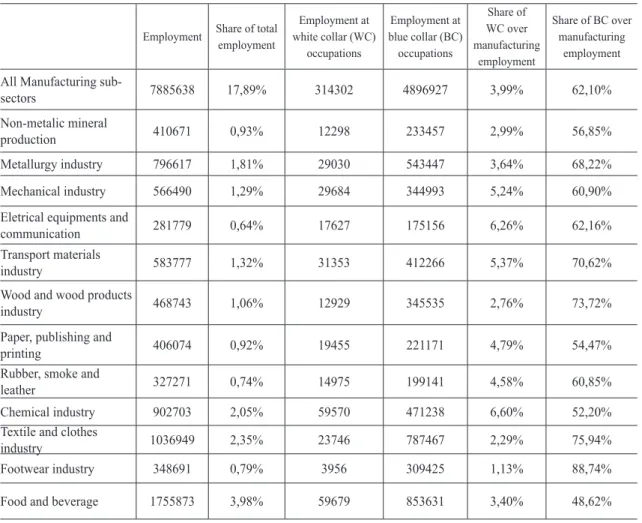
Employment distribution is also distinct when industrial sectors and occupations in these sectors are analyzed. Despite the importance of the industrial sector for economic dynamics, employment in this sector represents 17.89% of total formal employment (Table 4). Blue-collar occupation represents approximately 62% of all industrial employment, which is almost two-thirds of the total of industrial employment in Brazil, while white-collar is almost 4%.
Table 4: Sectoral and occupational employment
Employment Share of total employment
Employment at white collar (WC) occupations Employment at blue collar (BC) occupations Share of WC over manufacturing employment Share of BC over manufacturing employment
All Manufacturing
sub-sectors 7885638 17,89% 314302 4896927 3,99% 62,10% Non-metalic mineral
production 410671 0,93% 12298 233457 2,99% 56,85% Metallurgy industry 796617 1,81% 29030 543447 3,64% 68,22% Mechanical industry 566490 1,29% 29684 344993 5,24% 60,90% Eletrical equipments and
communication 281779 0,64% 17627 175156 6,26% 62,16% Transport materials
industry 583777 1,32% 31353 412266 5,37% 70,62%
Wood and wood products
industry 468743 1,06% 12929 345535 2,76% 73,72%
Paper, publishing and
printing 406074 0,92% 19455 221171 4,79% 54,47%
Rubber, smoke and
leather 327271 0,74% 14975 199141 4,58% 60,85%
Chemical industry 902703 2,05% 59570 471238 6,60% 52,20% Textile and clothes
industry 1036949 2,35% 23746 787467 2,29% 75,94% Footwear industry 348691 0,79% 3956 309425 1,13% 88,74% Food and beverage 1755873 3,98% 59679 853631 3,40% 48,62% Source: RAIS.
Note: prepared by the authors.
However, when the sectors are reviewed separately, the percentage of blue and white collar occupation has greater variation. Again, the footwear industry stands out, due to three reasons. First, for being the sector with the lower contingent of employed personnel amongst all sectors, representing only 0.79% of all industrial employment.
Second, for being the sector with the largest percentage of white and blue collar, as almost 90% of sectoral employment is comprised of these occupations. Last of all, the footwear industry has the lowest percentage of white-collar occupation (1.13%) and the highest percentage of blue-collar occupation (88.74%).
The chemical industry, despite being one of those with the highest percentage of industrial employment, is the one with the smallest contingent employed in the occupations reviewed, with 58.8% of the personnel employed in white and blue collar occupations. However, the chemical industry, among all sectors, has the highest percentage of white-collar occupations (6.60%).
It is worth mentioning that the food and beverage sector is the largest industrial sub-sector, in terms of employment, representing almost 4% of industrial employment. It is also the sector with the lowest percentage of blue-collar occupations (48.62%).
The data addressed so far indicate that there are differences in the occupational composition in the sectors. However, they do not make it possible to reach conclusions on the location of occupations in Brazil. In this regard, the next section brings information on the pattern of spatial location of the occupations in Brazilian municipalities.
Results from Local Moran’s I (LISA)
The findings obtained with the application of LISA enable the identification of four patterns of spatial location. More specifically, for this article, significant high-high values mean municipalities with high LQ surrounded by municipalities with high LQ, as low-low mean municipalities with low LQ surrounded by municipalities with low LQ. High-low values indicate municipalities with high values of LQ surrounded by locations with low LQ values, and low-high means that municipalities with low values of LQ surrounded by locations with high LQ values.
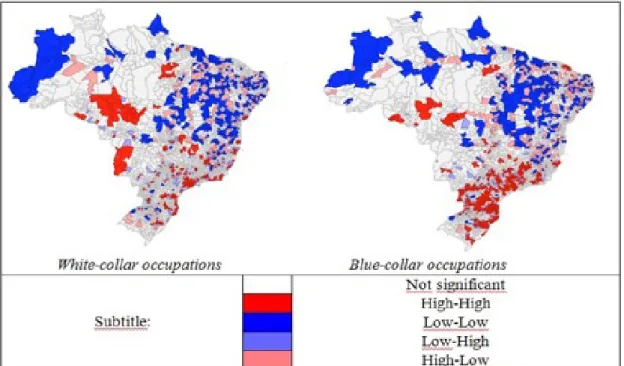
Figure 2 presents the results of the LISA applied for both occupational groups (white and blue) in the manufacturing sector. It is clear at first the difference between the Center-South and North-Northeast regions, with significant differences regarding the composition of clusters. Municipalities located in the Center-South regions appear with dominance of high-high cluster for both occupational groups, while municipalities belonging to the North-Northeast regions have a dominance of low-low type clusters.
Figure 2: LISA map for white and blue collar occupations. Note: prepared by the authors.
Such pattern of spatial location of occupations reflects the heterogeneity of the composition of the Brazilian industrial sector. In the North and Northeast, not only the participation in the industrial sector is low, but also the productive base has low spatial integration, while the Center-South, especially the State of São Paulo, hold great part of the industrial sector in Brazil, and the industrial productive base presents strong chaining (ARRUDA, FERREIRA, 2014; ARRUDA et al. 2016; PEROBELLI et al., 2010).
Figure 2 allows to see that there are differences between the location of both occupational groups. Blue-collar occupations appear with more high-high type clusters than white-collar occupations. Based on such configuration, it is possible to infer that there is a production fragmentation in Brazilian municipalities, as the occupational group related to production activities is more distributed in municipalities in Brazil than the occupational group related to management and research and development activities.
When the sub-sectors are analyzed separately, the regional inequalities in occupational distribution are even more remarkable (Figures A.1 and A.2). The predominant location tendency in the Center-South is visible for both occupational groups in virtually all sectors. Exception for wood and wood products industry, which high-high clusters are more strongly located in municipalities of the South and North regions.
The sectors with greater occupational distribution among Brazilian municipalities are non-metalic mineral production and food and beverage sectors. Although these sectors are more distributed, the location pattern differs between regions, with high-high clusters located predominantly in municipalities of the Center-South region, while the high-low pattern is in the North-Northeast regions.
What may be perceived by comparing the differences between white-collar and blue-collar occupations among sectors is that the latter occupational group has a larger number of significant values for the four location patterns than the first group. This result
indicates a fragmentation of industrial activity in Brazil, since the activities related to management and research and development are located in less municipalities than the activities related to production.
However, it is worth mentioning that in this pattern, production activities seem to be located in municipalities near to white-collar occupations. It is possible to conclude, then, that despite the existence of productive fragmentation, it does not reduce regional inequalities of occupational distribution.
The analysis of occupational location pattern focuses on the different occupational compositions in the sectors. It indicates, initially, that stimulus policies and attraction of certain sectors should be prepared taking into consideration the occupational composition of sectors. In this regard, the next section brings findings that help deepening the understanding about sectoral and occupational dynamics of Brazilian municipalities according to population size.
Results from locational quotient (LQ)
Before presenting and discussing the findings with the application of the locational quotient (LQ), it is worth showing the initial findings on the distribution of industrial employment and occupational distribution by municipality size (Table 5). The data obtained indicate that over half of the industrial employment and half of the population of Brazil is concentrated in cities with more than one hundred thousand inhabitants. While cities with less than 20 thousand inhabitants, notwithstanding being 70% of the total, have little more than 10% of industrial employment and approximately 17% of the population.
Distribution of occupational employment by city size shows a higher concentration of white-collar occupations in large cities, with little more than 43% of these occupational group located in cities with more than 500 thousand inhabitants. Blue-collar occupations are more present in smaller cities, compared to white-collar, with approximately 40% of the blue-collar located in cities with no more than one hundred thousand inhabitants.
The data presented in Table 5 help introducing the issue of occupational dynamics in Brazilian municipalities, indicating, at first, an occupational concentration in favor of large cities. Secondly, it shows the existence of fragmentation of industrial activities and a possible functional specialization in Brazilian municipalities.The data presented in Table 5 help introducing the issue of occupational dynamics in Brazilian municipalities, indicating, at first, an occupational concentration in favor of large cities. Secondly, it shows the existence of fragmentation of industrial activities and a possible functional specialization in Brazilian municipalities.
Table 5: Industrial and occupational employment by city size
Sectors City Size White collar LQ Blue collar LQ All manufacturing sectors <5000 0.65 1.24 Between 5000 and 19999 0.69 1.12 Between 20000 and 99999 0.73 1.01 Between 100000 and 500000 0.92 0.98 >500000 1.22 0.89 Source: RAIS.
Note: prepared by the authors.
Table 6 shows findings of locational quotient (LQ) for white and blue collar occupations in the industry as a whole, separating the cities by groups of population size. With these data, the issue of functional specialization according to city size may be more deeply addressed and analyzed.
The findings show that there is functional specialization in Brazilian cities, but it differs according to city size. It happens because there is functional specialization of small cities in blue-collar occupations, given that in groups of municipalities with no more than 20 thousand inhabitants, the LQ found was higher than 1. Large cities, in turn, seem to be specialized in white-collar occupations, as they bear LQ higher than 1 only in this occupational group.
These results are consistent with the literature on economic specialization of cities (BADE et al., 2004; BRUNELLE, 2013; DURANTON, PUGA, 2005). Indicating that there is a pattern where large cities concentrate functions of management, research and development of companies, while small cities concentrate the production functions of companies.
Table 6: Locational Quotient (LQ) by city size
<5000 0.65 1.24
Between 5000 and 19999 0.69 1.12
Between 20000 and 99999 0.73 1.01
Between 100000 and 500000 0.92 0.98
>500000 1.22 0.89
White collar LQ Blue collar LQ
All manufacturing sectors
City Size Sectors
Source: RAIS and IBGE. Note: prepared by the authors.
This functional specialization pattern can be explained by the wage premium literature that shows that the relative wages of workers assigned to functions with higher levels of skill are, in the average, higher in larger cities (ELVERY et al., 2010). Then, knowledge-intensive functions like management and research and development (R&D) tend to be located preferably in large cities.
Now, the question of whether differences of functional specialization among city sizes also vary between manufacturing sectors. Table 7 shows the results from Locational Quotient (LQ) for white and blue collar occupations inside each industrial sector and city size group.
The LQ findings for blue-collar occupations remain indicating a functional specialization pattern for small cities in the majority of the sectors reviewed. Except for the materials transportation industry, where the LQ value is higher than 1 in small and medium cities.
White-collar occupations, on the other hand, do not follow the functional specialization pattern in 4 of the 12 sectors. In the materials transportation industry and the mechanical industry this occupational group did not present LQ higher than 1 in none of the groups of cities. In the non-metallic mineral production sector and wood and wood products industry, although the highest LQ is in large cities, small cities also have value higher than one.
The findings for the footwear industry are worth mentioning for two reasons. First, in this sector the LQ was higher than one for all groups of city size. And, second, it was the sector with the highest value of locational quotient in large cities, with value higher than 3 in cities with more than 500 thousand inhabitants.
In the remaining sectors, the pattern found was the same of the industry as a whole, with specialization of white-collar occupations only in large cities.
The analysis of each sector separately confirms one of the initial hypothesis, that the functional specialization pattern according to city size differs between the sectors, therefore justifying the application of such analysis. It shall be added that analysis addressing the occupational mix within the specific manufacturing industries enable a better understanding of the economic composition of a region (CURRID; STOLARICK, 2010).the sector with the highest value of locational quotient in large cities, with value higher than 3 in cities with more than 500 thousand inhabitants.
In the remaining sectors, the pattern found was the same of the industry as a whole, with specialization of white-collar occupations only in large cities.
The analysis of each sector separately confirms one of the initial hypothesis, that the functional specialization pattern according to city size differs between the sectors, therefore justifying the application of such analysis. It shall be added that analysis addressing the occupational mix within the specific manufacturing industries enable a better understanding of the economic composition of a region (CURRID; STOLARICK, 2010).
Sectors City Size White collar LQ Blue collar LQ Non-metalic mineral production <5000 0.69 1.34
Between 5000 and 19999 1.11 1.14 Between 20000 and 99999 0.92 1.00 Between 100000 and 500000 1.07 0.84
>500000 1.11 0.73
continua...
<5000 0.65 1.24
Between 5000 and 19999 0.69 1.12
Between 20000 and 99999 0.73 1.01
Between 100000 and 500000 0.92 0.98
>500000 1.22 0.89
White collar LQ Blue collar LQ
All manufacturing sectors
City Size Sectors Metallurgy industry <5000 0.80 1.02 Between 5000 and 19999 0.86 1.08 Between 20000 and 99999 0.83 1.02 Between 100000 and 500000 0.94 0.97 >500000 1.00 0.96 Mechanical industry <5000 0.67 1.22 Between 5000 and 19999 0.74 1.12 Between 20000 and 99999 0.69 1.05 Between 100000 and 500000 0.84 1.00 >500000 0.96 0.95
Eletrical equipments and communication <5000 0.38 1.37 Between 5000 and 19999 0.52 1.14 Between 20000 and 99999 0.79 1.05 Between 100000 and 500000 0.78 0.99
>500000 1.25 0.82
Transport materials industry <5000 0.93 0.95 Between 5000 and 19999 0.50 1.09 Between 20000 and 99999 0.57 1.04 Between 100000 and 500000 0.70 0.97
>500000 0.86 0.90
Wood and wood products industry <5000 1.09 1.09 Between 5000 and 19999 0.96 1.05 Between 20000 and 99999 1.02 0.98 Between 100000 and 500000 1.11 0.92
>500000 1.14 0.90
Paper, publishing and printing <5000 0.43 1.38 Between 5000 and 19999 0.62 1.30 Between 20000 and 99999 0.90 1.10 Between 100000 and 500000 0.91 1.00
>500000 1.00 0.92
Rubber, smoke and leather <5000 0.50 1.38 Between 5000 and 19999 0.47 1.22 Between 20000 and 99999 0.72 1.05 Between 100000 and 500000 0.98 0.94 >500000 1.11 0.82 Chemical industry <5000 0.59 1.18 Between 5000 and 19999 0.55 1.11 Between 20000 and 99999 0.67 1.13 Between 100000 and 500000 0.80 1.08 >500000 1.18 0.95
Textile and clothes industry <5000 0.71 1.20 Between 5000 and 19999 0.84 1.15 Between 20000 and 99999 0.98 1.04 Between 100000 and 500000 1.20 0.97 >500000 1.25 0.94 Footwear industry <5000 1.07 1.05 Between 5000 and 19999 1.01 1.06 Between 20000 and 99999 1.39 1.00 Between 100000 and 500000 1.72 0.94 conclusão continua...
Source: RAIS and IBGE. Note: prepared by the authors.
>500000 3.10 0.81
Food and beverage <5000 1.08 1.34
Between 5000 and 19999 0.96 1.25 Between 20000 and 99999 1.03 1.09 Between 100000 and 500000 1.14 0.99 >500000 1.34 0.83 conclusão FINAL COMMENTS
The present study was aimed at analyzing the location pattern of occupational em-ployment in Brazilian municipalities in the year of 2010. Verifying whether there is func-tional specialization according to city size, and also whether this specialization remains when the industrial sectors are analyzed separately.
In order to reach such objectives, at first the occupations were separated in two groups, white-collar occupations and blue-collar occupations, according to Duranton and Puga (2005) and Bade et al. (2004; 2015). Later, the locational quotient (LQ) was cal-culated for each occupational group in the industrial sector as a whole and each city size group. An exercise similar to the previous one was carried out, however, the analysis was made for each industrial sub-sector. The results arising from the LQ enabled the applica-tion of local Moran's I for the analysis of the spatial locaapplica-tion pattern of the occupaapplica-tions.
The findings show that there is significant spatial heterogeneity in the distribution of occupations inside the industrial sector in Brazilian municipalities. The greatest occu-pational concentrations are located in the Center-South of Brazil, a fact that was verified both for white-collar and blue-collar occupations. The analysis of each sector separately also indicates an even larger difference.
The application of LQ by groups of city size indicates a functional specialization of large cities in white-collar occupations. It indicates that in these cities there is greater presence of knowledge-intensive functions, such as those related to management and re-search and development, than the average of Brazilian cities.
In small cities, on the other hand, the findings indicate that there greater presence of employment related to production functions. It is possible, then, to state that these cities are specialized in blue-collar occupations. This functional specialization pattern, where large cities have higher proportion of white-collar occupations and small cities have higher proportion of blue-collar occupations, is according to international literature (BADE et al., 2004; BRUNELLE, 2013; DURANTON, PUGA, 2005).
The exercise done for the occupational composition of each industrial sub-sector con-firmed the importance of analyzing each sector separately. This is because not all sectors have the same functional specialization pattern, especially for white-collar occupations.
In general, the contribution of the analysis presented herein is towards providing information that may help to understand the structure of regional economies and its
con-sequential development. As the occupational analysis refers to endogenous factors of the region, such as local human resources, education and skills. These factors directly influ-ence regional growth and development.
NotE
1 Such division follows the provisions of IBGE: www.ibge.gov.br
REFERENCES
ANSELIN, Luc. Local indicators of spatial association - LISA. Geographical Analysis, v. 27, n. 2, p. 93-115, April, 1995
ANSELIN, Luc. Under the hood: Issues in the specification and interpretation of spatial regression models. Agricultural Economics, v. 27, n. 3, p. 247-267, Nov. 2002.
ARRUDA, Elano Ferreira; FERREIRA, Roberto Tatiwa. Dinâmica intraregional do Brasil: quem dirige o crescimento industrial das regiões brasileiras? Economia aplicada. v. 18, n. 2, p. 243–27, Abril-Jun. 2014. ARRUDA, Elano Ferreira; FERREIRA, Roberto Tatiwa; CASTELAR, Pablo Urano de Carvalho. Um modelo dinâmico para a atividade industrial e suas repercussões inter/intraregionais e internacionais.
Revista brasileira de estudos regionais e urbanos, v. 10, n. 1, p. 99–126, 16 set. 2016.
BADE, Franz-Josef; BODE, Eckhardt; CUTRINI, Eleonora. Spatial fragmentation of industries by functions. Annals of regional science, v. 54, p. 215-250, Jan. 2015.
BADE, Franz-Josef; LAASER, Claus-Friedrich; SOLTWEDEL, Ruediger. Urban specialization in the internet age – empirical findings for Germany. Kiel working paper, n. 1215, 2004.
BARBOUR, Elisa; MARKUSEN, Ann. Regional occupation and industrial structure: does one imply the other? International regional science review. v. 30, n. 1, p. 72–90, Jan. 2007
BERTACCHINI, Enrico. E.; BORRIONE, Paola. The geography of the Italian creative economy: the special role of the design and craft-based industries. Regional studies. v. 47, n. 2, p. 135-147, 2013. BRUNELLE, Cedric. The growing economic specialization of cities: disentangling industrial and functional dimensions in the Canadian urban system, 1971–2006. Growth and change. v. 44, n. 3, p. 443-473, Aug. 2013.
CURRID, Elizabeth; STOLARICK, Kevin. The occupation–industry mismatch: new trajectories for regional cluster analysis and economic development. Urban studies. v. 47, n. 2, p. 337-362, Feb. 2010. DURANTON, Gilles; PUGA, Diego. From sectoral to functional urban specialization. Journal of urban
economics. v. 57, n.2 p. 343-370, Mar. 2005.
ELVERY, Joel Andrew. City size and skill intensity. Regional science and urban economics, v. 40, n. 6, p. 367-379, Nov. 2010.
FOCHEZATTO, Adelar. Estrutura setorial e distribuição de ocupações nas regiões brasileiras, 2006-2011.
EURE. v. 42, n. 126, p. 237–262, May 2016.
HENDERSON, J. Vernon; ONO, Yukako. Where do manufacturing firms locate their headquarters?
Journal of urban economics. v. 63, n. 2, p. 431-450, Mar. 2008.
KOO, Jun. How to analyze the regional economy with occupation data. Economic development quarterly. v. 19, n. 4, p. 356-372, Nov. 2005.
KRUGMAN, Paul. Increasing returns and economic geography. Journal of political economy. v. 99, n. 3, p. 483-499, Jun. 1991.
LAFOURCADE, Miren; MION, Giordano. Concentration, agglomeration and the size of plants. Regional
science and urban economics. v. 37, n. 1, p. 46–68, Jan. 2007.
creative local production systems in Italy and Spain. Industry and innovation. v. 15, n. 5, p. 549–567, Oct. 2008.
MARKUSEN, James. R.; VENABLES, Anthony. Functional specialization, sectoral specialization, and inter-city trade. Working paper, 2013.
PEROBELLI, Fernando Salgueiro. et al. Estrutura de interdependência inter-regional no brasil: uma análise espacial de insumo-produto para os anos de 1996-2002. Pesquisa e Planejamento Econômico. v. 40, n. 2. p. 281-235, Aug. 2010.
SCOTT, Allen J. Human capital resources and requirements across the metropolitan hierarchy of the USA. Journal of economic geography. v. 9, v. 2, p. 207-226, Mar. 2009.
SILVA, Carlos Eduardo Lobo; HEWINGS, Geoffrey J. D. The locational implications of management and production fragmentation. Estudos Econômicos, v. 40, n. 3, p. 515–533, Sep. 2010.
VENABLES, Anthony. Equilibrium locations of vertically linked industries. International economic
review. v. 37, n. 2, p. 341–359, May 1996.
WAN, Jun; KIM, Jae Hong; HEWINGS, Geoffrey J. D. Inspecting regional economic structural changes through linking occupations and industries. Environment and Planning A. v. 45, n. 3, p. 614–633, Jan. 2013
Recebido em: 09.06.2020. Aprovado em: 08.07.2020 DOUGLAS MESQUITA CARNEIRO
Doutor em Economia (PUCRS). Professor na Universidade Luterana do Brasil (ULBRA), Cam-pus Torres. E-mail: [email protected].
CARLOS EDUARDO LOBO SILVA
PhD em Planejamento Regional pela Universidade de Illinois. Professor (PPGE/PUCRS). E--mail: [email protected].
APPENDIX A – LISA Maps co nt in ua... Figure
A.1: Local Moran’
con
clu
sã
Figure
A.2 :Local Moran’
s I (LISA) for blue collar occupations in each manufacturing sector
co
nsin
con
clu
sã
o
Note: prepared by the authors.
Chemical industry T
extile and clothes industry Footwear industry Food and
beverage
Subtitle: