MASTER IN FINANCE
THIS REPORT WAS PREPARED EXCLUSIVELY FOR ACADEMIC PURPOSES BY TERESA RODRIGUES AND VERA ROCHA,MASTER IN
FINANCE STUDENTS OF NOVA SCHOOL OF BUSINESS AND ECONOMICS.THE REPORT WAS SUPERVISED BY A NOVA SBE FACULTY MEMBER, ACTING IN A MERE ACADEMIC CAPACITY, WHO REVIEWED THE VALUATION METHODOLOGY AND THE FINANCIAL MODEL.
(PLEASE REFER TO THE DISCLOSURES AND DISCLAIMERS AT END OF THE DOCUMENT)
Page 1/40
§ The total airline sector has set its record in 2017 when unveiled $37,7bn of net profit, this was the sector’s best performance ever. The global load factor was estimated to keep on high levels of 81.9% in 2018.
§ The short-haul European market registered a growth rate of 5.9% and easyJet, once again, outperformed the market growing by 7.4%.
§ easyJet has been growing throughout the years and it
intends to keep growing its fleet, its destinations and its bases. Its
load factor reported values higher than the industry average in the
last few years.
§ It is expected that easyJet will continue to pursue a lean
cost strategy by taking hedging positions in fuel and currency;
and increasing its costs per seat benefits by investing in more efficient fleet.
§ easyJet holds the 3rd place on the TOP 10 European Airlines by passengers.
§ The company is number one position in 18 airports and in some of its main destinations easyJet is only surpassed by either its main competitor or the legacy carriers.
§ We recommend a BUY position with a target share price of
£13.99. We believe that the market is underestimating easyJet’s
capacity of value creation. A benefit of 27% is then verified when comparing to the current price.
Company description
The company started flying in 1995 and its headquarters are located at the moment in London Luton Airport. Since its early years the company has won numeral awards for costumer preference and others. Focused on their customer satisfaction the company has followed a few values such as simplicity, one team, integrity, passion, pioneering and above all safety.
“
EASY
J
ET
”
C
OMPANY
R
EPORT
“
AIRLINE”
JANUARY 2019STUDENTS:TERESA RODRIGUES;VERA ROCHA [email protected]; [email protected]
Recommendation: BUY
Price Target FY17: 13.99 £
Price (as of 02-Jan-19) 11.02 £
Bloomberg: EXJ:LN
52-week range (£) 10.30-18.08
Market Cap (£b) 4.410
Outstanding Shares (m) 397
Source: Bloomberg
Source: Thompson Reuters
(Values in £) 2017 2018F 2019F Revenues (millions) 5047 5881 6093 EBITDAR (millions) 709 779 795 EBITDAR Margin 14.05% 13.51% 13.44% EBITDA (millions) 599 584 598 NOPLAT (millions) 320 282 286 EPS 0.80 0.69 0.76 ROIC 14.93% 13.55% 12.10%
Source: Analyst’s calculations
“EASYJET” COMPANY REPORT
PAGE 2/40
Table of Contents
EXECUTIVE SUMMARY ... 3
COMPANY OVERVIEW ... 3
HISTORY, PAST AND FUTURE STRATEGY ... 3
DIVIDEND AND SHAREHOLDER’S POLICY ... 4
SECTOR OVERVIEW ... 5
LEGACY CARRIERS VS LOW COST CARRIERS ... 6
COMPARABLES ... 6
MACROECONOMIC ENVIRONMENT ... 7
GDP ... 7
CURRENCY RISK ... 8
FUEL ... 9
THE BREXIT IMPACT ... 10
TERRORIST ATTACKS IN EU ... 11
AIRPORTS CAPACITY AND THE EU SLOTS SYSTEM ... 12
MAIN LOCATIONS ... 13
FINANCIAL ANALYSIS ... 15
REVENUE VALUE DRIVERS ... 15
COSTS VALUE DRIVERS ... 16
CAPEX AND FLEET PROJECTIONS ... 17
RATIOS ... 17 INCOME STATEMENT ... 18 BALANCE SHEET ... 19 VALUATION ... 20 TERMINAL VALUE ... 21 MULTIPLES VALUATION ... 21 SENSITIVITY ANALYSIS ... 22 REFERENCES ... 23 APPENDIX ... 25
DISCLOSURES AND DISCLAIMERS ... 28
“EASYJET” COMPANY REPORT PAGE 3/40 £4,527.00 £4,686.00 £4,669.00 £5,047.00 2014 2015 2016 2017
Operating Revenues
Operating Revenues Evolution
Executive Summary
The airline sector has transformed the way of travel since 1903, when the first flight took place. Since then, numerous airlines joined the industry and helped people travel around the world. The sector has increased not only in the number of airlines, but especially in its profits. 2017 was a great year for the industry, reaching its highest net profits of all times. In the future years it is expected a slight slower growth.
When comparing companies, we can split the sector in two: Legacy and Low Cost Carriers. As the name says, Legacy Carriers have been operating for a longer time and have been creating a relationship with its passengers along the years. Even though these latter carriers represent the biggest portion of the market, Low Cost Carriers have been able to reach a more competitive position in the overall market. easyJet, as a Low Cost Carrier, has followed the market and has been rising along the time. It reported a grow in its revenues of 8.1% in 2017 and it has also grown its fleet and number of destinations. In its future, the company expects to keep increasing the number of aircrafts, with deliveries scheduled for the next few years. To understand whether the market is under or over-valuing easyJet, an evaluation of the company was performed. For evaluation purposes, the Discounted Cash Flows method was used. In the end, a final target price share of 13.99£ was reached. With a 27% benefit against the current market price, a buy recommendation was then made.
Company overview
easyJet is one of the major players in the airline industry, specifically in the low-cost business.
History, past and future strategy
The company started flying in 1995 and its headquarters are located at the moment in London Luton Airport. Since its early years the company has won numeral
awards for costumer preference and others. Focused on their customer
satisfaction the company has followed a few values such as simplicity, one team, integrity, passion, pioneering and above all safety. The enterprise definitely believes that safety should be the main value and should always be secured. To make the business flow as it is supposed to, the firm uses five key resources: Capital, with a rating of BBB+/Baa1; Aircrafts, with a fleet of 279 aircrafts; People, employing over 12,000 people as pilots, cabin crew, among other staff; Technology and insight, with Figure 1: Operating Revenues evolution
“EASYJET” COMPANY REPORT
PAGE 4/40 its app downloaded 23M times; Relationships w/ stakeholders, with more than 80.2M passengers flying in its flights (values of FY2017).
The company has been growing throughout the years (Figure 1). Its operating
revenues has increased 8.1% from 2016 to 2017. It has also grown its fleet, its
destinations and bases. In 2017 there was a major growth in seat capacity in some of the main European airports as Venice, Manchester, London - Luton and Lyon (Figure 2). These good results made it possible to keep the company’s investments not only on its services but also in expansion and acquisitions.
In an overall view, easyJet has grown more than the market in most of the countries where it operates.
For future perspectives easyJet has taken a few steps into a different direction. Not only is important for the company to grow but it is also important to maintain a sustainable business. In this context the company wants to add A320 and A321neos to give significant cost per seat benefit and also reduce environmental footprint. These measures will also make travel easy and affordable and improves growth and returns to shareholders. In order to achieve these results, delivery of new fleet is planned for the following years.
Another competitive advantage of the company, apart from its low-cost price, is its continuous investment in the digital. The app provided by the airline facilitates to its costumers not only their bookings but also moving around their base airports. The IT team is always trying to improve its e-commerce through its mobile application and has the main goal of gain its costumers loyalty for the future.
easyJet, with a market capitalization of £4,410M, has been growing in the last few years as mentioned before. It has registered a ROA of 5% and a ROS of 8% in 2017.
Dividend and shareholder’s policy
The holders of easyJet’s shares have the rights and obligations that are defined in its Articles of Association, which entitle them to: I. have shareholder documents made available to them, including notice of any general meeting; II. attend, speak and exercise voting rights at general meetings, either in person or by proxy; III. and participate in any distribution of income or capital (easyJet, 2017).
The shareholder panel (Figure 3) is structured with 4 main shareholders that hold around 34% of the company’s shares: Haji-loannou family - easyGroup Holdings Limited, Polys Holding Limited, Stelios Haji-loannou and Clelia Haji-loannou. Apart from these there are a few other relevant shareholders such as Invesco Asset Management (10%) and BlackRock Investment Management (6%). The other 50% of the company is owned by individual investors and other institutions.
Figure 2: Increasing share at key base
airports in the 2017 financial year
Source: easyJet Annual Report 2017
Figure 3: easyJet Shareholders Source: easyJet Annual Report 2017
“EASYJET” COMPANY REPORT
PAGE 5/40 The company reported a pay-out ratio in the last financial year of 50% with
dividends of 40.9 pence per share and expects to keep those numbers for future
perspectives (easyJet, 2017).
Sector Overview
The total aviation sector has set its record in 2017 when unveiled 37,7bn dollars
of net profit, this was the sector’s best performance ever. After that impressive
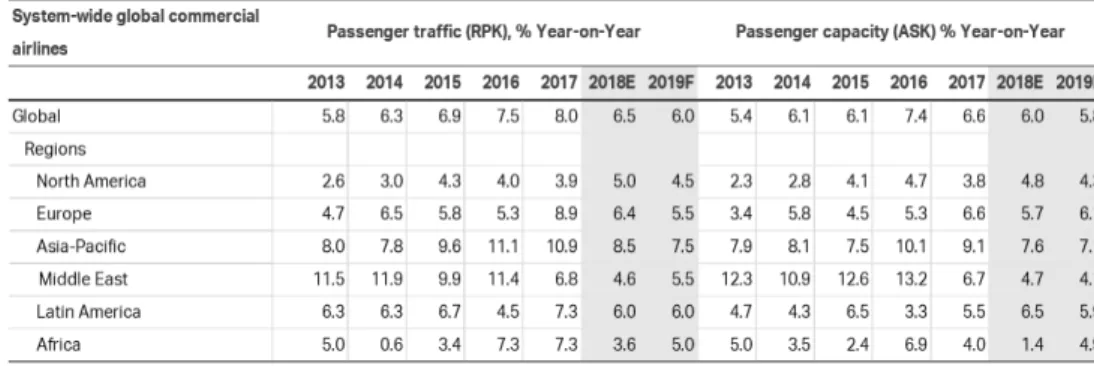
result it is expectable that the overall commercial sector slows down, although still showing very good and sustainable results. For 2018 IATA forecasts that the sector’s net profit will be 32,8bn dollars, being this the lowest result since 2015. For the 2019 period it is likely that the sector will start recovering and go back to the previous year’s level of profitability.
These perspectives for the future are highly positive although the sector’s main cost drivers keep on rising, we talk about fuel and crew costs. The rise of fuel prices mainly affects companies that do not take hedging positions to mitigate this risk, or do not hedge a major part of its fuel. This is not the case for easyJet since it hedges about 65% to 85% of the next 12 months anticipated fuel.
For 2018 it is expected a decrease in the passenger traffic growth rate from 8% in 2017 to 6,5%, and we also detected a lower capacity growth (6%) when comparing to the passenger traffic.
Airlines are pressed to control its capacity expansion in the way that investors tend to fear every time overcapacity is mentioned, therefore we observe a capacity growth rate smaller than the passenger traffic rate. A PwC study shows that when airlines’ capacity grows faster than the GDP the revenue per available seat mile grows at a slower pace.
The global load factor is likely to keep on high levels, in 2018 IATA points to an average passenger load factor of (81.9%) in the commercial fleet, which is supported by a robust perspective of future economic conditions.
easyJet works in the European short-haul aviation market, and the economic outlook for the primary regions where it operates, are promising. Europe’s short-haul market has grown by 5,6% and in the main easyJet’s markets by 2,8%. In 2017 easyJet had an outstanding performance since it outperformed the market in almost all main locations where it operates (Figure 4).
Figure 4: easyJet growth vs Market growth Source: easyJet Annual Report 2017
“EASYJET” COMPANY REPORT
PAGE 6/40
Legacy Carriers vs Low Cost Carriers
Low cost carriers are strengthening its market position in the overall air travel sector. Legacies carriers are therefore being negatively affected by this rapid rise since low cost airlines quickly became one of its primary competitors. In recent years the gap observed between these two types or companies has been narrowing over time. Legacy Carriers concluded that to mitigate the rise of low cost airlines in detriment to legacy carriers they had to became more competitive. Some of them opted to create their own LCC, such as Air France-KLM and Lufthansa and partially failed to do so, mainly due to workforce’s impositions. And others like British Airways have tried to mimic the luggage, seat reservation and in flights services rules implemented by low cost airlines. Overall, these two segments of the sector are not that far away from converging in terms of services offered and consequently we spot an approximation between the share of total flights (Figure 6). Although legacy airlines are successfully cutting down costs, the main airline’s cost are still relatively higher and not even able to compete with low cost ones. Namely the first ones are poor in terms of hedging fuel policies and crew salaries agreements. Then we conclude that if legacy airlines want to compete with LCC these ones would have to decrease its ticket prices, narrowing even more the low margins of the companies. If this happens, then easyJet must more than ever keep improving its competitive advantage over legacy and flag carriers through its lean cost saving policies, never discarding the importance to deliver a high-quality service to its customers.
Comparables
easyJet’s main competition will be the main European low-cost companies which includes Norwegian Air, Ryanair and Wizz Air. Among these three players, Ryanair is the most competitive and the main competitor of easyJet. The Irish airline, with an enterprise value of almost £15 billion (source: Bloomberg), has been improving its traffic and customers throughout the years. Another important company of the sector is Norwegian Air. This airline, with origin and establishment in Norway, is set to an enterprise value of around £3.5 billion (source: Bloomberg) and has been Figure 5: Traffic Results
Source: IATA
Figure 6: Low Cost vs Traditional Scheduled
share of total flights (2007-2016)
“EASYJET” COMPANY REPORT
PAGE 7/40 increasing its number of routes. This company is also a big opponent since it has grown its routes to outside of Europe. Wizz Air, founded in 2003, is the youngest company of the four. Although, it has achieved a value of more than £2.5 billion (source: Bloomberg) and, aside with Ryanair and Norwegian Air, it has improved its customer’s numbers and its routes. These companies also show different levels of revenues (Figure 7). Ryanair has been in the last 4 years the major operator in the low-cost industry with the highest operating revenues since 2015. easyJet positions itself right after its main competitor as the second highest revenues. As expected, Wizz Air, as the smallest company, reports the lowest values, even though they have been showing major improvements since 2015.
Comparing each company’s market capitalization, we cannot leave unnoticed the big difference between Ryanair and the other airlines. Even though this major player can distance itself from the rest of the market in size, right in second is easyJet (Figure 8).
Contrary to all predictions, Wizz Air is reporting the highest price per share showing that its business is growing and evolving. The main competitor of easyJet although recorded on this day the lowest price among all the four (Figure 9).
Between all the comparables, and analysing all the statistics, it is important to notice that, within Europe, Ryanair continues to be the biggest threat to easyJet. Although, with some of its latest changes, as for example the new cabin bag charges, easyJet might benefit since they do not have the cabin luggage fees.
Macroeconomic Environment
GDP
easyJet flies to over 30 countries around Europe and is currently operating in 862 routes (as the end of FY2017). Therefore, a lot of the easyJet’s revenues are dependent on the economic environment of different countries. The relationship between passenger traffic and GDP growth is rather tricky. If in one hand we can consider that air traffic is a consequence of economic growth, on the other hand we can consider it as being one of the economic growth drivers. A developed air transportation structure allows companies to expand internationally and more passenger air freight to be registered. The GDP and the air passengers are highly correlated (Figure 11), the development of the air transportation boosts the economy by allowing people to have more mobility and the companies to internationalize more easily. The economic growth measured by the GDP growth, and its multiplying effect, makes the power purchase capacity increase and therefore the number of passengers is expected to also increase. Since 2010 that Figure 7: Operating Revenues Comparables
Source: easyJet Annual Report 2017 and
2015, Wizz Air Annual Report 2017 and 2015, Ryanair Annual Report 2017 and 2015, Norwegian Air Annual Report 2017 and 2015
Figure 8: Market Capitalization Comparables Source: Bloomberg
Figure 9: Price per share comparables Source: Bloomberg (28/12/2018)
“EASYJET” COMPANY REPORT
PAGE 8/40 the average number of passengers per year has been increasing at a growth rate of 5%, this growth is due to a lot of reasons, but mainly the overall growth of worldwide population, the internationalization of a lot of companies, the expansion of median classes which was highly affected during the 2008 Financial Crisis, the significant increase in tourism and the low-cost airlines market expansion. For the 2018-2037 period it is expected an average annual growth rate of passengers traffic of 3,7% in the European market (Figure 10).
There are certainly differences from region to region, our focus will be Europe since it is where easyJet works. Even though is expectable for the company to expand its routes, it is not expectable to expand to long distance flights outside Europe since that would go against its short-haul strategy.
Europe in these last years has seen its number of passengers to increase as twice as much as the GDP growth rate, alongside with Middle East and Asia Pacific. This has a lot to do with the low-cost airline market expansion and the increase in the number of tourists especially from Asia/Pacific. For the next years is expectable that the GDP will continue to increase but at a slower pace than what we have seen since the 2008 financial crisis recovery (2010). European countries have a lot of challenges ahead of them, mainly the Brexit, which negotiations are still ongoing, and due to its uncertainty about its resolution it is expectable to have a negative effect on the European economy. Also, the 2008 financial crisis is still being felt all over the world and so Europe is not an exception. It is expected that until 2020 the EU Annual Average Real GDP growth rate ranges between 1,5-2% and for the 2021-30 period it is expected a growth rate slightly below the 2%. (Figure 12)
Currency risk
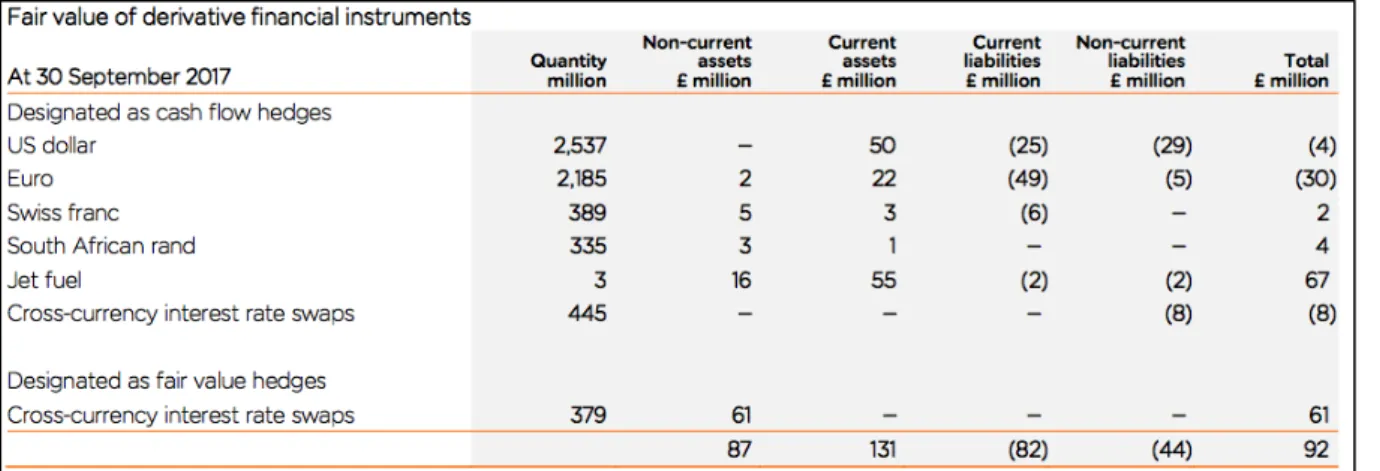
Airline companies have customers from all over the world and consequently their revenues come in different currencies. In the easyJet case the main currencies are Pound, Dollar, Euro, Swiss franc and South African rand.
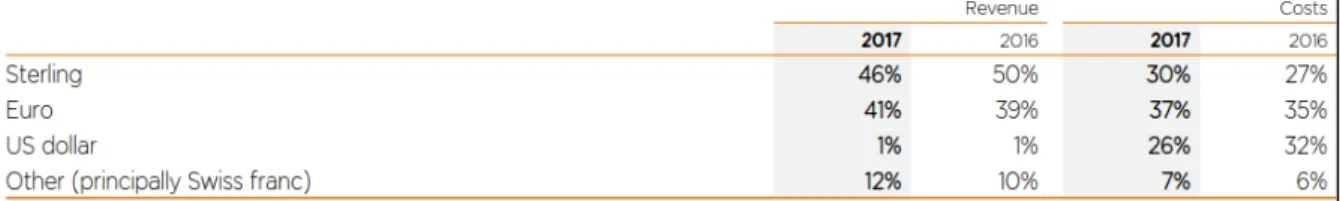
Its main costs, such as fuel, maintenance and the aircrafts are valued in dollars. In the past years the dollar has been a strong currency in relation to the Sterling. This has a negative impact on easyJet accounts since absolute value of costs in Dollars are much higher than the revenues earned in the named currency (26% vs 1%). Figure 12: Growth Projections for the BRICs, US,
UK, EU and the World
Source: PwC Analysis
Figure 10: Estimated annual growth rates for
passenger air traffic from 2018 to 2037, by region
Source: Statista
Figure 11: Worldwide PAX growth vs. GDP
growth (GDP multiplier)
“EASYJET” COMPANY REPORT
PAGE 9/40 On the other side if the Euro/Swiss franc appreciates it will create a net benefit for the company. In this case, the absolute value of the revenues in Euro/Swiss Franc surpasses the costs in the same currency (Figure 13).
There are three main ways that the FX risk impacts an airline company (IATA, 2015)
Firstly, the demand can shift sides when the exchange currency changes because this has a direct impact on the prices. Currently the Euro is stronger than the pound mainly due to the uncertainty that the Brexit negotiations are causing in the markets. The appreciation of Euro means that the prices in euros are lower than in pounds which leads to an increase in demand for Eurozone passengers, and a possible decrease in demand for British passengers.
The second way FX impacts an airline company is through the supply. In the short-run, a higher demand should be managed by allocating aircraft more in locations with higher passenger traffic and/or fly more frequently routes with higher demand. For this reason, FX does not affect supply in the short-run. However, in the long-run it does affect supply as the aircraft prices are denominated in currencies other than pounds. Therefore, since easyJet airplane supplier is Airbus, if the dollar appreciates than costs with acquisition of fleet will be much higher.
Lastly, the financial accounts of the companies have to be converted to the local currency and this can be either positive or negative. At this moment, and for next years, it is expectable that the dollar and euro are going to keep performing stronger than the pound and therefore the FX risk is going to be always a concern. To mitigate this risk easyJet uses foreign currency exchange forwards to hedge the FX risk.
Fuel
Fuel is without any doubt the largest cost of airlines. This sector is majorly exposed to fluctuations of this variable and of course their net margins are highly correlated with its behaviour.
To mitigate the risk of fuel prices fluctuations, airline companies take hedging positions, which means that they will take an offset position in order to prevent losses from the increase of fuel oil prices. There are a few strategies that can be Figure 13: Proportion of revenue and costs
denominated in different currencies
Source: easyJet Annual Report 2017
Figure 14: Crude Oil average $/bbl. Source: World Bank
“EASYJET” COMPANY REPORT
PAGE 10/40 used such as: futures, forwards, swaps and collars. easyJet buys Jet fuel forward contracts to hedge this risk.
For the past years we have been observing an overall drop in the oil prices which is the source for Jet Fuel oil. This has a very positive impact on the company’s net profit (Figure 15). They look at their main cost driver decrease but they usually do not decrease their ticket prices. This means that net margins will for sure increase as seen in the 2017 record ($37.7bn) of airlines net profit. Furthermore, this is not settled but it could be correlated that when fuel prices drop, people in general have more money to spend on other things rather than fuel. Hence the number of trips per passenger and/or number of passengers could increase. If this happens, the benefits from the fuel cost drop would be materialized from two ways.
Although this variable has been fluctuating at low levels no one can anticipate if this will remain or not. Hedging positions are then key so companies do not suffer major losses when fuel prices increase.
In late news after the 6th of December meeting of OPEC, Russia and other main oil producers have agreed to start cutting down its oil production starting in January 2019. This decision comes after the price per barrel hitting very low levels. The US, on the other side, are not a part of this pact, but it is expectable that the country productions starts decreasing somewhere near in the future.
If the members stick to the agreement, the oil prices should start increasing in 2019, since supply will be less than the one recently recorded. After this news the Fuel Futures registered a massive demand (higher than the supply), so companies are aware that an oil price increase is highly probable.
The Brexit impact
As one of the major issues in Europe at the moment, the exit of UK from the European Union will have a highly impact in the companies operating in both regions. Airline sector is, as expected, one of the most impacted sectors since their core business is moving people and cargo around the world. This means that some changes and adjustments will need to be taken over. However, as there is still so much uncertainty in regards of the deal or even the non-deal, airlines are paying close attention to the updates of the situation.
Before we review some major topics where companies will focus throughout the process, it is important to understand the magnitude of the UK market in the European skies. UK has 4 airports on the Top 25 of the busiest ones in Europe, being London – Heathrow considered the busiest in the entire EU. When considering other statistics, we notice that the biggest number of passengers flying
Figure 17: Percentage of US-EU air
traffic by European gateway country
Source: KPMG report
Figure 15: Airline operating profits vs Fuel
Costs
Source: CAPA – Centre for Aviation,
“EASYJET” COMPANY REPORT
PAGE 11/40 in EU are from UK (Figure 16). To what concerns the air traffic between US-EU, the UK is the country that has the biggest portion of movements among all European countries (Figure 17), and is the 4th country in the entire world with more movements
to the US. Also, in the Top 10 European airlines, there are two major UK companies: easyJet (3rd) and British Airways (7th). This means that there are still major airlines that are based in the UK operating in EU and these will be the ones that will face bigger challenges.
Company’s might need to restructure their ownership since to operate intra-EU they will have to be controlled at least by 50% by European nationals. Apart from this, British airlines will need to pay attention to changes in regulations and taxation. Another important issue brought by the Brexit is the need of establishing new sky’s agreements between UK-EU and UK-US.
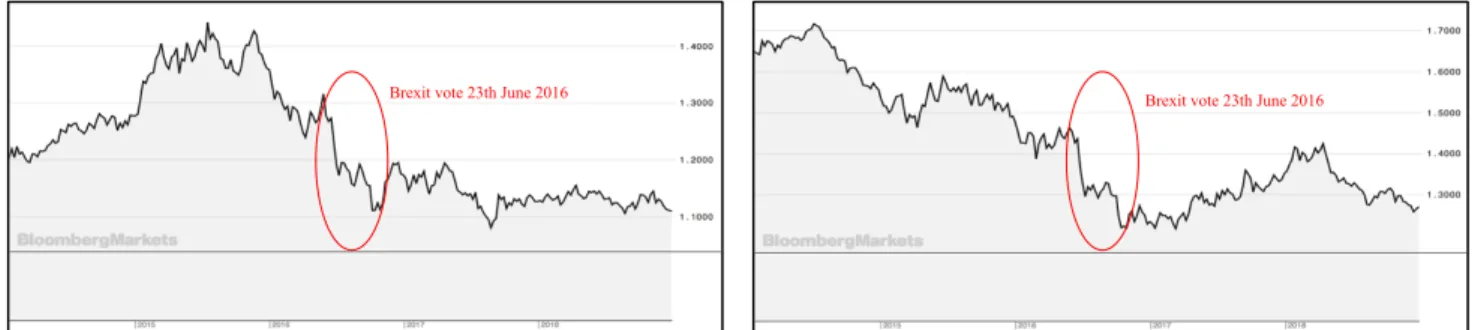
Finally, and with all the uncertainty around this topic, is still difficult to understand what will be the impact on the airline business. Although it is believed that there will be a slight break in the sector for the first few years following the Brexit, as there was per its announcement on 23rd June 2016 (Figure 18)
Considering all these factors, and taking into account the instability of the situation at the moment, we can predict a few scenarios. The main goal for UK and EU would be having a deal, however that scenario is not the only one at this moment. If that does not happen, then major consequences will be applied, and this sector will suffer them in a high level.
If a ‘Hard Brexit’ occurs, UK will be independent to create its own flying policies. However, it will not have flying rights in EU and will not have access to other benefits from an association. Also, there might not be a transition period until December 2020, which means that traveling for citizens and goods will be in prejudice until an agreement is reached.
With a ‘Soft Brexit’ aviation policies would be directly applied and the changes would be much smoother, especially for the airline industry.
With all this uncertainty, easyJet decided to take some action upon the referendum. For this purpose, a new airline, easyJet Europe, was established in Austria, which granted easyJet an Air Operator Certificate (AOC). This airline was operational by the end of last financial year and will be the safe way to diminish the impact of the Brexit.
Terrorist attacks in EU
Terror Attacks are an imminent concern all around the world. The aviation sector is one of the most affected sector every time a terrorist attack happens. The main historical event that had a permanent negative effect on this industry was the 9/11. Figure 16: EU air passengers by country
Source: KPMG report
Figure 18: Reaction of airline market to
Brexit announcement
Source: FE Analytics
Figure 17: Percentage of US-EU air
traffic by European gateway country
“EASYJET” COMPANY REPORT
PAGE 12/40 A more than ever going concern for the aviation industry and the rest of the world are the questions related to security and Terrorist Attacks after all those attacks that Europe has been suffering for the past years. This has a colossal negative impact on the passenger traffic and therefore on the revenues. Just in the past three years Europe suffered at least 10 terrorist attacks that one’s had an immediate but not permanent impact on the airlines.
A substantial majority of this attacks happened on cities where easyJet is based on. The aftermath was a momentary reduction on demand and revenues.
After the 2015 Paris attack European airline companies registered a decrease in passenger traffic in about 1,6% (Figure 19), which translated to $2,5 billion loss. This is a huge amount but as we said before, this terror events have a temporary effect because, as we can observe in the graph, just year and a half after, the Revenues Per Kilometre Flown increased even above the trend line settled in 2009. However, there are events such as the 9/11 that do have a permanent effect on airline’s revenues. The 9/11 caused a global decrease on passenger traffic in 2,7%, and a 7% drop on global airline revenues just on the 2001/2002 period.
Airline companies and the airports have a huge amount invested in security procedures and technologies to avoid terrorist attacks, but nothing is totally under control and these events are unpredictable.
Airports capacity and the EU slots system
Airports capacity is one principal variable that airline companies have into account when forecasting their fleet planning and number of passengers’ prevision. Reliant on the number of slots that they will have for the next season they are able to do their own forecasts.
In Europe, in opposite to the United States, it is used a slot system to allocate the airports landing and take-off rights to airline companies. On a yearly basis IATA does an estimation of how many slots will be available for next season, this is just an average calculated because they need to have in consideration factors such as weather condition. For example, if it snows or there is a storm the number of allocated spots at the airport are lower. The average is fixed for the whole year, which means that airports capacity is not totally used. That prevents delays but it is not totally efficient since in good weather days the airport would be able to have more planes landing than the ones allowed by the fixed number for the year. This is a much-discussed theme around economists, the EU slot system is many times compared with the USA system, which is based on a first come first served rule, so Figure 19: Impact of terror attacks in
RPKs flown by European Airlines
“EASYJET” COMPANY REPORT
PAGE 13/40 there is a better usage of airports capacity on one hand, but on the other hand, there are more delays and for longer periods.
The fixed number of slots is although considered to be economically optimal, which means that one more slot added by airport would increase the traffic in such a way that would not be beneficial.
These two regions of the planet also differ on the method to attribute the slots. In one side Europe has airports coordinators that yearly attribute slots to airline companies based on their historic of usage of slots. This is called the grandfather rule, so if an airline company uses at least 80% of the time (on a yearly basis) of one slot that acquired last season, for the next year it can keep it. Otherwise they will lose that slot and this one will go to a “pool” of slots. This pool of slots allows the entrance of smaller or new airlines in the airports.
The EU slots system is highly criticized by economist and airlines as airport capacity is not being completely used. First it is used the average of slots and this number is fixed for the whole year and second because airlines are only “obligated” to use 80% of the time of the slots that they own.
We consider that the European slots system is both beneficial and disadvantageous for easyJet.
By having the number of slots fixed, and as we said before, the probability of flight delays is lower. Therefore, easyJet can keep its commitments with customers and also follow according their flights schedule. This prevents the incurrence in some costs such as delays and cancelled flight indemnification.
However, if easyJet wishes to expand its market share in certain locations (Amsterdam, London, and Paris) the company is faced with airports capacity constraints. As it happens in the Amsterdam Schiphol airport, which is theoretically at its full capacity.
To conclude, the slots are essential to estimate how many flights will easyJet be able to do. Although when calculating the number of future passengers, this is not the only variable taking into account since the airline can acquire bigger airplanes and have a better usage of its slot.
Main locations
easyJet has three main strategies to grow its market share around Europe:
It is primarily focused on achieving the number one position at the main airports of its routes, so the allocation of aircrafts is based on that matter. The company reports that 98% of its aircrafts are appointed to the airports where easyJet holds a number or number two position in the market share.
Secondly the company is focused on doing a large variety of routes and fly to as many destinations as it can to offer multiple options to its customers but also to
“EASYJET” COMPANY REPORT
PAGE 14/40 reinforce the brand presence in different countries. Moreover, the company aims to have a return on invested capital higher than the cost of capital, and this is usually verified within three years of the investment.
- United Kingdom
easyJet’s prime location is the United Kingdom. In this location the company has a number one position in about 10 airports and a number two position in 2 airports. The company has a strong presence in the main UK airports. For instance, at the Luton airport it has 43% of the short-haul capacity and 47% at the Gatwick airport. Due to the company strategy and since this is a primary market, easyJet has allocated to the UK almost half of its aircrafts: as September of 2017 it had 146 operating in the UK. The company tends to keep on growing its position in this market by uphold its market share at the Luton and Gatwick airports, but also to conquer more market share specially in the Edinburgh, Bristol and Manchester airports.
- France
easyJet aims to improve its presence in the French market where it already has a number one position in the Nice airport and several number two positions in Paris, Bordeaux, Lyon and Toulouse, standing only behind the legacy carrier Air France. In 2017’s financial year easyJet had allocated to France 30 of its aircrafts, meaning that in comparison to 2016 there was an 11% capacity increase in this location. - Italy
easyJet is well positioned in Italy’s airports Venice, Milan-Malpensa and Naples, taking the number one position at those markets. In 2017 its market share in the Venice airport was 26%, 30% in the Naples airport and 40% market share in the Milan-Malpensa airport. Overall, easyJet had a 7% capacity improvement in this market. The company discloses that its motivation to operate in the Italian market is to consolidate its “city-based strategy”, offering its customers various locations to fly to.
- Switzerland
easyJet is the leading airline company both in the Geneva and Basel airports. The company aims to strengthen and keep on consolidating its position in this location and preserve the favouritism of its customers. In 2017 the company had a market share of 43% in the Geneva airport and 60% in Basel, capacity grew by 11% in 2017.
- Germany
For this location, easyJet is solely focused on acquiring market share in specific cities rather than in the whole country. As of the end of September 2017, the airline had 16 airplanes allocated to Germany, more specifically to Berlin and Hamburg airport bases. It is publicly known that the Hamburg base was closed in the
“EASYJET” COMPANY REPORT
PAGE 15/40 beginning of 2018 once the airplanes allocated to that base would add more value to the company if deployed to other locations. Through the acquisition of the Air Berlin it tends to keep on leading the berlin market, which is one of the most visited cities in Europe.
- Netherlands
Amsterdam is another popular choice among tourists from all over the world, therefore it is normal that the Amsterdam Schiphol airport is at its full capacity right now. easyJet has the number two position in the market, as the end of FY2017, being only behind of KLM (Netherlands flag carrier). The firm has been increasing its capacity in this airport since it started flying from there but due to the airport constrains this expansion is becoming more difficult. In 2016 it was registered a capacity growth of 24% against the shy capacity growth of 8% in 2017. Therefore, the company is now focused on flying more frequently from this destination and capture more business and leisure passengers.
- Portugal / Spain
easyJet is widely present in Portuguese airports. In 2017 it had 8 aircraft based in Portugal and 5 airports over the country. Lisbon and Oporto are both very attractive cities to both tourists and business passengers. easyJet tends to keep on improving its position in these markets, just in 2017 it was registered a 14% capacity growth in the two main bases (Lisbon and Oporto).
In Spain, easyJet flies about 150 routes and is present in 20 airports, 7 of which are bases. The company has a strong presence in this market and in 2017 opened one new seasonal destination, Palma de Mallorca. So far this has been proving to be a good bet and the company is studying new possibilities on opening new routes with the same seasonal theme. This is a very trendy vacation destination among tourists from all Europe. 2017 recorded a 14% capacity growth in the Spanish market, and the company aims to keep on growing its position in the country.
Financial Analysis
Revenue Value Drivers
Revenues are driven by a variety of factors, however, and since the seat revenues represent the majority of the total operating revenues, most of those factors are dependents of a main one, the number of aircrafts. Seat revenues are calculated by multiplying the revenue per Available Seat Kilometres (ASK) and ASK itself. For that reason, the changes on the ASK is the key to understand variations in revenues. Its value will depend on various factors. The load factor, which was considered an average of the previous years (91.8%); the seat per aircraft, that remains constant throughout the years since the size of airplanes does not change in a major scale Figure 20: Seat flown 2014-2019 (Millions)
“EASYJET” COMPANY REPORT
PAGE 16/40 (169); the sectors flown (Figure 20), that will increase with the increase in the fleet; and last but most important, the number of aircrafts. The fleet fluctuations plays a very important part in the revenue’s variations of the company. For the last 4 years, the company has been acquiring new aircraft. Although, as at this moment, it is known that the company has a schedule of future deliveries for new aircrafts for the next few years. Even though those new acquisitions might be replacing old aircrafts, we do notice that there will still be an increase on the fleet. Apart from this, the company has also maintained and has intentions to maintain leased fleet that also plays an important part, since it is also generating seat revenue.
As the main factor, the forecast of the fleet was based on the schedule of deliveries and the projections of fleet from the company (Figure 21). It was also taken into account the percentage of finance leasing and operating leasing to understand how many units of each would the company have for the future (Figure 22).
Even though it plays a smaller role, non-seat revenues, being less than 2% of total revenues, it is still important to understand how they will perform in the future. As said before, non-seat revenues are earnings obtained from services sold on behalf of partners. These costs were forecasted as a percentage of seat revenues.
Costs Value Drivers
- Fuel
Fuel is undoubtedly the main cost for airline companies, as we previously discussed its price is highly volatile. Therefore, although there are forecasts there is always the possibility of the actual values to be very different than the ones expected. And for that reason, easyJet has a hedging policy to mitigate that risk. For forecast purposes we have considered the available data disclosed by World Bank about the future prices of crude oil which is the material that is refined and turned into Jet fuel oil.
In order to estimate the total fuel costs, we have considered three main drivers. Fuel Costs per km flown which is calculated by multiplying the fuel cost per litre and the litres per kilometres. To forecast the litres consumed per kilometre we considered the expected efficiency of 15% of new aircrafts.
We understand that the future will have higher prices of crude oil than the ones observed at the moment, this must come from a policy that is already being highly discussed by countries which are oil producers in order to decrease the supply of oil consequently increasing the commodity price. Moreover, to forecast the fuel costs we considered that the company will solely invest in the airplanes of the A320 family which are about 15-20% more efficient than the A319.
Figure 22: Number of Aircraft owned,
Operating leased and Financial leased
Source: Analyst Report
Figure 23: Crude Oil Price Source: Analyst Report Figure 21: Total of Aircraft per year Source: Analyst Report
“EASYJET” COMPANY REPORT
PAGE 17/40 - Airports ground handling
The airports and ground handling expenses include every service that an airline company needs since the minute it lands at an airport till the minute of the departure, such as baggage handling and passengers’ transportation, fuel and freight maintenance, catering and check-in.
Low cost airlines are known by having its own crew members playing multiple roles in order to leave apart the option of subcontracting this type of service. For example, the crew members are the ones that assist the passengers on the boarding gate, they are the ones that clean airplanes in between flights. Most of this cost is then associated to airport landing fees.
Capex and Fleet projections
The capital expenditure of the company will translate the changes in Property, Plant and Equipment and in Other Intangible Assets. Therefore, its value will depend on the movements of those two variables. It is clear that the PP&E is the variable causing the biggest impact. PP&E will include the fleet, not only own aircrafts but also the ones under finance leasing. Will also include fixtures, fittings and equipment and computer hardware. Among all these assets, the most relevant one will be the fleet. easyJet’s fleet as mentioned before is increasing and the company has perspectives of not only continuing the increase but also improving it. The schedule of new and improved fleet is set and it will represent a relevant part on its Capex (Figure 24). As there are perspectives of the goals as for new aircraft until 2022, the calculations of Capex growth will be more accurate. As for finance leases, this is predicted taking previous years tendency and using the percentage of total of airplanes for future projections. As for another component of the Capex, the Other Intangible Assets, these were considered dependents of the operations of the company. Therefore, for future perspectives it was fixed last year’s portion of the total revenues for estimation.
Ratios
For a more accurate valuation, it is also important to look at ratios of the company. Analysing some of the efficiency ratios of easyJet, we notice that the collection period has been quite good in the last four years, an average of 12 days. This is mainly because the company’s core sales come from sells of airplane tickets which are normally collected at the moment of the ticket purchase. Moreover, the company has been able to negotiate good payment terms with suppliers with a payable period ratio of 60 days (in 2017). This ratio also demonstrates the strength of the business. Figure 24: New Aircraft per year
Source: Analyst Report
Figure 25: Current Ratio Comparables Source: Bloomberg
Figure 26: Cash Ratio Comparables Source: Bloomberg
“EASYJET” COMPANY REPORT
PAGE 18/40 Concerning the liquidity of the business, the company had a Current Ratio of 1.04 in 2017 (Figure 25). We can notice that the ratio has had positive fluctuations in the last few years. When comparing with its closer competitors, we see that the company shows relatively good values. However, when analysing the ability of the company to pay its short-term debt, we notice that its cash ratio (Figure 26) has presented values much lower than those of its comparables (0.8 in 2017). This means that easyJet might face difficulties obtaining credit.
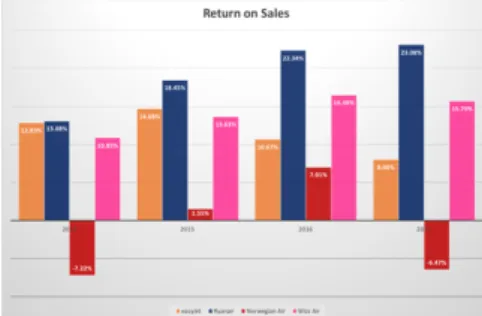
It is also important to measure the profitability (Figure 27 and 28) of the business to understand how it is performing. Although it maintains positive returns to sales (8% in 2017) and to assets (5.32% in 2017), these ratios have been decreasing for the last 4 years. This means that both the company’s sales and assets have been creating less value along the years. Even though these values might be concerning, we can notice that tendency among the other three major players.
Income Statement
- Revenues
easyJet’s operating revenues can be separated in two types: seat revenues and non-seat revenues.
To what it concerns to seat revenues, this is the sale of flight seats and includes also other charges as: provision of checked baggage, allocated seating and administration, credit card and change fees.
This is, as expected, the most important part of the total operating revenue of the company. In the last few years, even though there was a slight break in 2016, this was overtaken by a strong growth in 2017 of 8% to £4,958M (Figure 29). As mentioned before, the seat revenues are forecasted through the ASK value. as expected, there will be increases for the future while the company acquires new aircrafts and is able to increase its passenger numbers.
Since October 2017 easyJet started presenting its revenues by splitting into passengers and ancillary revenues, to be in line with the revenues presentations of other airline companies. Although non-seat revenues are not much significant when compared to seat revenues, in 2017 these ones accounted for 1,76% of seat revenues. easyJet on the 2017 Annual Report disclosures that non- seat revenues are the recognition of commissions that do not belong to easyJet but to its partners, namely insurance companies and all kind of products that the airline company sells during the flights. As mentioned before, these revenues are calculated based on the seat revenues, which means that they will both go in line and increase for future perspectives (Figure 30).
Figure 29: Seat Revenues 2014-2029 Source: Analyst’s Report
Figure 30: Non-Seat Revenues 2014-2029 Source: Analyst’s Report
Figure 27: Return on Sales Comparables Source: Bloomberg
Figure 28: Return on Assets Comparables Source: Bloomberg
“EASYJET” COMPANY REPORT
PAGE 19/40
- Costs
As mentioned before, the main costs of easyJet are fuel and airport and ground handling costs. As they both depend on the revenues, they will be moving with the same trend. Operating costs growth is accompanied by the growing operating revenues as we expected (Figure 31). In the last year of our Forecast (2029) we expect a Total Operating Revenue of £9,7bn and a Total Operating Cost of £8,9bn. Apart from these, Aircraft dry leasing is another the major cost of easyJet. We estimate that the fleet composition is established by approximately 30% of owned aircrafts and 30% of leased aircrafts.
In order to forecast the rentals expense value, we have considered the assets value. To do so, we consulted the price of each type of plane, this one was in dollars so we had to apply the exchange rate between GBP USD (1,28%), and for last in the easyJet Annual Report the life of the assets it is said to be 23 years.
We have then applied the discounts rates that Airbus gives to airlines have every time they order a certain number of planes. To discount the value of each airplane we used the interest yield of 5Y Corporate Bonds with an AAA rating (approximately 1,88%).
For future purposes we considered that the rental expenses would be an average of the rental expense of each type of airplane times the number of airplanes leased (Figure 32). We foresee that leasing costs will increase in the future since the easyJet’s fleet is expected to grow (which has implied a growth of leased airplanes).
- EBIT
EBITDAR is significantly higher than easyJet’s EBIT, which means that the company has substantial costs with Aircraft dry leasing and Depreciation. As we can observe in the Figure 33, EBIT hit its pick in 2021 and after that year it starts decreasing as it is expected since the company is growing at a slower pace in the subsequent years. Also, both operating and EBITDAR margins are expected to decrease over the years as load factor, although above the industry average, is not expected to increase and economic growth in Europe is not expected to be as good as what we have been observing in the past years.
Balance sheet
When analysing the balance sheet of the company it is perceptible that the main portion will be of assets and liabilities related to the core business. In the assets side, we have Property, Plant and Equipment as the main component reaching a value of £3525M in 2017 (Figure 34). This can be explained as this component will include the fleet owned and finance leased, and these are assets with high values. Figure 31: Operating Revenues and
Costs 2014-2029
Source: Analyst’s Report
Figure 34: Net PP&E 2014-2019 Source: Analyst’s Report
Figure 33: EBIT and Margins Source: Analyst’s Report
Figure 32: Aircraft Dry Leasing costs Source: Analyst’s Report
“EASYJET” COMPANY REPORT
PAGE 20/40 In the liabilities side, we can see that the most relevant (with higher values) components are the Trade and other payables and Unearned revenues. To forecast the core business assets was mainly used percentages of total revenues or costs. In non-core components, we perceive the relevance of the Goodwill component, since it has been constant for the past 4 years and it was considered constant for forecast purposes. In the financial division, we assumed for the next years a 0 value of Excess Cash and as for the Borrowing we considered the difference between the sum of Invested Capital in Core and Non-Core Business and Excess Cash (that in this case is 0) and the Equity value. The value of equity is forecasted adding last year’s Equity, Total Comprehensive Income and the Transactions with shareholders (this last one is estimated based on the company’s expectations of a 50% pay-out ratio).
Valuation
In order to evaluate the company, we have used the Discounted Cash Flows approach. To do so we have initially calculated the weighted average cost of capital: this refers to the opportunity cost that an investor has by investing in the company rather than in other business with comparable risk. To come to the final WACC we firstly estimated the cost of capital for all investors, the debt and the equity ones. The cost of debt was achieved by adding to the risk-free rate (UK 10 years Government Bonds) of 1,31% the default spread rate of easyJet which is 1,20%. To find the default spread rate, we have considered the company’s rating which is BBB+. The cost of equity was calculated through the CAPM formula (Re= Rf + Blevered*Rp). To compute the Beta of the company we used the Company Comparables Analysis approach.
Hence to obtain the Beta trough the comparables we have first identified the two groups of comparables of easyJet: The Low-Cost Carriers peers (Ryanair; Wizz air and Norwegian Air) and the Legacy Carriers (Lufthansa; IAG; Air France and SAS). Moreover, we obtain the raw betas of the comparables by consulting Bloomberg. Next, we unlevered the equity Betas to obtain the asset Betas and we then obtained the average unlevered Betas. As a last step we re-levered the Betas and achieved the company’s equity Beta. We assumed a target Debt to Value ratio of 20% and we considered the market risk premium as the Damodaran UK total equity risk premium (5.65%) for mature markets. Finally, we reached a WACC of 4,93%. Figure 35: WACC assumptions
Source: Analyst’s report
Figure 36: Beta Unlevered of
Comparables
“EASYJET” COMPANY REPORT
PAGE 21/40
Terminal Value
As a firm grows it tends to reach a term where its growth becomes continuous and stable at a rate more or less like the economy’s growth on the regional area where it operates. Since for the future Europe is expected to grow about 1,5%-1,8% per year until 2030 it is expectable that this industry grows at a faster pace. When easyJet reaches 2029 the company is growing at a stable growth rate of 2%. This one was obtained by subtracting to one, the Discounted Free Cash Flow value over the NOPLAT multiplying the ROIC. Over the years until 2029FY we observe a slow decrease in the company’s ROIC, which is normal since the NOPLAT is also decreasing but investment keeps increasing over these years.
To come to the terminal value, we based ourselves on the Stable Growth Model which assumes that beyond the terminal value period the company will grow forever at a constant rate, in this case 2%. Therefore, we applied this growth rate to easyJet’s 2029FY forecasted NOPLAT (£160M), reaching a terminal value of
£3,490.8 million. We have then discounted this value using the 4.93% cost of
capital which has resulted in a discounted Terminal Value of £2,156.61 million. The company’s Enterprise Value £5,294.05 million was obtained by summing to all the discounted Free Cash Flows of the forecasted periods the Non-Core Invested Capital. The bridge between Enterprise Value and Equity Market Value are the Net Assets, Non-Core result and Financial result, therefore the implied equity market value is £5,555.72 2017FY number of shares outstanding was 397, which then leads us to a final estimated share price of £13,99.
Multiples Valuation
Additionally to the DCF valuation, we performed a Multiple Analysis. First and foremost, it is important to refer that this kind of valuation lacks in terms of comparison and does not consider the information about the company’s future. Hence, to perform this valuation, we used two metrics that we consider key essential: EV/EBITDA and P/E. To calculate the industry average of these tow ratios we considered three of easyJet’s comparables (Norwegian; Ryanair; Wizz Air) and easyJet itself. We obtained an average EV/EBITDA of 7,31x, with this value we reached an EV of £4,377.19 million and an implicit share price of £11,03. The Figure 37: Multiples Analysis
“EASYJET” COMPANY REPORT
PAGE 22/40 company’s EV/EBITDA is slightly above the average of the industry, however easyJet only outperforms one of its peers, Wizz Air.
Concerning the P/E ratio, easyJet has been outperforming all its peer that are been considered for this analysis. Therefore, it is understandable that the implicit share
price registers low values £8.26.
Sensitivity Analysis
We performed a sensitivity analysis by changing what we consider to be some of the main value and cost drivers: Load Factor; Unlevered company Beta; Fuel costs growth rate and the number of aircraft growth rate.
Firstly, we analysed the impact of changes on the number of aircraft growth. We estimated two cases. For the upside case, with a growth rate of 2%, we obtained a Terminal Value of £4,276.02 and a share price of £15.32. on the downside, considering only an 1% growth rate, the Terminal Value was £1,693.45 and a share price of £10.71.
Secondly, we changed the load factor for both optimistic (95%) and pessimistic (90%) values. The first case gave us a Terminal Value of £8.473.8 and an implicit share price of £23.35. However, when in a pessimist case the Terminal Value falls to £2.227,04 and therefore its share price falls as well to a value of £11,22 per share. For a more critical analysis, we also calculated the unlevered Beta of the company using a regression model against FTSE 100 Index. In this regression we reached a beta value of 0.949. With a higher beta the Terminal Value drops to a value of £2,193.4.
Lastly, we evaluated a variation in the fuel prices growth rate considering once again an upside (0.5%) and a downside (1%) case. As expected, when the fuel costs drop, the company will increase its value, reaching this way a Terminal Value of £3,753.12 and a share price of £14.42. Yet, when the fuel costs increase 1%, the Terminal Value of the company will drop to a value of £2,071.78 and its share price to £11.09.
“EASYJET” COMPANY REPORT
PAGE 23/40
References
-
Airline regulation – what you need to know with Brexit approaching?. (2016). Retrieved fromhttp://www.nortonrosefulbright.com/knowledge/publications/144673/airline-regulation-what-you-need-to-know-with-brexit-approaching
-
easyJet. (2017). ANNUAL REPORT AND ACCOUNTS 2017. Retrieved fromhttp://corporate.easyjet.com/~/media/Files/E/Easyjet/pdf/investors/results-centre/2017/2017-annualreport-and-accounts-v1.pdf
-
European Strategy and Policy Analysis System. (2015). Global Trends to 2030: Can the EU meet the challenges ahead?. Retrieved from http://ec.europa.eu/epsc/sites/epsc/files/espas-report-2015.pdf-
IATA. (2010). The Impact of September 11 2001 on Aviation. Retrieved fromhttps://www.iata.org/pressroom/documents/impact-9-11-aviation.pdf
-
IATA. (2018). Future of the Airline Industry 2035. Retrieved fromhttps://www.iata.org/policy/Documents/iata-future-airline-industry.pdf
-
IATA. (2018). Industry Statistics Fact Sheet. Retrieved fromhttps://www.iata.org/pressroom/facts_figures/fact_sheets/Documents/fact-sheet-industry-facts.pdf
-
Khan, M. (2018). Brexit’s Open Skies dilemma divides airlines. Financial Times. Retrieved fromhttps://www.ft.com/content/612977f0-21bb-11e8-9a70-08f715791301
-
Koller, T., Goedhart, M., & Wessels, D. (2015). Valuation (5th ed.). Hoboken: Wiley.-
KPMG. (2016). Brexit: implications for airlines. Retrieved fromhttps://assets.kpmg/content/dam/kpmg/cl/pdf/2016-11-kpmg-chile-advisory-brexit-airlines.pdf
-
KPMG. (2018). The Aviation Industry Leaders Report 2018: Navigating the Cycle. Retrieved fromhttps://assets.kpmg/content/dam/kpmg/ie/pdf/2018/03/ie-navigating-the-cycle-aviation.pdf
-
Lenoir, N. (2016). Research for TRAN Committee: Airport slots and aircraft size at EU airports.Brussels: European Parliament. Retrieved from
http://www.europarl.europa.eu/RegData/etudes/IDAN/2016/585873/IPOL_IDA(2016)585873_EN.pdf
-
McDonald, C. (2015). How easyJet uses digital to drive competitive advantage. Retrieved fromhttps://www.computerweekly.com/news/4500255119/How-Easyjet-uses-digital-to-drive-competitive-advantage
-
Norwegian Air. (2017). ANNUAL REPORT 2017. Retrieved fromhttps://www.norwegian.com/globalassets/ip/documents/investor-relations/annual-report-2017-interactive.pdf
-
Oxley, D. (2017). Estimating the impact of recent terrorist attacks in Western Europe. IATA. Retrieved from https://www.iata.org/publications/economic-briefings/European-terrorism-impact.pdf-
Oxley, D., & Buecking, N. (2015). Exchange rates and aviation: examining the links. IATA. Retrieved from“EASYJET” COMPANY REPORT
PAGE 24/40
-
Oxley, D., & Buecking, N. (2015). Exchange rates and aviation: examining the links. IATA. Retrievedfrom https://www.iata.org/publications/economics/Reports/FX-impacts-on-airlines-financing-demand.pdf
-
PwC. (2015). Fuel price volatility: How are airlines responding to the challenge?. Retrieved from https://www.pwc.com/us/en/industrial-products/publications/assets/pwc-airline-fuel-price-volatility.pdf-
PwC. (2018). Tailwings Report: 2018 airline industry trends. Retrieved fromhttps://www.pwc.com/us/en/industrial-products/publications/assets/pwc-tailwinds-report-2018-airline-industry-trends.pdf
-
Ryanair. (2017). Annual Report 2017. Retrieved from https://investor.ryanair.com/wp-content/uploads/2017/07/Ryanair-FY2017-Annual-Report.pdf-
Simmons, B. (2018). UK exit from the EU and its impact on the UK aviation industry. Retrieved fromhttps://www.internationalairportreview.com/article/75237/brexit-and-aviation/
-
Wizz Air. (2017). ANNUAL REPORT AND ACCOUNTS 2017.-
World Economic Outlook database, October 2018. (2018). Retrieved from“EASYJET” COMPANY REPORT PAGE 25/40
Appendix
Financial Statements
Income Statement“EASYJET” COMPANY REPORT PAGE 26/40 Balance Sheet
“EASYJET” COMPANY REPORT
PAGE 27/40 Free Cash Flow
“EASYJET” COMPANY REPORT
PAGE 28/40
Disclosures and Disclaimers
Report Recommendations
Buy Expected total return (including expected capital gains and expected dividend yield) of more than 10% over a 12-month period.
Hold Expected total return (including expected capital gains and expected dividend yield)
between 0% and 10% over a 12-month period.
Sell Expected negative total return (including expected capital gains and expected
dividend yield) over a 12-month period.
This report was prepared by Teresa Rodrigues and Vera Rocha, Master in Finance students of Nova School of Business and Economics (“Nova SBE”), within the context of the Field Lab – Equity Research.
This report is issued and published exclusively for academic purposes, namely for academic evaluation and master graduation purposes, within the context of said Field Lab – Equity Research. It is not to be construed as an offer or a solicitation of an offer to buy or sell any security or financial instrument.
This report was supervised by a Nova SBE faculty member, acting merely in an academic capacity, who revised the valuation methodology and the financial model.
Given the exclusive academic purpose of the reports produced by Nova SBE students, it is Nova SBE understanding that Nova SBE, the authors, the present report and its publishing, are excluded from the persons and activities requiring previous registration from local regulatory authorities. As such, Nova SBE, its faculty and the authors of this report have not sought or obtained registration with or certification as financial analyst by any local regulator, in any jurisdiction. In Portugal, neither the authors of this report nor their academic supervisor is registered with or qualified under COMISSÃO DO MERCADO DE VALORES MOBILIÁRIOS (“CMVM”, the Portuguese Securities Market Authority) as a financial analyst. No approval for publication or distribution of this report was required and/or obtained from any local authority, given the exclusive academic nature of the report. The additional disclaimers also apply:
USA: Pursuant to Section 202 (a) (11) of the Investment Advisers Act of 1940, neither Nova SBE nor the authorsA of this report are to be qualified as an investment adviser and, thus, registration with the Securities and Exchange Commission (“SEC”, United States of America’s securities market authority) is not necessary. Neither the author nor Nova SBE receive any compensation of any kind for the preparation of the reports.
“EASYJET” COMPANY REPORT
PAGE 29/40 Germany: Pursuant to §34c of the WpHG (Wertpapierhandelsgesetz, i.e., the German Securities Trading Act), this entity is not required to register with or otherwise notify the Bundesanstalt für Finanzdienstleistungsaufsicht (“BaFin”, the German Federal Financial Supervisory Authority). It should be noted that Nova SBE is a fully-owned state university and there is no relation between the student’s equity reports and any fund raising programme.
UK: Pursuant to section 22 of the Financial Services and Markets Act 2000 (the “FSMA”), for an activity to be a regulated activity, it must be carried on “by way of business”. All regulated activities are subject to prior authorization by the Financial Conduct Authority (“FCA”). However, this report serves an exclusively academic purpose and, as such, was not prepared by way of business. The author - a Master’s student - is the sole and
exclusive responsible for the information, estimates and forecasts contained herein, and for the opinions
expressed, which exclusively reflect his/her own judgment at the date of the report. Nova SBE and its faculty have no single and formal position in relation to the most appropriate valuation method, estimates or projections used in the report and may not be held liable by the author’s choice of the latter.
The information contained in this report was compiled by students from public sources believed to be reliable, but Nova SBE, its faculty, or the students make no representation that it is accurate or complete, and accept no liability whatsoever for any direct or indirect loss resulting from the use of this report or of its content. Students are free to choose the target companies of the reports. Therefore, Nova SBE may start covering and/or suspend the coverage of any listed company, at any time, without prior notice. The students or Nova SBE are not responsible for updating this report, and the opinions and recommendations expressed herein may change without further notice.
The target company or security of this report may be simultaneously covered by more than one student. Because each student is free to choose the valuation method, and make his/her own assumptions and estimates, the resulting projections, price target and recommendations may differ widely, even when referring to the same security. Moreover, changing market conditions and/or changing subjective opinions may lead to significantly different valuation results. Other students’ opinions, estimates and recommendations, as well as the advisor and other faculty members’ opinions may be inconsistent with the views expressed in this report. Any recipient of this report should understand that statements regarding future prospects and performance are, by nature, subjective, and may be fallible.
This report does not necessarily mention and/or analyze all possible risks arising from the investment in the target company and/or security, namely the possible exchange rate risk resulting from the security being denominated in a currency either than the investor’s currency, among many other risks.
The purpose of publishing this report is merely academic and it is not intended for distribution among private investors. The information and opinions expressed in this report are not intended to be available to any person other than Portuguese natural or legal persons or persons domiciled in Portugal. While preparing this report, students did not have in consideration the specific investment objectives, financial situation or